522200 research-article2014
JPAXXX10.1177/0734282914522200Journal of Psychoeducational AssessmentLee and Paek
Article
In Search of the Optimal Number of Response Categories in a Rating Scale
Journal of Psychoeducational Assessment 2014, Vol. 32(7) 663–673 © 2014 SAGE Publications Reprints and permissions: sagepub.com/journalsPermissions.nav DOI: 10.1177/0734282914522200 jpa.sagepub.com
Jihyun Lee1 and Insu Paek2
Abstract Likert-type rating scales are still the most widely used method when measuring psychoeducational constructs. The present study investigates a long-standing issue of identifying the optimal number of response categories. A special emphasis is given to categorical data, which were generated by the Item Response Theory (IRT) Graded-Response Modeling (GRM). Along with number of categories (from 2 to 6), two scale characteristics of scale length (n = 5, 10, and 20 items) and item discrimination (high/medium/low) were examined. Results of this study show that there was virtually no difference in psychometric properties of the scales using 4, 5, or 6 categories. Most deteriorating change was observed when the number of response categories reduced from 3 to 2 points in all six psychometric measures. Small moderating effects by scale length and item discrimination seem to be present, that is, a slightly larger impact on the psychometric properties by changing the number of response categories in a shorter and/ or highly discriminating scale. This study concludes with the suggestion that a caution should be made if a scale has only 2 response categories but that limitation may be overcome by manipulating other scale features, namely, scale length or item discrimination. Keywords reliability, validity, scale, survey, psychometrics, item discrimination, scale length, IRT, GradedResponse Model
Despite a long history of research (e.g., Bendig, 1954; Muñiz, García-Cueto, & Lozano, 2005; Preston & Colman, 2000; Symonds, 1924), an optimal number of response categories in a rating scale is largely undecided. Scales with 2 response categories can make the respondents choose between dichotomous responses (often “yes” or “no”) even when they do not have a firm position. Three-point scales are prone to yielding superfluous midpoint answers (Neumann & Neumann, 1981), by providing them the opportunity not to take a position (e.g., “undecided” or “I don’t know”; see Gilljam & Granberg, 1993) or by having them to choose the middle category regardless of the content being asked (Si & Cullen, 1998). With a larger number of the response categories, let’s say 10 or higher, the respondents may not be able to discriminate fine intervals 1University 2Florida
of New South Wales, Sydney, Australia State University, Tallahassee, USA
Corresponding Author: Jihyun Lee, School of Education, The University of New South Wales, Sydney, New South Wales 2052, Australia. Email:
[email protected]
Downloaded from jpa.sagepub.com at OAKLAND UNIV on May 28, 2015
664
Journal of Psychoeducational Assessment 32(7)
between the adjacent categories or may not even consider the categories at the lower or higher end. Thus far, the decision on the optimal number of response categories has been left to either convenience or tradition (Fox & Jones, 1998). In practice, response categories between 4 and 6 seem to be a popular choice in many instruments. For instance, the most common response categories on attitudinal and motivational constructs in the 2009 Programme for International Student Assessment (PISA) Student Questionnaire are based on either 4 or 6 points. Category labels of 4 points were strongly disagree, disagree, agree, and strongly agree; almost never, sometimes, often, and almost always; and never or hardly ever, in some lessons, in most lessons, and in all lessons.” For 6 points, not useful at all and very useful were used at either end with no verbal anchoring in-between. Extant literature makes a diverse range of recommendations. Many studies point out that a greater number of scale points are associated with better psychometric properties such as reliability and item correlations (Muñiz et al., 2005, Nunnally, 1978) as well as validity (e.g., Churchill & Peter, 1984; Lozano, García-Cueto, & Muñiz, 2008). Basically, reliability and validity estimates will be positively associated with the amount of item variance, which tends to be greater when more scale points are used. Others claim that the benefits of having a higher number of scale points tend to reach a plateau beyond a certain point, such as at 4 points (e.g., Muñiz et al., 2005), at 5 points (e.g., Neumann & Neumann, 1981), at 6 points (e.g., Green & Rao, 1970), at 7 points (e.g., Cicchetti, Showalter, &Tyrer, 1985; Cox, 1980; Lozano et al., 2008; Preston & Colman, 2000; Symonds, 1924), at 9 points (e.g., Cox, 1980), or at 11 points (e.g., Kroh, 2007). For example, there was no difference in reliability and validity in the scales with 4 or more response points (Muñiz et al., 2005). Difference in inter-rater reliability became trivial from 7 points up to 100 points (Cicchetti et al., 1985). Some other researchers argue that there is an optimal range rather than a single optimal point. No differences were found between 4 and 7 (Lozano et al., 2008); between 5 and 7 (Dawes, 2008); between 5 and 9 (Givon & Shapira, 1984); and between 7 and 10 (Preston & Colman, 2000) when test–retest reliability, scale variance, Cronbach’s alpha, and interitem correlations were considered. Another view supports the claim that the number of response categories makes no meaningful differences to scales’ psychometric properties such as reliability, validity, mean scores, variation, skewness, kurtosis, and factor-analytic results (Dawes, 2008; Matell & Jacoby, 1971; Schutz & Rucker, 1975). Neither reliability nor validity differed between 2-point and 19-point scales (Matell & Jacoby, 1971). No difference was found in the factor-analytic data configuration in scales of 2 to 7 response points (Schutz & Rucker, 1975), nor were in skewness and kurtosis by using either 5 or 11 response categories (Dawes, 2002). Last, some studies have recommended fewer scale points for better psychometric properties (Fox & Jones, 1998). When more options are given, the respondents may perceive the differences between the adjacent categories to be smaller, which can produce inconsistent responses (Fox & Jones, 1998). Response style or systematic errors can also be more easily introduced to a greater number of response categories (cf. Lee, 2012). Thus, better reliability potentially shown in the scales with greater numbers of response categories may simply be due to systematic method variance and not necessarily due to the traits being measured (Chang, 1994). These multiple views on the optimal number of response categories invite yet another investigation of this issue. Currently, our understanding is also limited in knowing at what scale points the largest increase/drop is expected by changing the number of response category. The present study attempts to shed some light on this question as well. Previous studies showed that the most substantial change of reliability and validity occurs when the number of categories changes to 3 points from either 2 or 4 points (e.g., Lozano et al., 2008). Others report the largest drop between 6 and 3 categories (Green & Rao, 1970) or between 5/6 and 2 categories (Muñiz et al., 2005). Although there has not been a clear direction, this information may be pertinent when survey developers need to collapse response categories for administration efficiency or in the process of
Downloaded from jpa.sagepub.com at OAKLAND UNIV on May 28, 2015
665
Lee and Paek
data analysis and reporting. The question is how much reduction in the number of response categories can be allowed without sacrificing the scale’s psychometric properties. An important point to note is that findings of many previous studies are based on continuous data when the rating scale responses are, strictly speaking, categorical. A series of categorical data were generated by simulation in this study. That is, we make the first attempt to investigate the optimal number of response categories when the response options are distinct and ordered categories; thus, the data treatment and its scoring should be strictly categorical. Another aspect that the present study considers is the scales’ evaluation criteria. Studies have used different measures of evaluative indices. As shown in Bendig (1954), test–retest reliability was best with 7 response categories while inter-rater reliability was at its highest with 3 response categories. Preston and Colman (2000) reported that criterion validity was best with 5 or more categories while interitem correlations and test–retest reliability were at the highest with 6 (or more) and 7 (or more) response categories, respectively. The present study addresses this issue more systematically by using several different types of reliability and validity measures as well as two correlation estimates.
Number of Response Categories and Scale Length Psychometric properties of a scale are known to be influenced by its length (i.e., the number of items in a scale). Reliability, in particular Cronbach’s alpha, has a curvilinear relationship with scale length (Komorita & Graham, 1965), as expressed in the Spearman–Brown formula. Thus, scale length can moderate the relationship between the number of response categories and reliability. In this study, we hypothesize that a longer scale will be less affected by the number of response points because its reliability will be higher and more stable compared with that of a shorter scale (given that other scale conditions are constant).
Number of Response Categories and Item Discrimination Item discrimination, typically denoted as the slope parameter “a” in Item Response Theory (IRT), may also potentially moderate the effects of the number of response categories on psychometric properties of a scale. Scales with a greater number of response categories tend to show better item discrimination than those with fewer response categories do (Preston & Colman, 2000). It is easy to imagine that people’ s ability to discriminate the adjacent categories would be shaper between the categories of, let’s say, 1 and 7, as opposed to 1 and 2. Previous studies have not examined item discrimination in relation to the number of response categories. This study examines item discrimination as a potential moderator.
Purpose of This Study The overarching goal of this study is to identify the optimal scale point (or range) showing the best psychometric outcomes. Comparisons are also made on the independent effects of three scale conditions: number of response categories, scale length, and item discrimination. In addition, potential moderating effects of scale length and item discrimination are examined on the relationship between the number of response categories and psychometric properties of a scale.
Method Data Simulation A series of ordered categorical datasets were generated using Samejima’s IRT Graded-Response Model (GRM1; 1969, 1972). The IRT-GRM utilizes the item discrimination parameters and
Downloaded from jpa.sagepub.com at OAKLAND UNIV on May 28, 2015
666
Journal of Psychoeducational Assessment 32(7)
performs polytomous scoring (i.e., graded-item responses). Polytomous IRT scoring can also be obtained by the Rating Scale Model (RSM; Andrich, 1978) and Partial Credit Model (PCM; Masters, 1982), but they do not have item discrimination parameters as they belong to the Rasch IRT family. Thus, we chose the GRM to incorporate the item discrimination parameters in the data generation. The simulated item response data are categorical and unidimensional in nature.
Scale Conditions The data with 6 ordered response categories were the base model, from which the data containing 5, 4, 3, and 2 response points were also created. A response category of 6 was the maximum number in this study, mainly due to the limitations caused by the model complexity of a polytomous response GRM and also because our focus was on the categorical item generation rather than continuous or a proxy of continuous variables (such as those having more than several response categories). Thus, although this study capitalizes on the complex IRT model, we sacrificed the testing of response category greater than 6. Different levels of scale length (5, 10, and 20), item discrimination (low, medium, and high), and sample size (n = 500 and 1,000) were also incorporated into the data generation. A sample size of at least 500 is needed for reasonable parameter recovery of the GRM estimation with 5 categories (Reise & Yu, 1990). A total of 90 different scale conditions were generated (5 types of response categories × 3 types of scale length × 3 types of item discrimination × 2 types of sample size). Each of the 90 scale conditions was replicated 100 times; thus, 9,000 datasets (with 100 replications × 90 scale conditions) was evaluated on six measures (described below). The estimates reported in this article were the averages across 100 replications. The R programming language (Version 2.14.2) was used for the IRT data simulation procedure as well as for the other computations reported in this study except the IRT model parameter estimation for which the PARSCALE program (Muraki & Bock, 1999) was used. Findings based on simulated data are useful for various decision-making processes on the scale features, especially in the initial stage of scale development. Such situations include when there are no real subjects to test the instrument yet or when no theoretical model can guide person-by-condition/ construct relationships.
Evaluative Indices The present study, utilizing several estimates from the classical test theory and IRT frameworks, employs both reliability and validity estimates along with two measures of correlation, as the scale evaluative indices. They include the following: (a) Ability correlation between the true and estimated ability scores indicates whether the scales locate the estimated ability scores close to the true ability values. Higher correlation means closer relationships between the estimated and 2 2 2 true ability scores. (b) IRT person reliability is given by (1 − σ EAP ) σ , where σ EAP denotes the 2 average posterior variance and σ is the variance of the population ability θ (Mislevy, Beaton, Kaplan, & Sheehan, 1992). The higher the person reliability is, the more desirable the scale is. A “good” scale would have an IRT person reliability around .80 or higher. (c) Cronbach’s alpha was calculated for the observed scale scores. Higher values of the Cronbach’s alpha mean more consistent and desirable scale results. A Cronbach’s alpha around .80 or higher is expected in a “good” scale (Nunnally, 1978). (d) Average interitem correlations were calculated by averaging all possible pairs of item correlations. Although higher interitem correlations are desired in a unidimensional scale, there is no widely used rule of thumb as a cut-off value of a “high” interitem correlation (Fox & Jones, 1998). In addition, two types of validity evidence2 were operationalized. (e) We simulated a pair of scales to have a correlation of .70, meaning that the two scales are relatively highly correlated,
Downloaded from jpa.sagepub.com at OAKLAND UNIV on May 28, 2015
667
Lee and Paek Table 1. Evaluative Indices by the Number of Response Categories, Scale Length, and Item Discrimination (N = 1,000). Scale condition
Ability correlation
IRT reliability
.91 .91 .90 .87 .81 .10
.84 .83 .81 .78 .67 .17
.82 .81 .80 .78 .73 .09
0.64 0.64 0.63 0.61 0.57 0.07
0.27 0.26 0.26 0.26 0.24 0.03
.36 .35 .33 .30 .24 .12
.94 .89 .81 .13
.88 .80 .67 .21
.89 .80 .67 .23
0.65 0.63 0.57 0.08
0.31 0.24 0.22 0.09
.32 .32 .30 .02
.91 .89 .84 .07
.83 .79 .73 .11
.85 .80 .72 .13
0.64 0.62 0.59 0.05
0.28 0.23 0.25 0.03
.41 .31 .22 .19
Response category 6 5 4 3 2 Maximum − minimum Scale length 20 10 5 Maximum − minimum Item discrimination High Medium Low Maximum − minimum
Cronbach’s Convergent Divergent Interitem alpha validity validity correlation
Note. IRT = Item Response Theory.
mimicking convergent validity between the two scales (Validity 1). (f) The similar approach is used with a correlation of .30 (i.e., two scales are not highly correlated), mimicking discriminant validity (Validity 2). If a scale can regenerate an average correlation close to .70 (Validity 1) or .30 (Validity 2), it is considered to show “good” psychometric properties. How much of the differences in the validity coefficients defined as above should be considered as “substantial” change is not known in the literature (cf. Fox & Jones, 1998).
Results Independent Effects of Number of Response Categories, Scale Length, and Item Discrimination on Psychometric Properties Table 1 presents the estimates of six psychometric properties of the scales in each of the three scale conditions: response categories, scale length, and item discrimination (N = 1,0003). As can be seen, the estimates of all six psychometric properties seem to be better when the number of categories increases from 2 to 6. For instance, the ability correlation was .81 when using 2 points, which increased to .91 with 6 points. The Cronbach’s alpha also increased from .73 with 2 categories to .82 with 6 categories. The most notable changes in all indices were observed when the number of categories was reduced from 3 points to 2 points. Very small differences (i.e., differences of less than .03) were found among the scales with 6, 5, and 4 points, indicating a plateau effect from 4 points and beyond. Systematic patterns also emerged by differing levels of scale length and item discrimination (Table 1). Better psychometric results were obtained with longer scales and high-discriminating scales when the number of response categories was held constant. For instance, IRT reliability decreased from .88 to .67 when the scale length was reduced from 20 to 5 items. Similar estimates were shown in Cronbach’s alpha, which dropped from .89 in a 20-item scale to .67 in a
Downloaded from jpa.sagepub.com at OAKLAND UNIV on May 28, 2015
668
Journal of Psychoeducational Assessment 32(7)
5-item scale (Table 1). These two reliability estimates were more influenced by the scale length than the other estimates were. Higher item discrimination scales tend to show better psychometric outcomes as well. Two estimates that showed the largest changes were interitem correlation and Cronbach’s alpha, which decreased from .41 to .22 and .85 to .72, respectively, when the scale’s item discrimination changes from a high to low level (Table 1). When the estimates shown in Table 1 are compared across the three scale conditions, scale length seems to have the strongest impact on the indices with the exception of interitem correlations where item discrimination showed the strongest effect. Not surprisingly, scale length showed the greatest effect on Cronbach’s alpha among all the indices. The number of response categories showed stronger influences on the evaluative indices than the item discrimination did except on the estimates of interitem correlation and Cronbach’s alpha.
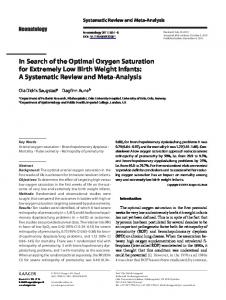
Moderating Effects of Scale Length Figure 1 presents graphical representations of the estimates of six psychometric indices for the scale conditions of the number of response categories (6 to 2) and scale length (5, 10, 20). These graphs show that higher estimates of psychometric properties are associated with a greater number of response categories in each of the scale length conditions, as can be expected from Table 1. For instance, by reducing the response categories from 6 points to 2 points, the IRT reliability decreased from .92 to .80 in the 20-item scale and from .73 to .54 in the 5-item scale. An alternative way to look at these graphs in Figure 1 is, for example, that to obtain .70 or higher Cronbach’s alpha, 5 or 6 response categories are needed in the 5-item scale, whereas only 2 points can be used in the longer (10- or 20-item) scales. The sharper drop in the psychometric properties seems to have occurred in general when the categories reduced from 3 to 2 points across all three conditions of scale length. The shorter scales seem to show slightly larger drops when the smaller number of response categories are used, which contribute to small moderating effects of scale length. This pattern appeared more strongly in ability correlation and two estimates of reliability. For instance, the correlations between the true and estimated ability scores (i.e., ability correlation) decreased from .85 to .72 (i.e., about a change of .13) in the 5-item scale when the number of response categories reduced from 6 points to 2 points, but the corresponding change was from .96 to .89 (i.e., about a change of .07) in the 20-item scale. The combined effects of scale length and number of response categories were larger than the effects of either one, suggesting a unique contribution from both scale conditions to the changes in the psychometric properties.
Moderating Effects of Item Discrimination Figure 2 presents the results of the six psychometric indices per scale condition varying in the number of response categories and item discrimination levels (N = 1,000). As can be seen, all indices show better estimates with an increased number of categories irrespective of the level of item discrimination. For instance, the IRT reliability was .89 with 6 response points, which dropped to .70 with 2 response points in the high-discriminating scale. To reach a Cronbach’s alpha of .75 or higher, as many as 6 points are needed in the low-discrimination scale, whereas only 2 points can be used in the high-discrimination scale. Although it is small, some moderating effects of item discrimination are noted in the estimates of ability correlation, IRT reliability, and interitem correlation. That is, slightly greater effects of response categories are noted in the high-discrimination scales than in the low or medium discrimination scales. For example, the IRT reliability decreased about .20 (from .89 to .70) in the high-discrimination scale, whereas it decreased about .13 (from .77 to .64) in the low-discrimination scale as the number of responses decreased from 6 points to 2 points. By contrast, virtually
Downloaded from jpa.sagepub.com at OAKLAND UNIV on May 28, 2015
669
Lee and Paek 1.00
0.95 Ability 0.90 Correlation 0.85
0.95 0.90
n=20
0.85
n=10
0.80
n=5
0.75 0.70 6
5
4
3
0.80 0.75 0.70 0.65 0.60 0.55 0.50
Cronbach's Alpha
0.90 0.85
n=20 n=10 n=5
6
2
0.95
IRT Reliability
5
4
3
2
0.40
Interitem
0.35 0.30
0.80
n=20
0.75 0.70
n=10 n=5
0.65 0.60 0.55
n=20
0.25
n=10
0.20
n=5
0.15 0.10
6
5
4
3
2
0.70
6
Validity 1
0.65 0.60
5
4
3
2
0.45
Validity 2
0.40 0.35
n=20
0.55
n=10
0.50
n=5
0.45
n=20
0.30
n=10
0.25
n=5
0.20
0.40
0.15 6
5
4
3
2
6
5
4
3
2
Figure 1. Number of response categories, scale length, and psychometric properties. Note. IRT = Item Response Theory.
no moderating effects by item discrimination are observed on the measures of the Cronbach’s alpha and Validity 2.
Discussion The present study investigates the optimal number of response categories in a scale when the data are strictly categorical. The analysis of this study based on the IRT-simulated data supports three perspectives outlined in the introduction in that (a) psychometric properties tend to be better with more response points but that (b) the benefits of having more response categories tend to be plateaued at 4 points. (c) Thus, there seems to be an optimal range (i.e., between 4 and 6 points) rather than an optimal scale point. Several previous studies showed only mixed results when investigating psychometric properties of the scales using 4 and 6 categories. Borgers, Hox, and Sikkel (2004) suggested that 6 points yielded better reliability than 4 points. However, Chang (1994) showed that the 4-point
Downloaded from jpa.sagepub.com at OAKLAND UNIV on May 28, 2015
670
Journal of Psychoeducational Assessment 32(7) 1.00
0.90
Ability Correlation 0.85
0.95 0.90
IRT Reliability
0.80 High
0.85
Medium
0.80
Low
0.75
High
0.75
Medium
0.70
Low
0.65
0.70
0.60 6
5
4
3
2
0.90
6
Cronbach's alpha
0.85 0.80 0.75 0.70
5
4
3
2
0.50
Interitem Correlation
0.45 0.40
High
0.35
High
Medium
0.30
Medium
Low
0.25
Low
0.65
0.20
0.60
0.15 6
5
4
3
2
0.80
6
Validity 1
0.75 0.70
5
4
3
2
0.35
Validity 2
0.30 0.25
High
0.65
Medium
0.60
Low
0.55
High
0.20
Medium
0.15
Low
0.10
0.50
0.05 6
5
4
3
2
6
5
4
3
2
Figure 2. Number of response categories, item discrimination, and psychometric properties. Note. IRT = Item Response Theory.
scale had higher reliability than the 6-point scale. Preston and Colman (2000) reported that a 6-point scale was better than a 4-point scale in test–retest reliability, but the criterion validity was equally good in the scales with 5 or more points. The present study demonstrates and makes a practical implication for survey developers that the scales between 4 and 6 points yielded similar results with differences of only about .02 averaging across different measures of reliability, validity, and correlations. The largest decrease in psychometric properties was observed when the number of response categories reduced from 3 to 2 points in all measures, which is in agreement with Cicchetti et al.’s (1985) study. This study also noted that the number of response categories had differential effects on psychometric properties depending on the types of indices examined. Overall, the reliability indices were more strongly affected than the validity measures were. The present study also report that psychometric properties are influenced by differing levels of scale length and item discrimination as well as number of response categories. This also means that scale developers can manipulate the three scale conditions (scale length, item discrimination,
Downloaded from jpa.sagepub.com at OAKLAND UNIV on May 28, 2015
671
Lee and Paek
and number of response categories) to optimize the scale’s psychometric properties. A scale with a smaller number of response points can be as effective as a scale with a greater number of response points as long as it uses more items or has more discriminating power. For example, a dichotomous response scale can have reasonably good Cronbach's alpha with 20 items (given its unidimensional structure). Alternatively, highly discriminating items with 3 response categories can show reliability as effective as medium-level discrimination items with 6 response categories do (see Figure 2). Among the three scale characteristics (number of response categories, scale length, and item discrimination), scale length seems to exert the largest impact, which was followed by the number of response categories, which in turn was followed by item discrimination. In fact, with the exception of Cronbach’s alpha, the effects of the number of response categories varying from 2 to 6 were quite comparable to the effects of scale length varying between 5 and 20 (see the rows of "Maximum - Minimum" in Table 1). Our findings are generally aligned with a meta-analytic finding by Churchill and Peter (1984), who reported based on more than 100 studies that “only two measure characteristics have a strong impact on reliability estimates—the number of items which accounts for 10% of the variance and the number of scale points which accounts for 5% of the variance” (p. 366).
Moderating Effects This study also shows that scale length and item discrimination may have a moderating effect. The initial hypothesis was that the longer scales would be less strongly affected by the number of response categories because they are more reliable and stable. This hypothesis was supported in five out of six indices (ability correlations, IRT reliability, Cronbach’s alpha, and two types of validity measures). The role of item discrimination as a moderator seems rather small and was shown mainly in three measures of ability correlations, IRT reliability, and interitem correlations. These moderating effects suggest that extra caution is needed when the scale length is short (about five items) and/or highly discriminating.
Limitation of This Study A few limitations of this study should be registered. First, specific domains or constructs may play a pivotal role on the effects of the response categories. Thus, this study results based on the simulated data will only be strengthened by replication using survey-based data supplied by real subjects. Second, our simulated data were categorical in nature, and scoring was strictly managed by thresholds. Although the present study capitalizes on advantages of complex IRT modeling, we abstained from testing of response categories greater than 6. We suppose, however, that psychometric gains achieved by more than 6 response categories would be negligible given the observed plateau effect at 4 points. Last, other key features of response categories, such as category labeling or inclusion of a neutral point, were not examined, which require qualitative information and were out of scope in the current study.
Conclusion Findings of the present study show that there was no substantial difference in the scales’ psychometric properties when the scale uses 4, 5, or 6 points of response categories. There were, however, nontrivial effects especially in reliability by changing the number of response categories from 6 to 2. All in all, there was about a .13 increase in the two reliability estimates and about a .10 increase in the ability correlation between the scales using 6 points and 2 points. We
Downloaded from jpa.sagepub.com at OAKLAND UNIV on May 28, 2015
672
Journal of Psychoeducational Assessment 32(7)
acknowledge that a scale format will be ultimately decided in a compromized form adjusted for particular testing situations and respondents. Declaration of Conflicting Interests The author(s) declared no potential conflicts of interest with respect to the research, authorship, and/or publication of this article.
Funding The author(s) received no financial support for the research, authorship, and/or publication of this article.
Notes 1. The logistic form of the Graded-Response Modeling (GRM) was used for both data simulation and parameter estimation. The GRM divides item P*ik(θ) responses into two categories: greater than or equal to a category k and less than a category k. The probability of obtaining a score of k or higher ( k = 0,1, 2, , m ), denoted as P*ik(θ), in the GRM (also called as “the boundary response function”) is given by Pik**ik((θ) ‚ ) = {1 + exp[− Dai (θ‚ − bik )]}−1 , where D = 1.7 is a scaling constant, ai is the ith item discrimination parameter, bik is the threshold parameter for a score k on an item i, and θ is a person ability parameter with the constraints of Pi0(θ) = 1, P*i,m+1(θ) = 0, and bi0 = 0. The item category probability function Pik(θ) in the GRM is defined as Pik(θ) = P*ik(θ) – P*i, k+1(θ) . The item discrimination parameter ai was drawn from the uniform distribution: ai ~ unif (0.44, 0.75) for low item discrimination, ai ~ unif (0.58, 0.98) for medium item discrimination, and ai ~ unif (0.75, 1.33) for high item discrimination. The threshold parameter bik was also randomly drawn from the uniform distributions ranging from −2 to 2. 2. The person ability parameters θ s were randomly drawn from the trivariate normal distribution with …= (0, 0, 0)′ , where θ s in the first dimension has a correlation of 0.70 with θ s in the second dimension and a correlation of 0.30 with θ s in the third dimension. The first dimension θ s were used for the item response generation. The θ s in the second and third dimensions were used to obtain validity evidence. The ability score used in this study is the expected a posteriori (EAP; Bock & Mislevy, 1982) estimates. 3. Estimates of the indices with sample sizes of 500 and 1,000 produced similar results. Thus, only the results based on N = 1,000 are presented in this article.
References Andrich, D. (1978). A rating formulation for ordered response categories. Psychometrika, 43, 561-573. Bendig, A. W. (1954). Reliability and the number of rating scale categories. Journal of Applied Psychology, 38, 38-40. Bock, R. D., & Mislevy, R. J. (1982). Adaptive EAP estimation of ability in a microcomputer environment. Applied Psychological Measurement, 6, 431-444. Borgers, N., Hox, J., & Sikkel, D. (2004). Response effects in surveys on children and adolescents: The effect of number of response options, negative wording, and neutral mid-point. Quality & Quantity, 38, 17-34. Chang, L. (1994). A psychometric evaluation of 4-point and 6-point Likert-type scales in relation to reliability and validity. Applied Psychological Measurement, 18, 205-215. Churchill, G. A., Jr., & Peter, J. P. (1984). Research design effects on the reliability of rating scales: A metaanalysis. Journal of Marketing Research, 21, 360-375. Cicchetti, D. V., Showalter, D., & Tyrer, P. J. (1985). The effect of number of rating scale categories on levels of interrater reliability: A Monte Carlo investigation. Applied Psychological Measurement, 9, 31-36. Cox, E. (1980). The optimal number of response alternatives for a scale: A review. Journal of Marketing Research, 17, 407-422.
Downloaded from jpa.sagepub.com at OAKLAND UNIV on May 28, 2015
673
Lee and Paek
Dawes, J. G. (2002). Five point vs. eleven point scales: Does it make a difference to data characteristics? Australasian Journal of Market Research, 10, 39-47. Dawes, J. G. (2008). Do data characteristics change according to the number of scale points used? An experiment using 5-point, 7-point, and 10-point scales. International Journal of Market Research, 50, 61-77. Fox, C. M., & Jones, J. A. (1998). Use of Rasch modeling in counseling psychology research. Journal of Counseling Psychology, 45, 30-45. Gilljam, M., & Granberg, D. (1993). Should we take the “don’t know” for an answer? Public Opinion Quarterly, 57, 348-357. Givon, M. M., & Shapira, Z. (1984). Response to rating scales: A theoretical model and its application to the number of categories problem. Journal of Marketing Research, 21, 410-419. Green, P. E., & Rao, V. R. (1970). Rating scales and information recovery: How many scales and response categories to use? The Journal of Marketing, 34, 33-39. Komorita, S. S., & Graham, W. K. (1965). Number of scale points and the reliability of scales. Educational and Psychological Measurement, 15, 987-995. Kroh, M. (2007). Measuring left-right political orientation: The choice of response format. Public Opinion Quarterly, 71, 204-220. Lee, J. (2012). Conducting cognitive interviews in cross-national settings. Assessment. Advance online publication. doi:10.1177/1073191112436671 Lozano, L. M., García-Cueto, E. M., & Muñiz, J. (2008). Effect of the number of response categories on the reliability and validity of rating scales. Methodology: European Journal of Research Methods for the Behavioral and Social Sciences, 4, 73-79. Masters, G. N. (1982). A Rasch model for partial credit scoring. Psychometrika, 47, 149-174. Matell, M. S., & Jacoby, J. (1971). Is there an optimal number of alternatives for Likert scale items? Educational and Psychological Measurement, 31, 657-674. Mislevy, R. J., Beaton, A. E., Kaplan, B., & Sheehan, K. M. (1992). Estimating population characteristics from sparse matrix samples of item responses. Journal of Educational Measurement, 29, 133-161. Muñiz, J., García-Cueto, E., & Lozano, L. M. (2005). Item format and the psychometric properties of the Eysenck Personality Questionnaire. Personality and Individual Differences, 38, 61-69. Muraki, E., & Bock, R. D. (1999). PARSCALE. Chicago, IL: Scientific Software. Neumann, L., & Neumann, Y. (1981). Comparison of six lengths of rating scales: Students’ attitudes toward instruction. Psychological Reports, 48, 399-404. Nunnally, J. C. (1978). Psychometric theory (2nd ed.). New York, NY: McGraw-Hill. Preston, C. C., & Colman, A. M. (2000). Optimal number of response categories in rating scales: Reliability, validity, discriminating power, and respondent preferences. Acta Psychologica, 104, 1-15. Reise, S. P., & Yu, J. (1990). Parameter recovery in the graded response model using MULTILOG. Journal of Educational Measurement, 27, 133-144. Samejima, F. (1969). Estimation of latent ability using a response pattern of graded scores. Psychometrika Monograph Supplement, 34(4, Pt. 2). Samejima, F. (1972).A general model for free response data. Psychometrika Monograph Supplement, 37(1, Pt. 2). Schutz, H. G., & Rucker, M. H. (1975). A comparison of variable configurations across scale lengths: An empirical study. Educational and Psychological Measurement, 35, 319-324. Si, S. X., & Cullen, J. B. (1998). Response categories and potential cultural bias: Effects of an explicit middle point in cross-cultural surveys. International Journal of Organizational Analysis, 6, 218-230. Symonds, P. M. (1924). On the loss of reliability in ratings due to coarseness of the scale. Journal of Experimental Psychology, 7, 456-461.
Downloaded from jpa.sagepub.com at OAKLAND UNIV on May 28, 2015