MANAGERIAL INCENTIVES AND THE EFFICIENCY OF CAPITAL STRUCTURE IN U. S. COMMERCIAL BANKING
Joseph P. Hughes Rutgers University
William W. Lang Federal Reserve Bank of Philadelphia
Choon-Geol Moon Hanyang University
Michael S. Pagano Villanova University
Revised, April 2003*
Abstract We extend the literature on the effects of managerial entrenchment to consider how safety-net subsidies and financial distress costs interact with managerial incentives to influence capital structure in U.S. commercial banking. Using cross-sectional data on publicly traded, highest-level U.S. bank holding companies, we find empirical evidence of Marcus’ proposition (1984) that there are dichotomous strategies for value maximization—one involving relatively higher financial leverage and the other, lower financial leverage. We find that a less levered capital structure is associated with higher charter value and vice versa. Moreover, differences in charter value result in dichotomous strategies for managerial entrenchment: under-performing, less levered firms hold too little capital while under-performing, more levered firms hold too much. Key Words: capital allocation, efficiency, agency problems, corporate control, charter value JEL Codes: G32, G21, D24, D21 *This paper supersedes an earlier version, “Measuring the Efficiency of Capital Allocation in Commercial Banking,” which did not examine the role of agency problems and corporate control in capital allocation. The authors thank Allen Berger, John Boyd, Ivan Brick, Ed Kane, David Smith, and members of the Rutgers Financial Intermediation Workshop and the New York Federal Reserve Bank, whose comments led to the current revision. Correspondence may be directed to Joseph P. Hughes,Associate Professor, Department of Economics, Rutgers University, New Brunswick, NJ 08901-1248,
[email protected], 732-932-7517; William W. Lang, Vice President, Supervision, Regulation, and Credit Department, Federal Reserve Bank of Philadelphia, Ten Independence Mall, Philadelphia, PA 19106-1574,
[email protected], 215-574-7225; Choon-Geol Moon, Professor, Department of Economics, College of Economics and Finance, Hanyang University, Seoul 133-791, KOREA,
[email protected], 82-2-2290-1035; and Michael S. Pagano,Assistant Professor, College of Commerce and Finance, Villanova University, 800 Lancaster Avenue, Villanova, PA 19085,
[email protected], 610-519-4389. The views expressed in this paper are those of the authors and do not necessarily represent those of the Federal Reserve Bank of Philadelphia or of the Federal Reserve System.
1. Introduction Commercial banks face unusual incentives for structuring equity capital that arise from the unique nature of their liabilities — demandable debt (deposits) that participates in the economy’s payments system.1 To protect the payments system, entry into commercial banking is restricted, and bank risk-taking is regulated. In addition to limits on entry, government safety net provisions of deposit insurance and access to liquidity at the Federal Reserve discount window reduce the potential for liquidity crises during periods of perceived or actual financial distress. Chartering and safety-net protections generate well-known, contrasting incentives for capital allocation: first, the incentive to increase financial leverage to exploit the cost-of-funds subsidy created by under-priced safety net subsidies (Merton, 1977) and, second, the incentive to reduce financial leverage to diminish the potential for costly financial distress that threatens a bank with the loss of its valuable charter. Marcus (1984) hypothesizes that these contrasting incentives for capital allocation result in dichotomous strategies for value maximization (p. 557): “. . . [W]hen a bank charter has value because of barriers to entry into the industry, a value-maximizing bank will choose either extreme highrisk or low-risk strategies. Midrange policies will be suboptimal.” Keeley (1990) uses Tobin’s q ratio to gauge banks’ charter value and finds that a higher charter value is associated with a higher ratio of capital to assets. If we define a bank’s charter value as the value of its assets in a competitive auction, then charter value captures the value of the bank’s investment opportunities — its market opportunities and advantages. Keeley’s evidence suggests that banks with more valuable investment opportunities protect this charter value by using a higher proportion of equity capital to finance their asset portfolio. While this empirical finding is broadly consistent with Marcus’ hypothesis, it does not consider the possibility that some banks might pursue capital strategies that sacrifice value. In the presence of incentive misalignments between managers and other stake-holders, banks may fail to achieve the highest potential value of their assets. In that case, Tobin’s q, the ratio of the achieved market value of assets to their replacement value, falls short as a gauge of banks’ charter value by the difference between the highest potential value of their assets and the value achieved by their managers.2 Thus, a bank’s lost market value reflects the severity of its agency problems. This study relaxes the assumption that managers maximize the value of bank assets. We examine how the relationship between a bank’s charter value and its capital strategy is influenced by incentive misalignments between insiders and outsiders. Allowing for agency problems, we look for evidence of Marcus’ hypothesis of dichotomous capital strategies for value maximization that differ according to banks’ charter value as well as evidence that some bank managers choose a “suboptimal” capital allocation. We then ask how charter value and ownership structure influence capital strategy and financial performance. In relaxing the assumption of value maximization, we propose an alternative to Tobin’s q for
1 2
Flannery (1994) analyzes the role of demandable debt in the optimal capital structure of banks.
Note that in some studies Tobin's q is used to measure managerial effectiveness in generating value rather than as a measure of the value of investment opportunities.
proxying charter value. Tobin’s q measures achieved market value, and this differs from potential market value if agency problems lead to managerial inefficiency. A plot of the achieved market value of banks’ assets against their investment (replacement) cost produces a “shotgun” scatter of points where some banks achieve a higher market value than others for the same investment in assets. An upper envelope fitted to these market values provides a measure of the highest potential value of any given investment in assets. To minimize the influence of luck on market value, the upper envelope can be fitted using stochastic frontier techniques. The upper envelope described above is a broadly defined measure of a bank’s potential value that asks, what is the highest potential value of a bank’s investment over all markets represented in the sample? The sole reference point for comparisons in this broad measure of potential value is the size of a bank’s investment in its assets and not the conditions of the local markets in which it operates. This implicitly includes the decision to invest in a particular market as a component of managerial effectiveness. The difference between this broadly defined measure of potential value and achieved market value — lost market value — is our preferred measure of financial performance for examining managerial efficiency. For robustness, our empirical analysis is also done using achieved market value as a measure of financial performance. To measure charter value, we obtain a more narrowly defined measure of the highest potential value of a bank’s assets in the markets in which it operates. While the decision to invest in any particular market is a component of managerial effectiveness, a narrowly defined measure of potential value that conditions on existing market location is a more appropriate measure of a bank’s value to potential acquirers (i.e., charter value). To obtain this narrower measure of potential value, we fitted the stochastic upper envelope over not just banks’ investment in assets but also over measures of their distinctive local market conditions, such as the Herfindahl index of market power and a macroeconomic growth rate. This approach provides a measure of the highest potential value of a bank’s investment in assets conditional on its location. In contrast to Tobin’s q ratio, the stochastic upper envelope minimizes the influence on value of both managerial inefficiency and luck.3
It provides a measure of charter value that is an exogenous component in the
investment decisions of individual banks. Using cross-sectional data on publicly traded, highest-level U.S. bank holding companies, we obtain empirical evidence for the following main points: C
We find strong support for Marcus' (1984) proposition of dichotomous strategies for value maximization — one involving relatively higher financial leverage and the other, lower financial leverage. Allowing for non-value-maximizing bank managers, we also find that some banks choose "suboptimal" capital strategies that sacrifice value. High-leverage banks that under-perform are relatively under-levered, while low-leverage banks that under-perform are relatively over-levered. 3
Since the frontier represents the “best observed practice,” we cannot say it eliminates any effects of inefficiency. Hence, we say it minimizes the effects of inefficiency. 2
These results are robust to size-related effects. C
The least levered banks in our sample appear to have fully exploited the gains from increasing equity capital. The most levered banks in the sample have unexploited gains where lowering equity would improve financial performance. This result suggests the possibility that regulatory restrictions on capital adequacy prevent high-leverage banks from fully exploiting the potentially mispriced federal safety net.4
C
We find that higher charter value (i.e., a better investment opportunity set) is more likely to be associated with choosing a less levered capital strategy.5 While other studies have also found this association, our results add to this finding by indicating that higher charter value is more likely to be associated with a poorer performing, less levered capital strategy than with a better performing, less levered strategy.
C
We propose a two-part corollary to the Marcus hypothesis to help explain the stronger association between higher charter value and poorer financial performance. First, higher charter value — more valuable investment opportunities — improves managers’ tradeoff (see Jensen-Meckling (1976)) between producing value and consuming agency goods (e.g., perquisites, shirking, building empires, etc.). Our evidence suggests that managers respond to a higher potential value of their bank with an elastic consumption of agency goods. Second, higher charter value and its associated low-leverage strategy reduce the opportunity cost of increasing debt to improve managerial control. Adding debt can reduce the probability of losing control through a take-over while decreasing debt can reduce the probability of losing control through financial distress.6 Since banks with higher charter value use a less levered capital strategy to
4
While capital regulations might prevent some banks from achieving their highest potential value through increased leverage, this result might reflect an appropriate regulatory policy if the public benefit of bank safety (protection of the payment system) exceeds the private benefits from higher leverage. 5
These results are consistent with the findings in Keeley (1990), Demsetz, Saidenberg, and Strahan (1996), and Galloway, Lee, and Roden (1997), who study the capital structure of commercial banks . However, these studies do not consider the role of agency problems. Other studies have considered agency problems in the association between capital structure and the value of investment opportunities. Smith and Watts (1992) investigate non-financial firms and find evidence that lower financial leverage ratios are associated with better investment opportunities and hypothesize that the difference in leverage between firms with better and poorer investment opportunities ameliorates agency problems—under-investment in the case of firms with better investment opportunities and over-investment in the case of firms with poorer opportunities. McConnell and Servaes (1995) find similar results and, following Smith and Watts (1992), hypothesize that low leverage at high-growth firms is a response to the under-investment problem of debt while high leverage at low-growth firms addresses the potential for over-investment (or empire-building without good prospects). They define investment opportunities by the price-earnings ratio. 6 The value-maximizing level of debt is usually thought to exceed the level preferred by managers, who would rather avoid debt’s performance pressures that limit their ability to consume agency goods (Grossman and Hart (1982), Jensen (1986), Stulz (1990), and Hart and Moore (1995)). However, recent literature suggests a more complex set of potential outcomes. In particular, under some circumstances incentive-conflicted managers may prefer increasing leverage as a defensive capital strategy.
3
produce value, it follows that the degree of performance pressure due to financial leverage is inherently less for managers of banks with higher charter value than for those with lower charter value. Thus, the defensive value of over-levering is greater for managers of banks with higher charter value. In contrast, the defensive value of over-levering for managers of banks with lower charter value is likely to be smaller than the value of the lessened performance pressure and the lessened probability of bankruptcy that follows from under-levering. Our empirical evidence suggests that differences in charter value can lead not only to dichotomous strategies to maximize value but also to dichotomous strategies to enhance managerial control.7 C
We find further evidence of agency problems in the association between financial performance and differences in the structure of managerial ownership, compensation, and outside monitoring. Controlling for asset size, we find that a higher level of insider ownership is related to poorer financial performance. On the other hand, higher levels of outside block-holder ownership and stock options granted to insiders are associated with better financial performance. We divide our empirical investigation into two parts. In the first part, Section 2, we consider the
Studies, such as Israel (1991), Novaes and Zingales (1995), and Billet (1996), show that increased debt as a proportion of assets transfers a larger portion of the take-over gains from acquiring and target shareholders to target debtholders and, thus, reduces the bidder’s gain from a take-over. Novaes and Zingales (1995), Zwiebel (1996), and Garvey and Hanka (1999) construct models in which managers balance the effect of higher leverage on decreasing the probability of a take-over against the increased probability of financial distress. Depending on the balance of these opposing effects, managers may over- or under-lever relative to the value-maximizing level of leverage. Novaes and Zingales (1995) show that managers over-lever relative to the value-maximizing level when take-over pressure is strong. Take-over pressure is likely to be stronger when managers’ extraction of private benefits produces a significant difference between a firm’s potential value and its achieved value. A number of studies, such as Garvey and Hanka (1999), Safieddine and Titman (1999), and Berger, Ofek, and Yermack (1997), document how the threat of capital-market discipline influences managers’ choice of capital structure. In particular, lower leverage is associated with managers who do not face strong monitoring and whose compensation and job tenure is less sensitive to performance. When these managers experience threats to their security, such as a takeover attempt or the arrival of a large outside blockholder, they increase their firms’ leverage ratio. Stulz (1988) notes that an increased leverage ratio concentrates managers’ ownership and increases their ability to resist take-over and that, under some circumstances, managers will choose such a strategy even though it lowers market value. Alternatively, increased debt can reduce the probability of a take-over by committing managers to a more efficient business strategy (Jensen (1986) and Zwiebel (1996)). 7
The possibility that entrenched managers of high-charter-value banks over-lever their banks to protect their control and consumption of agency goods is highlighted by the large number of banks that have been acquired in the last two decades. This wave of bank acquisitions suggests that bank managers whose consumption of agency goods has resulted in relatively large market-value shortfalls are likely to attract the attention of potential acquirers. Brook, Hendershott, and Lee (1998) provide evidence that the market identifies inefficient banks and targets them for discipline. They examine the abnormal returns of banks during the passage of the Interstate Banking and Branching Efficiency Act of 1994, which liberalized the rules on bank acquisitions across state lines. By increasing the number of potential acquirers of a bank and by reducing the transactions costs of an acquisition, this act increased the probability a bank will become the target of an acquisition and thereby raises the bank’s ex ante value. As expected, they find that the abnormal return of poorly performing banks reacts more positively and that this reaction is limited by factors correlated with managerial entrenchment. Thus, banks with higher levels of market-value inefficiency face a greater threat of acquisition and can restrict this threat by taking defensive actions. Hadlock, Houston, and Ryngaert (1999) document managers’ incentive to take defensive actions. Although overtly hostile mergers are rare in banking, they find high levels of managerial turnover following bank acquisitions and note that even apparently non-hostile bank acquisitions pose a considerable threat to the managers of target banks. Hence, inefficient bank managers can be expected to take defensive steps. 4
association between a bank’s capital structure and its financial performance; and, in the second part, Section 3, we investigate how managerial incentives influence capital structure and its performance.
2. The Influence of Capital Structure on the Financial Performance of Banks In this section, we detail the variables used to characterize a bank’s production plan and capital structure. In addition, we outline our measure of lost market value (inefficiency), and we discuss the evidence of dichotomous capital strategies obtained from regressing our two performance measures on the production plan and capital structure. We use data on 190 highest-level bank holding companies in the United States in 1994. The balancesheet items were obtained primarily from the Federal Reserve Y-9C Consolidated Financial Statements for Bank Holding Companies. The end-of-year number of shares outstanding were obtained from the Standard & Poor’s Compustat database while end-of-year stock prices were retrieved from the data banks of the Center for Research in Securities Prices (CRSP).
2.A. The Production Plan and Capital Structure Unlike individual investors who buy market-produced assets, commercial banks produce informationintensive assets and financial services using labor and physical capital, and they lever these assets using demandable debt (deposits) and other borrowed funds.8 Thus, a bank’s production plan consists of onbalance-sheet assets, off-balance-sheet financial services, the level of equity capital, and the amounts of other financial and nonfinancial inputs. We control for the credit quality of the bank’s loans and for its growth opportunities and market power. The production plan is specified as follows. The outputs include on- and off-balance-sheet products. The former consist of liquid assets (the sum of cash, balances due, federal funds sold, reverse repurchase agreements, and securities), commercial and industrial loans, agricultural loans, loans to individuals, real estate loans, other loans, leases, assets held in trading accounts, investments in unconsolidated subsidiaries, intangible assets, customers’ liabilities related to bank acceptances, and other assets. The off-balance-sheet products are credit guarantees (unused portions of lines of credit, standby letters of credit, and so on), the notional amount of swaps, and the notional amount of all futures and options activity. The inputs consist of labor (measured by the number of full-time equivalent employees), physical capital (measured by the amount of premises and fixed assets), uninsured domestic deposits, all other domestic deposits, and other borrowing (foreign deposits, federal funds purchased, repurchase agreements, commercial paper, subordinated notes and debentures, mandatory convertible securities, and trading account liabilities). Equity capital is measured by the book-value of shareholders’ equity. Because of the accounting identity relating equity capital to assets and liabilities, we must either impose parameter constraints or omit some components of the balance sheet. We chose to omit some liability 8
Bhattacharya and Thakor (1993) review the literature that constitutes the modern theory of financial intermediation. This theory defines commercial banks’ comparative advantages in producing information-intensive assets and financial services that follow from their principal liability, demand deposits. 5
items from our list of regressors. The omitted liabilities are the bank's liabilities on acceptances outstanding, mortgage indebtedness, minority interest in consolidated subsidiaries, and other liabilities. We have also omitted preferred stock.9 To control for the credit quality of loans, we use the amount of nonperforming loans (the sum of accruing and nonaccruing loans, leases, and other assets past due 90 days or more) plus gross charge-offs. We add charge-offs to past-due loans to account for differences among banks in their aggressiveness toward charging off past-due loans. To control for the economic environment, we include a measure of market power and a measure of growth opportunities or potential. Market power is proxied by a Herfindahl index of the bank’s share of deposits in the markets in which the bank operates. A bank’s growth opportunities are proxied by a 10-year weighted average growth rate of personal income: for each state in which the bank operates, the state’s 10year average growth rate in personal income is weighted by the bank’s proportion of deposits located in that state. The data for the full sample are summarized in Table 1. We estimate the following relationship with ordinary least squares: level of financial performance = f(amounts of various types of on-balance-sheet assets, amounts of various types of off-balance-sheet financial services, amount of equity capital, amounts of various types of deposits, other debt, labor, physical capital, loan credit quality, growth opportunities, market power).
(1)
As noted above, we use two measures of the level of financial performance, both based on the market value of assets, which is proxied by the sum of the market value of equity and the book value of liabilities.10 The first measures a bank’s financial performance by achieved market value—the difference between the market value of its assets and a proxy for their replacement cost, their book value net of goodwill. The book value of bank assets net of goodwill is often used as a proxy for the assets’ replacement cost, since actual replacement costs are usually difficult to obtain.11 The second measures a bank’s level of financial performance by lost market value—the difference between the highest potential value of its assets and their achieved market value. This difference is the bank’s market-value inefficiency.12 In the next section we
9
Preferred stock is a hybrid security that some would consider a component of debt and others, a component of equity. In any case, preferred stock is a small item on the balance sheet of the few institutions in our sample that have it. 10
See, for example, Keeley (1990).
11
Since goodwill is a component of market value, it should be subtracted from book value to obtain a proxy for replacement cost. See Demsetz, Saidenberg, and Strahan (1996) for a discussion of using this adjusted book value as a proxy for replacement costs. 12
Our regression equation is subject to heteroskedasticity for two reasons: first, because a size effect is likely to be present and, second, in the case of the market-value inefficiency measure, because the dependent variable is estimated. (As Saxonhouse (1976) shows, an estimated dependent variable can introduce heteroskedasticity into the regression.) Since a rigid functional form for heteroskedasticity is subject to misspecification, we reject this approach and, instead, accept heteroskedasticity of unknown form and use typical OLS estimates and their robust (to heteroskedasticity of unknown form) standard errors, called White's heteroskedasticity robust standard errors. However 6
describe how we estimate the highest potential value of a bank’s investment in its assets and its market-value shortfall.
2.B. Fitting a Stochastic Upper Envelope to Gauge Firms’ Market-Value Inefficiency We define the market-value inefficiency of a bank's investment in its assets by the difference between the assets’ broadly defined, potential (or frontier) market value and their observed market value. The frontier market value can be interpreted as the market value of the most valuable bank of comparable size. To obtain this upper envelope of observed market values defined over adjusted book values, we employ stochastic frontier analysis. This upper envelope of market values is fitted by appending a composite error term to a regression of observed market values, MVAi , on adjusted book values, BVAi. The composite error term, ,i , consists of a two-sided term, < i , that captures statistical noise and a one-sided term, :i , that gauges inefficiency. This composite term fits an upper boundary to the data rather than an average relationship. We employ a quadratic specification of the regression equation to allow for the possibility that the relationship between market and book value is nonlinear. The resulting equation is MVAi = " + $ (BVAi ) + ( (BVAi )2 + ,i
(2)
where ,i = 7.73% and 0 otherwise Inef = 1 when market-value inefficiency to adjusted book value of assets > median value and 0 otherwise. The values in the table are the derivatives, Mp(CapRatio = 1 or 0, Inef = 1 or 0) / Mz1 where z1 /(narrow charter value, % insider ownership, % insider options granted, % outside block-holder ownership, number of analysts following the bank, asset size, diversification index). The first value in each cell represents the mean derivative for the full sample. White's Heteroskedasticity Robust Standard Error and is reported in brackets for the full-sample value. The mean derivative for three levels of insider ownership are also reported in the cells. To economize on space, their standard errors are omitted, but their significance is indicated by asterisks. *Significant at the 10% level, **at the 5% level, ***at the 1% level. Variable Name
More Capitalized/ Efficient
More Capitalized/ Inefficient
Less Capitalized/ Efficient
Less Capitalized/ Inefficient
Charter Value–full sample; and where insiders own 0 - 5% insiders own 5 - 25% insiders own > 25%
66.63417023*** [23.87720] -13.04827590 121.78316038*** 46.47946788
282.85206644*** [91.40287] 5.55464349 157.81237406*** 1210.54983857***
% Insider Ownership full sample; and where insiders own 0 - 5% insiders own 5 - 25% insiders own > 25%
-0.00419434 [0.00705] -0.00745522 -0.00363337 0.00031988
-0.00307554* [0.00158] -0.00057658 -0.00427010 -0.00412769
0.00419434 [0.00705] 0.00745522 0.00363337 -0.00031988
0.00307554* [0.00158] 0.00057658 0.00427010 0.00412769
% Block-holder Ownership–full sample; where insiders own 0 - 5% insiders own 5 - 25% insiders own > 25%
-0.02037430** [0.00876] -0.00531725 -0.03423082*** -0.00575071
-0.18037886 [1.94154] -0.01905799 -0.36087738 0.07716514
0.02037431** [0.00876] 0.00531722 0.03423084*** 0.00575071
0.18037886 [1.94155] 0.01905802 0.36087735 -0.07716514
% Stock Options Granted to Insiders; insiders own 0 - 5% insiders own 5 - 25% insiders own > 25%
0.39704288** [0.17972] 0.39765132 0.52739381*** -0.01449298
-0.07858911 [0.06123] -0.01358804 -0.08650441 -0.17885782
-0.39704279** [0.17973] -0.39765111 -0.52739376*** 0.01449298
0.07858902 [0.06123] 0.01358783 0.08650436 0.17885782
Number of Security Analysts; and where insiders own 0 - 5% insiders own 5 - 25% insiders own > 25%
0.01171379 [0.00962] 0.05160159** -0.00882717 -0.00044115
0.00480593 [0.02679] 0.00132917 0.01150649 -0.00959242
-0.01171381 [0.00962] -0.05160162*** 0.00882716 0.00044115
-0.00480592 [0.02679] -0.00132915 -0.01150647 0.00959242
Total Assets--full sample; and where insiders own 0 - 5% insiders own 5 - 25% insiders own > 25%
-69.68505766*** [24.67880] 10.40040394 -125.65659086*** -47.71704584
-291.06695892*** [95.93329] -7.57812701 -173.12307372*** -1208.35027379***
69.68511598*** [24.67940] -10.40030029 125.65663998*** 47.71704584
291.06690060*** [95.93298] 7.57802336 173.12302461*** 1208.35027379***
Index of Macro Diversification – full sample (no significant sub-sample values)
-0.05908506 [0.09247]
0.01509300 [0.08175]
0.05908486 [0.09248]
-0.01509280 [0.08175]
33
-66.63410015*** -282.85213652*** [23.87734] [91.40394] 13.04839090 -5.55475849 -121.78309552*** -157.81243893*** -46.47946788 -1210.54983847***
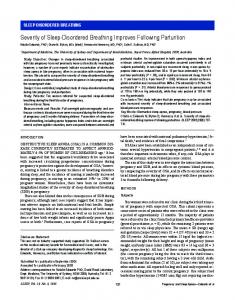
Figure 1A Inefficiency Ratio Bank A
K
K
A
* A
K
' A
Equity Capital
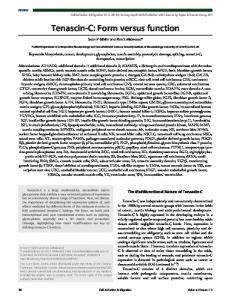
Figure 1B Inefficiency Ratio
Bank L
* K L
' K L
Bank H
K
34
H
* K H
Equity Capital