Income Disparity and Convergence in China’s Regional Economies
Yanrui Wu
Department of Economics University of Western Australia Nedlands, WA 6907 Australia Tel: 618 9380 3964 Fax: 618 9380 1016 Email:
[email protected] http://www.econs.ecel.uwa.edu.au/econs/staff/wu.htm
1
Abstract: Regional disparities in China have recently attracted the attention of economists both inside and outside China. In particular, researchers and policy makers are concerned with how economic reforms have affected regional disparities in China. As a result, there has been a boom in the literature. However, the exploding literature has so far presented conflicting results. The aim of this paper is to review the literature in this field and to present new evidence on income disparity and convergence in China’s regional economies. This study is based on the application of regional GDP figures covering the period of 1953-97. It attempts to assess and consolidate the findings from previous studies and hence contributes to the current debate.
Key Words: regional disparity, Chinese economy and convergence
JEL Codes: O53, C81, D30
2
Income Disparity and Convergence in China’s Regional Economies
It is common knowledge that, with two-decades’ reforms and the subsequent economic growth, the Chinese economy in general and the well-being of the world’s largest populace in particular have improved significantly. However, has the improvement been equal across the regions? More importantly, has rapid economic growth led to regional convergence as argued in the so-called endogenous growth theory? These issues have become the focus of the recent debate on regional disparities in China. Understanding these issues has important implications not only for regional development policy but also for the continuation of the reforms in China. This paper attempts to review the existing literature and to present new evidence of income disparity and convergence in China. It thus contributes to the current debate and adds to the literature.
The rest of the paper begins with a critical review of the existing literature. Then new evidence on regional disparities is presented. This is followed by analyses of regional convergence. The final session summarises the main findings and indicates the direction of further research.
Previous Studies: A Review Economists’ views on the impact of disparity on growth are inconclusive. 1 Some argued that greater equality implies higher human capital accumulation and hence better economic performance (see Chiu 1998, Clarke1995, Alesina and Rodrik 1994, Persson and Tabellin 1994). Galor and Zeira (1993) however presented empirical evidence to show that more equal income distribution does not always imply better economic performance. Perotti (1996) also provided evidence that inequality through its negative impact on fertility affects growth positively. In addition, empirical evidence has also shown that inequality exacerbates social-political conflicts which in turn reduce growth (Benabou 1996). This finding is particularly of relevance to large 1
See Benabou (1996) for a comprehensive review.
3
countries like China. It is due to the concern of instability and social unrest that regional disparity in China has for a long time attracted the attention of both scholars and policy-makers. Reports on this topic have hence appeared continuously in the literature.
The existing studies have focused on assessing inequalities among the regions (coastal, central and western regions), between rural and urban areas, and within the rural and urban households in China. These studies can be broadly divided into two groups. Group one mainly covering the pre-reform period consists of research work published in the 1970s and 1980s. 2 Group two with an emphasis on the post-reform period includes the literature appeared in the 1990s. Due to the limitation of Chinese statistics, literature in group one presented mainly descriptive analyses often from the perspective of political economy. The findings from this literature are conflicting. For example, while Riskin (1987) and Lippit (1987) showed evidence of reducing disparities, Selden (1988) and Friedman (1987) argued on the contrary. Since earlier studies have been intensively surveyed in various sources, this paper focuses on the literature appeared in the 1990s only. 3
The author has collected about twenty-nine or so published studies focusing on postreform China. Table 1 presents a brief summary of these studies. Not surprisingly, the findings from these studies are not consistent at all. The dominant view in the literature is that inequality in rural China has worsened during the past decades (eg. Knight and Song 1993, Hussain et al. 1994, Wan 1998, Li and Zhao 1999). Tsui (1996) has however shown that regional disparity was reduced in the early 1980s but deteriorated in the late 1980s. In addition, Jian et al. (1996), Gundlach (1997) and Raiser (1998) have also provided evidence of regional convergence during the reform period.
2
Such as Lardy (1978, 1980), Selden (1988), Riskin (1987) and Lippit (1987). For discussions about earlier studies, see Lyons (1991), Rozelle (1996) and Gustafsson and Li (1998). There are also studies on China’s regional development broadly, eg. Yang (1990), Denny (1991), and Zhao (1996), which are beyond the scope of this study. 3
4
Table 1 Summary of Selected Studies on regional disparities in China ____________________________________________________________________________________________________________ Authors Sample Methods Main findings ____________________________________________________________________________________________________________ CV disparity ↓(consumption) ↑ (output) income functions rural inequality ↑ among counties Gini ratio low inequality / sources: urban decomposition non-wage & rural non-farming Lee 1994 growth equation disparity in export contribution Chen 1995 Gini ratios disparity ↑ Hu, Wang and Kang 1995 CV disparity ↓ but large regional descriptive analysis disparity in international standard Wei, Wei 1995 1952-91/NI Gini ratios/CV disparity ↓ (1978-91) but↑ (1952-78) Chen and Fleisher 1996 1978-93 growth equation regional convergence Jian, Sachs and Warner 1996 1952-93 / GDP income dispersion disparity ↓ & convergence Chen and Ravallion 1996 1985-90/household data rural poverty less increase in poverty Rozelle 1996 1983-92/household data Gini ratio and disparity ↑ late 1980s Sources source: rural industrialisation Tsui 1996 post-reform Gini/CV/GE disparity ↓ early 1980s sources disparity ↑ late 1980s Lyons 1997 1990/Fujian cross-tabulation large disparity among countries Zhao and Li 1997 1988 & 1995 household data Gini ratio disparity ↑ / sources Gundlach 1997 1979-89/output per worker convergence rate of convergence: 2.2% Research Team 1997 1978-96 Gini ratio/descriptive disparity ↑ analysis but still low in international standard ____________________________________________________________________________________________________________ Lyons 1991 Knight and Song 1993 Hussain et al. 1994
1952-87/GVO/consumption 1987/counties 1986/households 5000 (urban/rural each) 1984-90/NI 1978-88/household data 1978-94/GDP
5
Table 1 Summary of selected studies on regional disparities in China (continued) ____________________________________________________________________________________________________________ Authors Sample Methods Main findings ____________________________________________________________________________________________________________ Meng and Wu 1998 1000 rural households income equation sources of income differential Hu 1997 1980-95/GDP regional shares less increase in disparity Li, Zhao and Zhang 1998 1988 & 1995 household data Gini ratio, CV disparity ↑ / sources Lin, Cai and Li 1998 1978-95 GDP and Gini and Theil ratios disparity ↑ between regions household income decomposition disparity ↓ within regions Raiser 1998 1978-92 α/β convergence disparity ↓ / convergence after 1985 Tian 1998 post-1978 / GDP CV interprovincial disparity ↓ coastal-interior disparity ↑ Duncan and Tian 1998 1952-95/NI CV disparity ↓(output) ↑ (livelihood) Wan 1998 1984-96/aggreagte Gini ratio rural inequality ↑ household income decomposition sources: wage/non-wage incomes Gustafsson and Li 1998 1988 household survey income equation rural-urban gap accounts for locational aspects 30% of total disparity Zhang 1998 1988 & 1995 household data Gini ratios / rural inequality ↑ 1980-95 aggregate decomposition source: non-farming income Khan and Riskin 1998 1988 & 1995 household data Gini ratios inequality ↑& more in urban China decomposition source: non-farming& rental income Tsui 1998 rural household data/late 80s Theil indexes/decomposition sources of regional disparities Wu 1999 1981-95/GDP productivity/efficiency convergence ____________________________________________________________________________________________________________ Notes
CV, Gini ratio and GE stand for coefficient of variation, Gini coefficient and methods, respectively. “disparity ↓” and “disparity ↑” indicate disparityreducing and disparity-enhancing. GVO, GDP and NI represent gross value of output, gross domestic product and national income.
6
Researchers have used either per capita income or household survey data to address two main issues, i.e. regional disparity or inequality and its sources. Gini coefficient has been the major indicator used. Other less popular indicators of inequality include the Theil index and the coefficient of variation. 4 However, few researchers have explained how they calculated their Gini coefficients. This makes it difficult to compare the findings from various sources as there are different methods available for the computation of Gini coefficients. 5 This problem is evident in Table 2 which shows that the magnitude of Gini coefficients estimated by different authors varies considerably. There are also variations in the trend of movement of these indexes. These differences are due to the fact that the existing literature suffers from several main drawbacks:
Income data Both per capita income and household survey data are used in the studies surveyed. Data on per capita income, mainly per capita GDP or GNP, are only available for the reform period starting in 1978. 6 Earlier studies were based on either national income figures or GDP data estimated by scholars outside China. These data sets themselves are not consistent and often subjected to biases. For household data, the selection of samples is problematic and the size of samples is often too small to represent all regions of China.
4
Hu et al. (1995), and Rozelle (1996) also analysed regional shares over national totals of various economic indicators. 5 Fei, Ranis and Kuo (1979, p.328), for example, have shown several different methods in calculating Gini coefficients. 6 In 1997, for the first time, the State Statistical Bureau of China released regional GDP figures for the pre-reform period 1952-77 (Xu and Tian 1997).
7
Table 2 Estimates of Gini coefficient by selected authors ____________________________________________________________________________________________________________ GDP per capita Household survey data National income World Year Tsui Lin et al. Zhao and Li 1997 Wan 1998 Chen 1995 Wei 1995 Zhang Bank* 1996 1998 Rural Urban Rural Rural Urban Rural 1998 Rural ____________________________________________________________________________________________________________ 1978 .226 .350 .212 .16 .353 .32 1979 .222 .346 .237 .349 .24 .28 1980 .222 .351 .16 .348 .24 .26 1981 .220 .346 .239 .15 .226 .159 .329 .23 .23 1982 .215 .334 .232 .15 .233 .158 .313 .25 .22 1983 .215 .377 .246 .15 .255 .151 .309 .26 .25 1984 .216 .337 .258 .16 .106 .270 .160 .299 .26 .27 1985 .216 .329 .264 .19 .091 .279 .167 .300 .29 .30 1986 .219 .328 .288 .19 .107 .288 .160 .285 .29 .31 1987 .221 .336 .232 .20 .109 .280 .163 .293 .30 1988 .221 .331 .301 .23 .113 .290 .165 .287 .30 1989 .218 .326 .300 .23 .118 .275 .31 1990 .327 .310 .23 .108 .268 .31 1991 .326 .307 .24 .122 .276 .31 1992 .335 .314 .25 .125 .32 1993 .337 .320 .27 .139 .33 1994 .344 .330 .30 .148 .34 1995 .349 .340 .28 .162 .42 1996 .160 ____________________________________________________________________________________________________________ * As cited by Khan et al. (1993).
8
Methodological issues The empirical findings are based on the application of various methods. In the case of Gini coefficients, without more detailed information about computations, a comparison of the final figures is very difficult. For the coefficient of variation, both weighted and unweighted indexes are reported without explanations in the literature.
Price deflators
Few researchers stated clearly they used income in constant
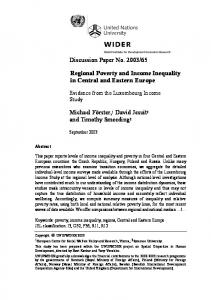
prices, not to mention the price deflators used. There are two problems with price deflators. One is that regional variations are rarely taken into consideration. Another is that official deflators are obscure. Figure 1 presents three versions of official deflators, ie. Index I derived by using nominal GDP values and real GDP growth rates, Index II computed from nominal and real GDP figures and Index III the retail price index. All statistical series involved are publicly available in China. The problem is very evident in the chart. While the three sets of deflators show a similar trend of movement overtime, their magnitudes vary considerably. Empirical analyses applying these deflators can be distorted. For example, applications of Indexes II and III could lead to biases upwards and downwards, respectively.
New Evidence on Regional Disparities
This section attempts to improve over previous studies by applying the recently released GDP data to derive new estimates of disparities among China’s thirty regions. 7 It extends the existing literature in several directions. First, regional GDP data for the period 1953-77 are employed here for the first time according to the author’s knowledge. 8 Second, region-specific price indexes are used to deflate income
7
In 1997, Chongqin gained the same status as other three large cities, ie. Beijing, Tianjin and Shanghai. Therefore, China has actually thirty-one regions now. 8 The author notices that Jian, Sachs and Warner (1996) used 1952-77 GDP figures for fifteen provinces and applied regional price indexes but, as pointed out, part of their data set was generated by the authors.
9
500 Indexes (in 1953 constant prices)
450 400 350
Index I Index II
300
Index III
250 200 150 100 50
195 3 19 55 19 57 19 59 19 61 19 63 196 5 196 7 196 9 197 1 19 73 19 75 19 77 197 9 198 1 198 3 19 85 19 87 19 89 19 91 19 93 199 5 199 7
0
Figure 1 China’s official price indexes 1953-97
figures. Third, this section also aims to compare the findings from different methods, eg. the Gini ratio, coefficient of variation and Theil index. Finally, for the purpose of comparisons, following the official line, China’s thirty regional economies are geographically divided into three groups, ie. the coastal, central and western regions. 9 According to this classification, the three largest cities, Beijing, Tianjin and Shanghai, are included in the coastal category. Thus, these cities together with the provinces in the coastal group are often compared to other regions which consist of provincial economies only. This is problematic as these three cities are mainly urban economies. Their comparators should be other cities rather than the provinces. The similar argument has also been raised against comparing Singapore and Hong Kong to other continental economies (Easterly 1995). 10 For this reason, these three cities are separated from the provincial economies in this study. In what follows, a description of the data used is presented first. Then a League Table of Chinese regional
9
The coastal region constitutes eight provinces situated along the coast of China, i.e. Hebei, Liaoning, Shandong, Zhejiang, Jiangsu, Fujian, Guangdong and Guangxi. The central region contains nine inland provinces, that is, Shanxi, Inner Mongolia, Jilin, Heilongjiang, Anhui, Jiangxi, Henan, Hunan and Hubei. Finally, the western region is composed of seven border areas, namely, Sichuan, Yunnan, Guizhou, Shaanxi, Gansu, Ningxia and Xinjiang. 10 A discussant on a paper by Dowrick (1995) also raised the similar point.
10
economies is illustrated and analysed. Finally, various estimates of regional disparities are reported and investigated.
Data Issues
Income used in this study takes the value of GDP, released by the State Statistical Bureau (1997, 1998), which is available for the period 1952-1997.11 All GDP figures are expressed in 1953 constant prices. The deflators are derived by using nominal GDP values and real GDP growth rates, both series available for all regions during the entire period of 1952-97 (see Index I in Figure 1). The use of this price series implies that the official GDP growth rates, questioned by some researchers, are accepted in this study. 12
A League Table of Chinese Regional Economies
In order to show how the regions score in terms of GDP per capita, mainland China’s thirty administrative regions are ranked and the rankings in selected years are presented in Table 3, which may be called the League Table of Chinese regions. In this table, the top four, hereafter called the rich, have in turn been Shanghai, Beijing, Tianjin and Liaoning in the past decades. The bottom five, hereafter called the poor, have been Anhui, Guangxi, Sichuan, Guizhou and Yunnan for almost half a century. Thus, the rich and poor have not changed their positions. However, some provinces have moved up the ladder to become China’s new riches in the past five decades. These include Shandong, Zhejiang, Fujiang, Jiangsu and Gunagdong. They are truly the winners of China’s reforms in the past two decades. Guangdong, Zhejiang and Jiangsu took off immediately after the initiative of the reform in 1978. Shandong and Fujiang started catching up rapidly in the mid 1980s.
11
The data series starts in 1984 for Tibet and in 1985 for Hainan. As a result, these two regions are excluded whenever data are missing. 12 It is argued, for example, that China’s official GDP growth rates might have been overestimated (Wu 1997, Ren 1997).
11
Table 3 Ranking of the Chinese regions in selected years _____________________________________________________________ Regions
Ranking 1953 1963 1973 1978 1985 1993 1997 _____________________________________________________________ Beijing 2 2 2 2 2 2 2 Tianjin 3 3 3 3 3 3 3 Hebei 12 22 13 8 13 10 9 Shanxi 9 11 10 10 11 15 16 Inner Mongolia 6 7 8 11 7 14 13 Liaoning 5 4 4 4 4 4 4 Jilin 8 9 9 9 10 12 12 Heilongjiang 4 5 5 5 5 8 11 Shanghai 1 1 1 1 1 1 1 Jiangsu 10 14 11 12 8 6 6 Zhejiang 14 13 17 15 6 5 5 Anhui 24 25 26 27 27 27 27 Fujian 17 15 20 19 18 9 8 Jiangxi 15 16 23 24 23 21 21 Shandong 21 23 15 17 16 11 10 Henan 22 28 25 26 22 22 22 Hubei 19 17 18 20 19 19 17 Hunan 23 24 21 21 21 24 24 Guangdong 11 12 16 18 15 7 7 Guangxi 27 20 22 22 26 25 23 Sichuan 26 26 27 25 25 26 26 Guizhou 28 27 28 28 28 28 28 Yunnan 25 19 24 23 24 23 25 Shaanxi 18 18 14 14 17 17 18 Gansu 13 21 19 16 20 20 20 Qinghai 20 10 7 7 14 18 19 Ningxia 16 8 6 6 9 16 15 Xinjiang 7 6 12 13 12 13 14 _____________________________________________________________ Note Tibet and Hainan Island are excluded from the sample due to missing data. The regions are ranked according to their GDP per capita. Number one represents the highest per capita GDP.
New Indicators of Regional Disparities
The above-described League Table can only show a broad picture about each region’s standing in the country. To compare the regions with each other, more complicated indicators have to be estimated. For the purpose of comparing this study with previous literature, the Gini and Theil indexes and the coefficients of variation are calculated
12
and analysed in the following section. These indicators of regional disparity are computed by using the following formulae: _
_
Coefficient of variation (unweighted: CV1)
∑ (Yi − Y )2 / n
Y
Coefficient of variation (weighted: CV2)
∑ p (Y
2
µ
Theil index
∑ Y log( Y / Y )
nY
Gini coefficient
∑∑ (Y − Y )
i
− µ)
i
_
i
_
i
2
i
j
_
2n 2 Y
where pi is the share of population of region i (over the national total), Yi per capita _
income, Y average per capita income, µ population weighted average income, ie.
µ = ∑ piYi and n the number of regions.
Estimation Results
Given the above descriptions, both weighted and unweighted coefficients of variation are computed together with the Gini ratios and Theil indexes. Surprisingly, these indexes show a similar pattern of changes over time (Figures 2 to 5). Several observations are worthy of notice.
First, according to these charts, regional disparity in China was reduced in the early 1950s but deteriorated dramatically in the late 1950s. The deteriorated disparity in the 1950s was partly due to the Great Leap Forward movement campaigned in 1958. Disparities within the regions were relatively stable in the 1960s but slightly increased in the 1970s.
Second, the trend of regional disparities was declining in the late 1970s and the 1980s. Thus, in contrast to most studies, this investigation has shown a positive impact of economic reforms on regional disparities. In particular, disparities within the central region, and within the coastal region excluding the three large cities have reduced considerably in the 1990s. This is in sharp contrast to many authors’ finding that regional disparities have worsened in the 1990s (eg. Tsui 1996, World Bank 1997,
13
1.4
1.2
1 CV1 CVCO CVCOA CVCE CVWE CV1A
0.8
0.6
0.4
0.2
1997
1995
1993
1991
1989
1987
1985
1983
1981
1979
1977
1975
1973
1971
1969
1967
1965
1963
1961
1959
1957
1955
1953
0
Figure 2 Coefficient of variation (weighted) Note
CV1, CVCO, CVCOA, CVCE, CVWE and CV1A are the estimated coefficients of variation for China, the coastal region including Beijing, Tianjin and Shanghai, the coastal region excluding the three large cities, the central region, the western region and China excluding the three large cities.
1.6
CV1 CVCO CVCOA CVCE CVWE CV1A
1.4
1.2
1
0.8
0.6
0.4
0.2
Figure 3 Coefficient of variation (unweighted) Note
Refer to the note to Figure 2.
14
1997
1995
1993
1991
1989
1987
1985
1983
1981
1979
1977
1975
1973
1971
1969
1967
1965
1963
1961
1959
1957
1955
1953
0
0.50 THEIL1 THEILCO
0.45
THEILCOA THEILCE
0.40
THEILWE THEIL1A
0.35
0.30
0.25
0.20
0.15
0.10
0.05
1997
1995
1993
1991
1989
1987
1985
1983
1981
1979
1977
1975
1973
1971
1969
1967
1965
1963
1961
1959
1957
1955
1953
0.00
Figure 4 Estimates of the Theil indexes Note
THEIL1, THEILCO, THEILCOA, THEILCE, THEILWE and THEIL1A are the estimated Theil indexes for China, the coastal region including the three large cities, the coastal region excluding these three cities, the central region, the western region and China excluding the three large cities.
0.6 GINI1 GINI1A GINICO GINICOA GINICE GINIWE
0.5
0.4
0.3
0.2
0.1
1997
1995
1993
1991
1989
1987
1985
1983
1981
1979
1977
1975
1973
1971
1969
1967
1965
1963
1961
1959
1957
1955
1953
0.0
Figure 5 Estimates of the Gini coefficients Note
GINI1, GINI1A, GINICO, GINICOA, GINICE and GINIWE are the estimated Gini ratios for China, China excluding the three large cities, the coastal region including the three large cities, the coastal region excluding the three large cities, the central region and the western region.
15
Lin et al 1998). The main problem with previous studies I reckon is their ignorance of the three large cities, ie. Beijing, Tianjin and Shanghai, as a special group in the coastal region.
Third, even if the three cities are included in the coastal region, the estimates in Figures 2 to 5 have shown that regional disparities have declined since the late 1970s but slightly risen since 1993. This rise was mainly due to the worsening disparity between the three regions.
Fourth, the impact of the three large cities on the magnitude of these indexes is also evident in Figures 2 to 5. With the inclusion of these cities, the magnitudes of these indexes have doubled or tripled. For example, without these three cities, the Gini ratios range from 0.15 to 0.30, which implies a low disparity within the regions according to international standards. However, with the presence of the three cities, the Gini ratios imply much severer disparities between the Chinese provinces (Gini1) and within the coastal region (Ginico).
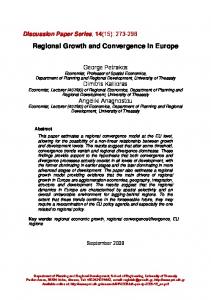
Finally, in particular, the disparity between the three cities and the rest of China had deteriorated dramatically since the early 1960s and it peaked in the mid 1970s. The presence of the three cities may partly explain the variation in empirical estimates of Gini ratios for China. Figure 6 illustrates the Gini ratios derived in this study and by several other authors. Gini1 and Gini1A are the estimates of the Gini ratios with and without the three cities. It seems that these two estimates in this study represent the upper and lower bounds of the estimated Gini ratios in Figure 6.
China’s regional disparity in international perspective For international comparisons of regional disparity, researchers have focused on comparing the value of the Gini coefficients and the income ratio of the richest to the poorest cohort in an economy. These comparisons are of course constrained by the
16
0.50 0.45 0.40
Gini ratios
0.35 0.30 0.25 0.20
This study (Gini1)
0.15
This study (Gini1A) Tsui (1996)
0.10
Lin et al. (1998) 0.05
Zhang (1998) 1997
1996
1995
1994
1993
1992
1991
1990
1989
1988
1987
1986
1985
1984
1983
1982
1981
1980
1979
1978
0.00
Figure 6 Various estimates of Gini ratios Sources Table 2 and Figure 5 in this paper.
availability and consistency of statistics for the countries involved. To shed some light on China’s regional disparity in international perspective, similar indexes are computed and presented in Table 4.
An examination of Table 4 reveals conflicting results. The magnitudes of the GDP ratios and the coefficients of variation show that regional disparity is much severer in China than in other countries, on the one hand. The estimates of the Gini ratios, on the other hand, provide evidence of relatively less disparity in China than in other countries. Any conclusion on the basis of either of those indexes is likely to be biased. Thus, the statements in some previous studies can be misleading due to researchers’ choice of indexes.
Regional Convergence
In the growth literature, two types of convergence have been defined, ie. the sigma and beta convergence (Barro and Sala-I-Martin 1995). The observed periodical decline of the disparity indexes as described above can be treated as evidence of sigma convergence following the neoclassical growth theory. Sigma convergence
17
Table 4 Indicators of regional disparities in selected countries _____________________________________________________________________ Countries GDP ratios Gini ratios CV _____________________________________________________________________ China 1953 1963 1973 1978 1985 1993 1997 India Bangladesh Indonesia Thailand Philippines South Korea Taiwan
4.1 ( 8.9) 4.3 (12.8) 7.4 (24.9) 7.2 (27.4) 6.3 (23.6) 7.0 (25.8) 7.6 (33.1)
.21 (.33) .23 (.35) .23 (.43) .23 (.46) .21 (.43) .24 (.43) .25 (.45)
.52 ( .80) .53 ( .87) .57 (1.21) .58 (1.34) .41 (1.17) .45 (1.13) .45 (1.20)
3.3 (1980)
.42 (1975/76) .37 (1985/86) .32 (1987) .47 (1975/76) .43 (1985) .36 (1971) .29 (1978)
.36 (1980)
4.0 (1983)
1.53 (1985)
.34 (1983)
.15 (1985)
Australia 1.1 (1978) .05 (1978) US 1.4 (1983) .11 (1983) UK 1.6 (1988) .15 (1988) Japan 1.5 (1981) .12 (1981) _____________________________________________________________________ Notes and sources GDP ratios are the ratios of per capita GDP of the richest region over the poorest region. The figures for China are derived in this study and two sets of them are computed with the exclusion and inclusion (in parentheses) of the three large cities, respectively. The estimates for other countries are from Khan et al. (1993, p.61) for the Gini ratios and Hu et al. (1995, p.92) for the GDP ratios and the coefficients of variation (CV).
occurs if cross-sectional disparity of per capita income declines over time. Another concept is beta convergence which measures how fast poor regions catch up with rich ones. It is shown that beta convergence is a necessary but not a sufficient condition for sigma convergence (Barro and Sala-I-Martin 1995, p.385). Beta convergence can be estimated in the following framework
(
)
log YiT − log Yi0 = A − 1 − e − βT log Yi0 + ε i
where Yi0 and YiT are the initial income and income at the end of the period considered, T the length (years) of the period, β the convergence rate per annum, A the intercept and ε i the error term.
18
Various time intervals were tried to derive estimates of beta convergence. Judging from the sign and the value of the coefficients, per capita income has diverged in most time periods. To reflect regional variations in convergence, two dummy variables representing the central and western regions were added to the regressions. It is argued that the inclusion of these dummies would help to obtain accurate estimates (Barro and Sala-i-Martin 1995). However, the estimation results from the expanded regressions were more or less the same. For the sake of brevity, a summary of the findings for the time interval corresponding to the Five Year Plan periods in China is presented in Table 5. It is clear that, during the eight Five Year Plan periods, the regions have mainly shown the tendency of divergence or weak convergence. The only period during which convergence was strong was 1981-85, with an annual rate of convergence of about 1 per cent. This trend of convergence has also been found in studies of other variables such as efficiency (Wu 1999) and income (Jian et al. 1996).
Table 5 Estimation results of beta convergence _____________________________________________________________________ Periods
Without dummies
With dummies (intercept)
_____________________________________________________________________ 1st FYP: 1953-57 2nd FYP: 1958-62 3rd FYP: 1966-70 4th FYP: 1971-75 5th FYP: 1976-80 6th FYP: 1981-85 7th FYP: 1986-90 8th FYP: 1991-95
weak convergence divergence divergence divergence weak convergence strong convergence weak convergence divergence
weak convergence divergence divergence divergence weak convergence strong convergence weak convergence divergence
1991-97 divergence divergence 1953-97 weak convergence weak convergence _____________________________________________________________________ Notes The dummies considered include one each for the western and central regions.
To make a comparison with the existing work by Jian et al. (1996), Gundlach (1997), and Raiser (1998), regressions applying data of the same periods were run and, unfortunately, none of these regressions appeared to result in the same findings by the above-mentioned three studies (Table 6). The discrepancy may be due to the
19
inconsistency of statistics used, ie. Raiser applied GDP per worker while GDP per capita is used in this study. However, both this study and Raiser’s have shown that i) there was evidence of beta convergence in the late 1970s and early 1980s, and ii) convergence slowed down in the second half of the 1980s. In addition, results from regressions including regional dummies show that convergence was faster in the central and western regions than in the coastal region. Furthermore, convergence has occurred within the central and western regions in the entire period of 1978-97 (Table 7). Table 6 Beta convergence estimates in this and other studies _____________________________________________________________________ Periods
Without dummies With dummies (intercept) This Raiser Gundlach Jian et al. This Raiser study 1998 1997 1996 study 1998 _____________________________________________________________________ 1978-83 1984-89 1978-89 1978-85 1985-92 1978-92
1.0** 0.3 0.7*** 0.9** 0.0 0.5
3.1* 1.8*** 2.2* 3.4* 0.8 2.6*
n.a. n.a 2.2** n.a. n.a. n.a.
n.a. n.a. n.a. n.a. n.a. 1.6**
1.0** 0.3 1.1*** 1.4* 0.0 1.4*
n.a. n.a. n.a. 4.0* 2.1*** 3.4*
1978-97 0.4 n.a. n.a. n.a. 1.5* n.a _____________________________________________________________________ Notes
* Significant at the level of 1%. ** Significant at the level of 5%. *** Significant at the level of 10%.
5. Concluding Remarks
This study presented a comprehensive review of the existing literature on regional income disparity and convergence in China. The focus of the debate in the literature is the impact of China’s economic reform on regional disparity. The findings are inconclusive and often conflicting to each other due to several common problems associated with statistics and methodologies. In this study, recently released regional income data are applied to estimate various indicators of disparities and these estimates are compared to the findings by other authors. Several conclusions can be drawn from this study.
20
Table 7 Beta convergence among the regions _____________________________________________________________________ Periods
Coastal Central Western This study Raiser _____________________________________________________________________ 1978-85 1985-92 1978-92
1.1 1.4 1.4
1978-97 1953-97
1.4 divergence
4.1% 3.3% 3.5%
2.3** divergence 1.1
2.8 divergence 1.7
2.2** 0.9**
1.3 divergence
1st FYP 2nd
divergence 1.3 2.8 1.0 divergence divergence divergence 1.1 divergence divergence divergence divergence 0.6 0.8 0.6 1.1 2.3*** 2.3 0.8 divergence divergence 2.2 4.4* 2.5 _____________________________________________________________________ Notes
* significant at the level of 5%. ** significant at the level of 15%. *** significant at the level of 20%.
(i) Regional disparity has experienced considerable fluctuation in the past fortyfive years, with the worst disparities observed around the late 1960s. The two decades reform has generally contributed to the reduction in regional disparities according to this study. The reduction was particularly significant in the early 1980s.
(ii) Beijing, Tianjin and Shanghai are outliers in terms of per capita income. Excluding these cities, Chinese regional economies have shown modest disparities. Earlier studies comparing these cities to the provinces are likely to be biased and hence to draw misleading conclusions.
(iii) International comparisons of regional disparities are affected by the choice of indicators. On the one hand, according to the estimates of the Gini coefficients, China’s regional disparity is still low relative to other countries’. On the other
21
hand, if the GDP ratio of the richest over the poorest regions is compared, China has shown the worst regional disparity among both developing and developed countries. Thus, conclusions based on either indicator are misleading.
(iv) Chines regional economies have experienced different rates of convergence during the reform period (1978-97). In general, convergence was fast in the late 1970s and early 1980s. The two non-coastal regions have converged faster than the coastal economies.
The results reported in this paper only represent part of the outcome of the author’s work on China’s regional disparities. Further investigation will extend the present study to cover two more issues. First, the author will attempt to apply the same techniques in this study to analyse household survey data, and hence to compare the findings with those from the application of GDP statistics. Second, this study will be expanded to investigate the sources of regional disparities, which could be due to the structural shift in the regional economies or the change in the composition of family income during the reform period. After identifying the sources of regional disparities, policy implications can then be drawn.
Acknowledgment
Work on this paper was supported by an Economics Departmental Research and Teaching Grant, UWA. The author also acknowledges Mei Wen and participants of the 11th Annual Meeting of the Association for Chinese Economic Studies (Australia) (ACES) at the University of Melbourne, and seminar at the East Asian Institute, National University of Singapore for helpful comments and suggestions.
References
Alesina, A. and D. Rodrik, 1994, “Distributive politics and economic growth”, Quarterly Journal of Economics, 109, 465-40. Barro, R.J. and X. Sala-I-Martin, 1995, Economic growth, McGraw Hill, Boston, MA. Benabou, Roland, 1996, “Inequality and growth”, NBER Macroeconomics Annual, 11-74. 22
Chen, Jian and B.M. Fleisher, 1996, “Regional income inequality and economic growth in China”, Journal of Comparative Economics, 22, 141-64. Chen, S. and M. Ravallion, 1996, “Data in transition: assessing rural living standards in southern China”, China Economic Review, 7, 23-56. Chen, Zongshen, 1995, Economic development and income distribution, Shanghai Sanliang Shudian, Shanghai. Chiu, W. Henry, 1998, “Income inequality, human capital accumulation and economic performance”, Economic Journal, 108, 44-59. Clarke, G.R.G., 1995, “More evidence on income distribution and growth”, Journal of Development Economics, 47, 403-27. Denny, D.L., 1991, “Provincial economic differences diminished in the decade of reform”, in US Congress Joint Economic Committee (ed.), China’s economic dilemmas in the 1990s: the problems of reforms, modernisation and interdependence, Vol.1, US Government Printing Office, Washington DC. Dowrick, S., 1995, “The determinants of long-run growth”, in P. Andersen, J. Dwyer and D. Gruen (eds) Productivity and growth, proceedings of a conference, Reserve Bank of Australia. Duncan, R. and X. Tian, 1998, “China’s inter-provincial disparities, 1952-95”, mimeo, NCDS, Australian National University. Easterly, W., 1995, “Explaining miracles: growth regressions meet the gang of four”, in T. Ito and A.O. Krueger (eds) Growth theories in light of the East Asian experience, University of Chicago Press, Chicago. Fei, John C.H., Gustav Ranis and Shirley W.Y. Kuo, 1979, Growth with equity: the Taiwan case, published for the World Bank, Oxford University Press, New York. Friedman, Edward, 1987, “Maoism and the liberation of the poor”, World Politics, 39, 408-28. Galor, O. and J. Zeira, 1993, “Income distribution and macroeconomics, Review of Economic Studies, 60, 35-52. Gundlach, Erich, 1997, “Regional convergence of output per worker in China: a neoclassical interpretation”, Asian Economic Journal, 11, 423-42. Gustafsson, B. and Li, Shi, 1998, “Inequality in China at the end of 1980s: locational aspects and household characteristics”, Asian Economic Journal, 12, 35-64.
23
Hu, Angang, Chaoguang Wang and Xiaoguang Kang, 1995, Regional disparities in China, Liaoning People’s Press, Shengyang. Hu, Dayuan, 1997, “Economic transition and regional disparity”, mimeo, CCER, Peking University. Hussain, A., P.Lanjouw and N. Stern, 1994, “Income inequalities in China: evidence from household survey data”, World Development, 22, 1947-57. Jian, T., J.D. Sachs and A.M. Warner, 1996, “Trends in regional inequality in China”, China Economic Review, 7, 1-21. Khan, Azizur Rahman and Carl Riskin, 1998, “Income and inequality in China: composition, distribution and growth of household income, 1988 and 1995”, China Quarterly, 154, 221-53. Khan, Azizur Rahman, Keith Griffin, Carl Riskin and Renwei Zhao, 1993, “Household income and its distribution in China”, in Keith Griffin and Renwei Zhao (eds), The distribution of income in China, Macmillan Press, Basingstoke. Knight, J. and L. Song, 1993, “the spatial contribution to income inequality in rural China”, Cambridge Journal of Economics, 17, 195-213. Lardy, N., 1978, Economic growth and distribution in China, Cambridge University Press, Cambridge. Lardy, N., 1980, “Regional growth and income distribution in China”, in F.R. Denberger (ed.) China’s development experiences in comparative perspective, Harvard University Press, Cambridge MA. Lee, J., 1994, “Regional differences in the impact of the open door policy on income growth in China”, Journal of Economic Development, 19, 215-34. Li, Shi, Renwei Zhao and Ping Zhang, 1998, “China’s economic transition and the change in income distribution”, Economic Research Journal, April, 42-52. Li, Shi and Renwei Zhao, 1999, “On China’s income distribution again”, Economic Research Journal, April, 3-17. Lin, Justin Y.F., F.Cai and Z. Li, 1998, “An analysis of regional gaps in China’s economic transition”, Economic Research Journal, June, 3-10. Lippit, V.D., 1987, The economic development of China, Sharpe, Armonk, N.Y. Lyons, T.P., 1991, “Interprovincial disparities in China: output and consumption, 1952-87”, Economic Development and Cultural Change, 39, 471-506.
24
Lyons, T.P., 1997, “Intraprovincial disparities in post-Mao China: a multidimensional analysis of Fujian province”, Journal of Developing Areas, 32, 1-27. Meng, Xin and Harry X. Wu, 1998, “Household income determination and regional income differential in rural China”, Asian Economic Journal, 12, 65-88. Perotti, R., 1996, “Growth, income distribution and democracy: what the data say”, Journal of Economic Growth, 1, 149-87. Persson, T. and G. Tabellini, 1994, “Is inequality harmful for growth”, American Economic Review, 84, 600-21. Raiser, M., 1998, “Subsidising inequality: economic reforms, fiscal transfers and convergence across Chinese provinces”, Journal of Development Studies, 34, 1-26. Ren, Ruoen, 1997, China’s economic performance in an international perspective, OECD Development Centre, Paris. Research Team, 1997, “Analyses and suggestions of urban income disparities”, Economic Research Journal, August, 3-10. Riskin, C., 1987, China’s political economy, Oxford University Press, Oxford. Rozelle, S., 1996, “Stagnation without equity: patterns of growth and inequality in China’s rural economy”, China Journal, 35, 63-92. Selden, M., 1988, The political economy of contemporary China, Sharpe, Armonk, N.Y. State Statistical Bureau, 1997, China’s GDP data 1952-95, Dongbei University of Economics and Finance Press, Daliang. State Statistical Bureau, 1998, A statistical survey of China 1998, Statistical Publishing House of China, Beijing. Tian, X., 1998, “Uneven regional growth in post-1978 China”, mimeo, NCDS, Australian National University. Tsui, Kai-yuen, 1996, “Economic reform and interprovincial inequalities in China”, Journal of Development Economics, 50, 353-368. Tsui, Kai-yuen, 1998, “Factor decomposition of Chinese rural inequality: new methodology, empirical findings and policy implications”, Journal of Comparative Economics, 26, 502-28. Wan, Guanghua, 1998, “An empirical analysis of inhabitants’ income differential among China’s rural areas and its changes”, Economic Research Journal, May, 36-41. 25
Wei, Wei, 1995, Regional disparities and coordination in China, Anhui People’s Press, Hefei. World Bank, 1997, Sharing rising incomes: regional disparities in China, the World Bank, Washington DC. Wu, H., 1997, “Reconstructing Chinese GDP according to the National Accounts concept of value added: the industrial sector, 1949-94”, Research Report 97C24, Research Institute of Systems, Organisations and Management, University of Groningen. Wu, Y., 1999, “Productivity and Efficiency in China’s Regional Economies”, in Economic Efficiency and Productivity Growth in the Asia-Pacific Region, edited by Tsu-Tan Fu, Cliff Huang and Knox Lovell, chapter 8, Edward Elgar, Cheltenham. Xu, Xianchun and Xiaoqin Tian, 1997, “The Collection of China’s GDP data (195277) and the method of measurement”, Economic Research Journal, September, 65-71. Yang, Dali, 1990, “Patterns of China’s regional development strategy”, China Quarterly, 122, 230-257. Zhang, Ping, 1998, “Regional income inequality and nonagricultural employment in rural China”, Economic Research Journal, August, 59-66. Zhao, Renwei and S. Li, 1997, “Increasing income inequality and its causes in China”, Economic Research Journal, September, 19-28. Zhao, S. Xiaobin, 1996, “Spatial disparities and economic development in China: 1953-92: a comparative study”, Development and Change, 27, 131-63.
26