Spreadsheet language programs are among the most common forms of ... spreadsheet systems, one of the most widely used PC business applications, are a ...
INCORPORATING INCREMENTAL VALIDATION AND IMPACT ANALYSIS INTO SPREADSHEET MAINTENANCE: AN EMPIRICAL STUDY Vijay B. Krishna, Curtis R. Cook, Daniel Keller, Joshua Cantrell, Chris Wallace, Margaret M. Burnett, and Gregg Rothermel Oregon State University, Corvallis, OR 97331 {krishnvi, cook, keller, cantrjos, wallacch, burnett, grother}@cs.orst.edu
ABSTRACT Spreadsheet language programs, which include commercial spreadsheets, are among the most common form of software in use today. Unlike more "traditional" forms of software however, spreadsheet language programs are created and maintained by end-users with little or no programming experience. As a result, a high percentage of these programs contain errors. Unfortunately, software engineering research has for the most part ignored this problem. We have developed a methodology that is designed to aid end-users in developing, testing, and maintaining spreadsheet language programs. The methodology communicates testing information and information about the impact of cell changes to users in a manner that does not require an understanding of formal testing theory or the behind the scenes mechanisms. This paper presents the results of an empirical study that shows that, during maintenance, end-users using our methodology were more accurate in making changes and did a significantly better job of validating their spreadsheets than end-users without the methodology. Keywords: spreadsheets, maintenance, testing, impact analysis, empirical study, visual programming
1. INTRODUCTION Spreadsheet language programs are among the most common forms of software in use today. Commercial spreadsheet systems, one of the most widely used PC business applications, are a subclass of spreadsheet languages. The relative simplicity of the spreadsheet paradigm lets end-users with little or no formal programming background quickly automate a wide variety of computational tasks. The spreadsheets these users create play an influential role in decisions about budgets, investments, student grades, taxes, and many other important issues. Spreadsheets are not just mechanisms for organizing and displaying data: rather, they are programs that use formulas to transform inputs into outputs. Moreover, like programs in imperative languages, spreadsheets often contain errors. A survey of the literature [15] provides several examples: in four field audits of operational spreadsheets, errors were found in an average of 20.6% of the spreadsheets audited; in eleven experiments in which participants created spreadsheets, errors were found in an average of 60.8% of those spreadsheets; in four experiments in which the participants inspected spreadsheets for errors, the participants missed an average of 55.8% of those errors. Two large auditing firms reported finding errors in 90% of the spreadsheet financial models they reviewed [15]. Such errors can have serious consequences; for example, a Dallas oil and gas company lost millions of dollars in an acquisition deal because of spreadsheet errors [14]. Compounding these problems, spreadsheet programmers exhibit unwarranted confidence in the correctness of their spreadsheets and their modifications [2, 16, 26]. For instance, Brown and Gould [2] studied nine experienced spreadsheet users with an average of 2.7 years and eight hours per week of experience. Although these subjects were quite confident that their spreadsheets were accurate, 44% of the spreadsheets they created contained errors and every subject made at least one error. Spreadsheet errors can often be traced to problems in spreadsheet "development"; however, it is widely acknowledged that spreadsheet users also report difficulties with "maintenance" tasks such as understanding, debugging, modifying, and enhancing spreadsheets [5, 16, 17]. Given the ubiquity of spreadsheets and the importance of the tasks they perform, we would like to help spreadsheet users avoid such difficulties. One natural place to seek such help is the software engineering community. Most previous research in software engineering, however, has addressed problems faced by professional software engineers using imperative languages; comparatively little research has addressed problems involving the "engineering" of spreadsheets. Moreover, in our search of the literature, with the exception of a few papers
1
addressing problems in spreadsheet debugging and auditing [5, 19], we find no research directly addressing problems related to spreadsheet maintenance and evolution. This is particularly distressing because, like successful imperative programs, successful spreadsheets undergo evolution, adaptation, perfection, and correction, often in the hands of users other than their initial developers. Therefore, we have been investigating the possibility of bringing some of the benefits of formal software engineering techniques to the creators and maintainers of spreadsheets. Our initial focus has been on the testing and debugging of spreadsheets, and one outcome of this work has been our "What You See Is What You Test" (WYSIWYT) spreadsheet testing methodology [21, 22]. The WYSIWYT methodology provides feedback about the "testedness" of a spreadsheet so that its creators will be motivated to test their spreadsheets more thoroughly. The methodology has been designed, however, to function incrementally, as formulas and data are added to, deleted from, and modified in a spreadsheet, using impact analysis to determine where revalidation is needed. Thus, the methodology is expected to support not just the initial development of spreadsheets, but also their evolution and maintenance. To date, our studies of the WYSIWYT methodology [20, 21] have focused on its application to complete spreadsheets. These studies have shown that the methodology can help spreadsheet users test their spreadsheets more effectively and more efficiently. Thus far, however, we have not empirically investigated the methodology in the context of spreadsheet maintenance. Furthermore, our studies have focused on computer science students, who represent only a specialized subset of spreadsheet users. To more generally assess the potential of the WYSIWYT methodology, we require studies of end-users engaged in maintenance tasks. We have therefore conducted an experiment, investigating the use of our methodology in the context of a spreadsheet modification task, and focusing on end-users who are not computer science students. Our results indicate that end-users using our WYSIWYT methodology during spreadsheet maintenance are more accurate in making changes and do a significantly better job of validating their spreadsheets than do end-users employing Ad Hoc approaches. Furthermore, the end-users using the WYSIWYT methodology are less overconfident than those using the Ad Hoc approach that their spreadsheets do not contain errors. Below we review the relevant literature, describe the WYSIWYT methodology, and present our experimental design, analysis, and conclusions.
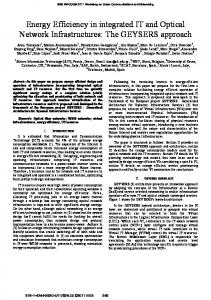
2. BACKGROUND 2.1 Spreadsheet Languages and Forms/3 Spreadsheet languages, also known as form-based languages in some of the research literature, provide a declarative approach to programming characterized by a dependence-driven, direct-manipulation working model [1]. Users of spreadsheet languages create cells and define formulas for those cells. These formulas reference values in other cells and use them in calculations. When a cell's formula is defined, the underlying evaluation engine calculates the cell's value and the values of other affected cells and displays the results. We have prototyped our WYSIWYT methodology in the research language Forms/3 [3], one of many spreadsheet language research systems (e.g. [3, 4, 11, 13, 23, 24]). This choice is motivated partly by the fact that we have access to the implementation of Forms/3, and thus, we can implement and experiment with various testing technologies within that environment. More important, however, is that by working with Forms/3, we can investigate language features common to commercial spreadsheet languages as well as advanced language features found in research spreadsheet languages. Figure 1 shows an example of a Forms/3 spreadsheet. The figure depicts a financial spreadsheet that represents the cashflow projection model for a "Pizza Parlor" consisting of information about sales, expenses and final cashflow for three months. Forms/3 spreadsheets are not restricted to fixed grid of cells and we can give the cells meaningful names. For example, the cell representing the cost of ingredients for January is called cost_ingredients_jan.
2
Figure 1: Pizza sales spreadsheet The cells in the spreadsheet can be categorized as input cells or output cells, depending on whether they take inputs, or calculate values based on other cell values. In the figure, Pizza_jan is an input cell (thin border) and cost_ingredients_jan is an output cell (thick border). Cell formulas may be hidden or displayed. In this figure, the formula for cell cost_ingredients_feb is displayed.
2.2 The WYSIWYT methodology Our WYSIWYT methodology relies, behind the scenes, on code-based test adequacy criteria. Code-based test adequacy criteria provide help in selecting test data and in deciding whether a program has been tested "enough'' by relating testing effort to coverage of code components. Such criteria have been well researched for imperative languages (e.g. [8, 12, 18]), and several empirical studies (e.g. [7, 9, 25]) have demonstrated their usefulness. Our methodology incorporates a test adequacy criterion adapted from the output-influencing-all-du-pairs dataflow adequacy criterion defined originally for imperative programs [6]. This criterion, which we call du-adequacy for brevity, focuses on the definition-use associations (du-associations) in a spreadsheet, where a du-association links an expression (in a cell formula) that defines a cell's value with expressions in other cell formulas that reference (use) the defined cell. The criterion requires that each executable duassociation in the spreadsheet be exercised by test data in such a way that the du-association contributes (directly or indirectly) to the display of a value that is subsequently pronounced correct (validated) by the 1 programmer. The appropriateness of the du-adequacy criterion for spreadsheets stems from the fact that by relating test coverage to interactions between definitions and uses of cells, the criterion requires these interactions to be 1
It is not always possible to exercise all du-association; those that cannot be exercised are called nonexecutable. Determining whether a du-association is executable is provably impossible in general and frequently infeasible in practice [9, 25]; thus, data flow test adequacy criteria typically require that test data exercise (cover) only executable du-associations. Our criterion does the same.
3
exercised. Since such interactions are a primary source of errors in spreadsheets, this is valuable. Moreover, by linking test coverage to cell validation, the criterion avoids problems in which duassociations influencing only values that are hidden or off-screen are considered exercised simply by applying test inputs; instead, the du-association must participate in producing a visible result judged correct by the programmer. The criterion also facilitates the incremental validation of spreadsheets, allowing a test to involve entry of values into a small subset of the potentially large set of input cells in a spreadsheet, followed by validations of multiple cells. Finally, the criterion facilitates impact analysis: when a spreadsheet programmer changes a formula, the information used to support the criterion can be used to calculate the du-associations added or potentially affected by this modification. The system can then require their (re) validation. Key to the usefulness of the WYSIWYT methodology, however, are devices for communicating testing and impact information to the spreadsheet user, in a manner that does not require understanding of formal testing theory. To show how our methodology provides this we offer the following example. Suppose a programmer has created the financial spreadsheet of Figure 1. During this process, the underlying evaluation engine has not only been displaying cell values, but has also been calculating the duassociations that come into existence as new formulas are created, and tracking the du-associations that influence calculations. Using this information, visual devices keep the programmer continually informed of testedness status, draw attention to untested sections of the evolving spreadsheet, and suggest where testing activity will provide new progress (according to our adequacy criterion). For example, suppose the spreadsheet programmer now decides that cell totalexp_feb's displayed value is correct, given the value of the cells it depends on, and clicks on the checkbox in the upper right corner of that cell to validate it. The system responds with immediate visual feedback as to the new testedness of each visible cell and arrow, as well as for the whole spreadsheet, as shown in Figure 1. The underlying validation algorithm is given in [21]; the overall notion is that it recurses back through the du-associations that affect, directly or indirectly, the currently computed value of totalexp_feb, and marks them tested. The system depicts a fully tested cell with blue borders (black in this paper), an untested cell with red borders (light gray), and a partially tested cell with borders in various shades of purple (darker gray). The programmer can choose to display arrows showing interactions between some of the cells. The arrows follow the same color scheme as the cell borders. We provide additional testing information through the marks in the cell's checkbox: an exclamation point means that validating that cell's value will increase the spreadsheet's testedness, a question mark indicates that some previous value for this cell was validated, a blank indicates that no opinion has been recorded about this cell's value, and a check mark indicates that the user's validation was recorded. Finally, additional testedness information is provided by the "percent tested" indicator at the top of the window which shows the percent of du-associations that have been tested. Suppose the programmer has validated a large percentage of the du-associations in the spreadsheet, turning most borders and arrows blue, and suppose that the programmer decides to alter a formula - either to correct an error or to enhance the spreadsheet. When the programmer completes the alteration, the underlying evaluation engine uses static information about du-associations to walk forward through cells that use, directly or indirectly, the modified cell, and mark those du-associations "not validated". Having completed this impact analysis task, the engine updates the border and arrow colors and other indicators to reflect the new testedness status of the spreadsheet. This act draws the programmer's attention to the need to re-validate interactions newly created, or potentially impacted, by the modification.
3. EXPERIMENT DESIGN The objectives of our study were to investigate the following research questions: RQ1: Are end-users who use the WYSIWYT methodology more accurate in performing spreadsheet modifications than end-users who use an ad-hoc approach? RQ2: Are end-users who use the WYSIWYT methodology more effective in testing modified spreadsheets than end-users who use an ad-hoc approach?
4
RQ3: Are end-users who use the WYSIWYT methodology less overconfident about the accuracy of their spreadsheets than end-users who use an ad-hoc approach? RQ4: Are end-users who use the WYSIWYT methodology less overconfident about the quality of their testing of modified spreadsheets than end-users who use an ad-hoc approach? These questions were translated directly into hypotheses. We also took care that the design of our experiment would provide insight into the following question: Is training in the underlying test adequacy criterion and its relationship to the visual devices needed in order for the spreadsheet maintainer to perform more effectively when using our methodology?
3.1 Procedure To investigate our research questions, we conducted a controlled laboratory experiment. In the experiment, the subjects modified and tested a spreadsheet. Almost half of the subjects ("Tools" subjects) did so using the spreadsheet environment that included the WYSIWYT methodology, and the rest ("Ad Hoc" subjects) used the same environment minus the WYSIWYT methodology. The experiment was conducted in a small lab with six workstations running Windows NT with the subjects seated one per workstation. The experiment began with a 25-minute tutorial on Forms/3 in which each subject actively participated by working with several example spreadsheets on their individual workstations. (The tutorial is described further in Section 3.3.) All subjects were given additional unstructured time to practice their Forms/3 skills and to practice making changes in the tutorial example problems. To control for amount of exposure to the environment, both groups of subjects were given identical amounts of training time. Subject data was collected during the experiment from pre- and post-problem questionnaires and from electronic transcripts that recorded all on-line modification and testing activities. The pre-problem questionnaires measured the subjects' understanding of the Forms/3 problem and the post-problem questionnaires measured the subjects' perceptions of how well they had performed the modification and testing tasks. The post-problem questions for the Tools subjects also included questions about their understanding and use of the feedback devices provided by the WYSIWYT methodology.
3.2 Subjects Since we were investigating whether typical spreadsheet end-users could effectively use the WYSIWYT methodology, we decided to draw subjects from a pool of business school students, because we believed they would be representative of spreadsheet end-users and have the business domain knowledge required to understand many typical spreadsheet applications. We selected 36 students who were either currently enrolled in or had recently taken a sophomore business course in which they worked with spreadsheet financial models. The subjects were a mix of sophomore and junior business majors with varying levels of spreadsheet and programming experience. We randomly partitioned these students into two groups: a control ("Ad Hoc") group of 17 students that did not have access to our WYSIWYT methodology, and a treatment ("Tools") group of 19 students that did have access to the methodology. (The difference in the group size was due to a few subjects failing to arrive for their appointment.) To ascertain whether the subjects had reasonably similar backgrounds, we administered a questionnaire that asked about their academic background and experience with spreadsheets and programming. A summary of the analysis of the responses is given in Table 1. A subject was credited programming experience if he or she had a high school or college class or professional experience in programming. A subject was credited with spreadsheet experience if he or she had created a spreadsheet for a high school or college class, or for professional or personal use. As Table 1 shows, there is little difference in the collective backgrounds of the two groups. Only one subject reported experience using Forms/3. Our statistical analysis showed homogeneity between the two groups.
5
Group Number of Average Subjects with Subjects with Subjects with exposure to experimental subjects GPA programming spreadsheet environment experience experience 17 3.09 8 17 0 Ad Hoc 19 3.35 10 19 1 Tools Table 1: Subject group demographics
3.3 The Tutorial During the 25-minute tutorial on Forms/3, each subject worked with example spreadsheets on their machine following instructions given by the lecturer. The tutorial introduced basic language features (e.g. basic syntax of formulas) and environmental features (e.g. how to create, delete, and edit cells) that would eventually be used in the spreadsheet modification task. Throughout the tutorial the subjects had access to a hardcopy quick reference guide to the features they were being taught. They could make notes on the handouts, which remained available to them throughout the experiment. An assistant was available to answer questions. In the tutorial, testing was described as a process of trying different input values and recording decisions about the correctness of values in output cells. All subjects were asked to record decisions by clicking on a checkbox only for those output cells whose value seemed correct to them. The tutorial for the Tools subjects also included basic instructions on the use of cell border colors, arrows, percent-tested indicator, and checkboxes. Because one of the goals of the WYSIWYT methodology is that the user need not acquire an understanding of formal testing theory, we explained only that red means "not tested", blue means "fully tested", and purple means "partially tested". Inside checkboxes, the blanks were described as meaning "a testing decision has not been recorded", check marks as "you have made a decision for this cell's value for the current set of input values", the question mark as meaning "you have made a decision for this cell's value for some previous input values", and the exclamation point as meaning "by checking this cell's checkbox you will increase the testedness of the spreadsheet". We did not mention the underlying concepts of du-associations or impact analysis, nor did we describe non-executable du-associations. Following these explanations, the subjects were given unstructured time to practice their Forms/3 skills. Regardless of which group a subject was in, the total training time was identical; subjects not receiving explanations of the methodology's feedback were given more unstructured time to practice using Forms/3. It was important to equalize the total time, because the additional instructions that the Tools subjects received provided them with additional practice in Forms/3, and this additional practice time could have confounded the results. Since the subjects had little or no previous exposure to the Forms/3 environment, at the conclusion of the tutorial the subjects could be considered equal in their knowledge of Forms/3.
3.4 Tasks and Materials The subjects were given the experimental task once the tutorial was completed. The experimental task involved making changes to a spreadsheet (Figure 1) containing a cash flow projection model for a pizza restaurant. The model included the pizza sales for each of three months (January, February, and March) and the expenses (cost of pizza ingredients, worker's salaries). The pretax cash flow was the difference between sales and expenses. Taxes were deducted from the pretax cash flow to yield an after tax cash flow. The model was similar to a spreadsheet model the subjects had encountered in a sophomore level business class. A complete description of the problem and materials is included in [10]. We instructed the subjects to read the description of the spreadsheet they were about to work with. The description included details on the cash flow projections for the pizza restaurant. We then administered a five question comprehension quiz, so that we could assess the subjects' basic understanding of the problem and whether they could relate parts of the description of the model to the cells in the Forms/3 spreadsheet. (Over three-fourths of the subjects answered all five questions correctly.) Following this quiz, we gave the subjects their experimental task, which involved making changes to the pizza restaurant model. In brief, the subjects were asked to (1) modify the tax rate for each of the three months covered by the model, (2) add spaghetti (sales and cost of ingredients) to the restaurant's menu for
6
the last two of the three months, and (3) add an additional worker for the last two months. To encourage the students to test the modified model the task description indicated that the initial unmodified spreadsheet model was correct and that it was important that the modified spreadsheet not contain errors. The subjects were given 15 minutes to make the modifications and to verify that the spreadsheet was working correctly. The subjects completed the post-problem questionnaire after the modification task. The results and analysis of the questionnaires and transcripts are presented in the next section.
4. RESULTS AND ANALYSIS 4.1 Accuracy Our first research question considers whether using our methodology helped the subjects make the modifications more accurately. The modification was scored on an 18-point basis according to the following: Tax rate change (1 point per month for a total of three points); Adding spaghetti to the menu (4 points/month for a total of 12 points); Adding additional worker (1 point per month for a total of 3 points). Note that since the spaghetti and additional worker changes were for February and March only, leaving January unchanged was worth 4 points for the spaghetti change and 1 point for the worker change. The average modification scores for the Ad Hoc and Tools subjects for each modification subtask are given in Table 2. The average total modification score was higher for the Tools subjects but not significantly higher (Mann-Whitney, p = 0.1681). On further examination of the data, however, we discovered that one Tools subject had scored only 7 out of 18: over 3 standard deviations below the mean and considerably below any other Tools subject. With this outlier removed, the Tools subjects' total modification scores were significantly higher than the Ad Hoc subjects' modification scores (Mann-Whitney, p = 0.0861). Group
Tax Rate Spaghetti (3 points) (12 points) Ad Hoc (n=17) 2.71 (.69) 9.94 (2.1) Tools (n=19) 2.79 (.63) 10.74 (1.6)
Worker (3 points) 2.94 (.24) 2.63(.83)
Total Modification 15.6 (2.1) 16.2 (2.7)
Table 2: Average modification scores for each subtask and the total modification task
4.2 Testing A second research question considers whether the subjects with the WYSIWYT methodology were more effective in their testing. To encourage all subjects to test their spreadsheets after making changes, the modification task description for both groups indicated that the original spreadsheet had been thoroughly tested and that the modified spreadsheet needed to be correct. Each click in a checkbox to record a decision about a cell's value by the subject was considered to be a test. Table 3 shows that our methodology provides strong encouragement to test the modified spreadsheets: significantly more Tools subjects than Ad Hoc subjects executed at least one test (Fisher's Exact Test, df=1, p=0.0004). Also, the five Ad Hoc subjects who executed at least one test executed an average of 8.4 tests while the 17 Tools subjects who executed at least one test executed an average of 31.7 tests. Because the testing difference between the two groups of subjects was so dramatic, we wondered whether some of the Ad Hoc subjects might have "tested" by visually inspecting cell formulas for different input values, rather than by clicking checkboxes. Our inspection of the transcripts, however, revealed that this had not occurred: after completing the modifications, only one of the 12 Ad Hoc subjects who did not execute a test made a change to the input cells; further, only 5 of these 12 subjects displayed a cell formula after completing their modifications. During their testing after completing the modifications, three of the Tools subjects found and corrected errors; no Ad Hoc subject who executed tests found an error after completing the modifications. Hence our WYSIWYT methodology seems to provide strong visual suggestions to test and helps find errors during maintenance.
7
Group No tests At least one test Ad Hoc (n=17) 12 5 Tools (n=19) 2 17 Table 3: Number of subjects executing no test cases and executing at least one test.
4.3 Overconfidence In spite of the high percentage of spreadsheets containing errors, studies [2, 16, 26] have reported that endusers are very confident that their spreadsheets do not contain errors. Experience does not seem to matter as these studies have shown that both novices and experts are overconfident about the correctness of their spreadsheets. One goal of our research is to reduce overconfidence by providing feedback about testedness and about the impact of changes. Recall that participants using our methodology received feedback via changes in cell border and arrow colors, in the "percent tested" indicator, and in checkboxes, after each change to a cell or after each test was executed. To determine the impact of this feedback on overconfidence, after completing the experimental task, we asked the participants to answer questions about the correctness of their modification and how well they thought they had tested the spreadsheet. The modification self-rating asked them to rate on a 1 ("not confident") to 5 ("very confident") scale how confident they were that each of the modification subtasks (tax rate, adding spaghetti, new worker) had been completed correctly. Since few subjects made errors in the tax rate and new worker subtasks, we compared only the spaghetti subtask ratings with their spaghetti modification scores. Although Table 4 shows that the regression coefficients (self-rating) for the Ad Hoc and Tools groups were not significantly different from 0, it does indicate that the self-rating is a modest predictor for the Tools group but has no predictive value for the Ad Hoc group. Spaghetti Regression Standard t-value Significance Modification Coefficient Error Ad Hoc -0.167 0.536 -0.311 0.7602 Tools 0.282 0.363 0.776 0.4482 Table 4: Regression analysis for spaghetti modification subtask. The post session questionnaires also asked subjects to rate "on a familiar A-F scale" how well they tested their spreadsheet. In spite of the dramatic and significant difference between the number of Tools subjects who executed at least one test compared to the number of Ad Hoc subjects who executed at least one test, the Ad Hoc subjects' average testing self-rating [Table 5] was higher than the tools subjects' average selfrating (Mann-Whitney p=0.1095). Group Tested Self-Rating Ad Hoc 3.353 (.931) Tools 3.000 (.667) Table 5: Average testing self-rating (A=4, B=3, C=2, D=1, F=0)
5. DISCUSSION The strong results from the experiment showed that the subjects receiving the visual testedness and change impact feedback provided by the WYSIWYT methodology were greatly aided and encouraged by it, especially in their testing. One question for which we only have a partial answer is: which portions of the visual feedback were most helpful? To help us begin to answer this question, the Tools group version of the post-problem questionnaire asked the subjects to rank the helpfulness of each of the feedback devices as very helpful, quite helpful, helpful, somewhat helpful or not helpful. The results, summarized in Table 6, indicate that the subjects found the cell border colors, arrows and percent tested indicator most helpful, checkmarks, exclamation point, and blanks less helpful, and question marks, least helpful.
8
How helpful were:
Helpful - Very Somewhat Helpful Helpful or Not Helpful colored cell border 90% 10% arrows 90% 10% "Tested" indicator 84% 16% checkmarks 78% 22% exclamation 78% 22% blanks 77% 23% question marks 72% 28% Table 6: Tools subjects' helpfulness ratings
Two-thirds of our subjects' spreadsheets contained errors after the modification was completed (71% for Ad Hoc, 63% for Tools). This error rate seemed high for a simple task and made us wonder how it compared with error rates in other experiments. Panko's [15] survey of studies on spreadsheet errors included 12 experiments in which the subjects developed spreadsheets. The error rates in those experiments ranged from 35%-84%. Further, subjects in most of those experiments were business students and they were given hours and in some instances days to complete the development task. Hence, the error rate for our subjects fell into this range even though we gave them only 15 minutes to complete the task. Based on the scores for the three modification subtasks (change tax rate, adding spaghetti for February and March, and adding an additional worker for February and March), the spaghetti modification was the most difficult (Table 2). A plausible reason for this is that the spaghetti changes are "global" (dependent on other cells) while the other two modifications are "local" (independent of other cells). The tax rate change involved changing the rate in the cell formula from 25% to 28% for each month and the addition of a worker change involved adding $1000 to the salaries formulas for February and March. In both cases, the changes did not depend on or use information from another cell. However, for the spaghetti modification subtask, changes to the revenue, expenses, and pretax cell formulas depended on other cells. By far the most common mistake in this modification was not correctly computing the pretax totals for February and March. Pretax errors accounted for more than half of the errors made by the Ad Hoc subjects and over 40% of the errors made by the Tools subjects. It would seem that the dependency of the pretax for February and March on the correctness of both the new total revenue and new total expenses might account for such a high error rate.
6.THREATS TO VALIDITY In this experiment, we addressed the threats to internal validity by balancing the two groups of subjects based on their year in school and their GPAs, by equalizing their training time, and by selecting an experimental problem from a domain which the subjects were familiar with. However, threats to external validity are more difficult to address, given the need to control all other factors. For example, business students represent only a fraction of the spreadsheet programmer population. Similarly, the spreadsheet used in the experiment may not be representative of the population of spreadsheets. Since the main focus of the study was a modification task and testing, the original spreadsheet did not contain any errors. This may be unrealistic as the spreadsheets encountered in a real life situation may contain some errors. However, including errors in the spreadsheet would have confounded the data about modification and testing effectiveness, as the subjects would not be focused on the actual experimental task of modifying and testing the spreadsheet. Moreover, there was an opportunity for the subjects to introduce errors into the spreadsheet by themselves during their modification task. We wanted to see if the subjects could catch such errors with the help of our WYSIWYT methodology. For scoring purposes, the modification task was broken into abstract subtasks, such as the new total expenses includes the cost of spaghetti ingredients and an additional worker, without specifying exactly how these should be done. Modification accuracy was measured by scores for each of the abstract subtasks. Testing effectiveness was measured by whether or not tests were executed. An alternative measure of testing effectiveness could be du-adequacy. However, du-adequacy was not used because the subjects did the modification task in different ways, with some subjects creating more new cells or changing more cells than other subjects. Hence the resulting student programs contained different numbers of du-associations.
9
7. CONCLUSIONS In this paper we reported empirical results about a methodology aimed at improving the maintainability of spreadsheet programs. The major results were: 1. Subjects using the WYSIWYT methodology were more accurate in a modification task. 2. Subjects using the WYSIWYT methodology were significantly more effective in testing. The methodology encouraged subjects to test their programs after making changes. Most of the subjects without the methodology did no testing. 3. Subjects using the WYSIWYT methodology were better able to predict the accuracy of their modification and were less overconfident about how well they had tested their programs. Further, it was possible for the subjects using the WYSIWYT methodology to achieve these benefits even without training in the theory of the underlying test adequacy criterion and its relationship to the visual devices. This is encouraging because it suggests that it is possible for end-users with little or no programming experience to achieve some of the benefits of the formal theory without training in the testing principles behind our methodology. This is the first empirical study of spreadsheet language program maintenance. Although no accurate figures are available, given the extensive use of commercial spreadsheets by the business and other communities, it is safe to say that spreadsheet maintenance is a common and important task. Therefore it is surprising that software engineering research has to a large extent ignored this area. That many of the spreadsheet programs are developed by end-users who have little or no programming experience and who cannot be expected to become fluent in software engineering methodology makes this an especially challenging area of research. The tools and techniques for spreadsheet programmers must be accessible to someone without a software engineering background. Our study has demonstrated one promising approach that could serve as a stepping stone for future research.
8. REFERENCES [1] A. Ambler, M. Burnett, and B. Zimmerman, "Operational versus definitional: A perspective on programming paradigms", Computer, 25(9):28-43, Sept. 1992. [2] P. Brown and J. Gould, "Experimental study of people creating spreadsheets", ACM Trans. Office Info. Sys., 5(3):258-272, July 1987. [3] M. Burnett and H. Gottfried, "Graphical definitions: Expanding spreadsheet languages through direct manipulation and gestures", ACM Trans. Computer Human Interaction, pages 1-33, Mar. 1998. [4] E. H. Chi, P. Barry, J. Riedl, and J. Konstan, "A spreadsheet approach to information visualization", In IEEE Symp. Info. Visualization, Oct. 1997. [5] J. S. Davis, "Tools for spreadsheet auditing", Intl. J. of Human-Computer Studies, 45:429-442, 1996. [6] E. Duesterwald, R. Gupta, and M. L. Soffa, "Rigorous data flow testing through output influences", In Proc. 2nd Irvine Softw. Symp., Mar. 1992. [7] P. Frankl and S. Weiss, "An experimental comparison of the effectiveness of branch testing and data flow testing", IEEE Trans. Softw. Eng., 19(8):774-787, Aug. 1993. [8] P. Frankl and E. Weyuker, "An applicable family of data flow criteria", IEEE Trans. Softw. Eng., 14(10):1483-1498, Oct. 1988. [9] M. Hutchins, H. Foster, T. Goradia, and T. Ostrand, "Experiments on the effectiveness of dataflow and control flow-based test adequacy criteria", In 16th Intl. Conf. Softw. Eng., pages 191-200, May 1994. [10] V. Krishna, C. Cook, D. Keller, J. Cantrell, C. Wallace, M. Burnett, G. Rothermel, "Empirical Study of a Spreadsheet Maintenance Task", Technical Report, Oregon State University, (In preparation). [11] J. Leopold and A. Ambler, "Keyboardless visual programming using voice, handwriting, and gesture", IE Syn 1997 IEEmp. Vis. Lang., pages 28-35, Sept. 1997. [12] M. Marre and A. Bertolino, "Reducing and estimating the cost of test coverage criteria", In 1996 IEEE 18th Intl. Conf. Softw. Eng., pages 486-494, Mar. 1996. [13] B. Myers, "Graphical techniques in a spreadsheet for specifying user interfaces", In ACM CHI '91, pages 243-249, Apr. 1991. [14] R. Panko, "Finding spreadsheet errors: Most spreadsheet models have design flaws that may lead to long-term miscalculations", Information Week, pg. 100, May 29, 1995. [15] R. Panko, "What we know about spreadsheet errors", J. End User Comp., pages 15-21, Spring 1998.
10
[16] R. Panko and R. Halverson Jr., "Spreadsheets on trial: A framework for research on spreadsheet risks", th 29 Hawaii Intl. Conf . on System Sciences, Vol. II, pages 326-335, Jan. 1996. [17] K. Rajalingham, D. Chadwick, B. Knight and D. Edwards, "An integrated spreadsheet engineering methodology", IFIP TC11 WG11.5 Third Working Conf. on Integrity and Internal Control in Info. Systems, pages 41-58, Nov. 1999. [18] S. Rapps and E. J. Weyuker, "Selecting software test data using data flow information", IEEE Trans. Softw. Eng., 11(4):367-375, Apr. 1985. [19] J, Reichwein, G. Rothermel, and M. Burnett, "Slicing spreadsheets: An integrated methodology for nd spreadsheet testing and debugging", 2 Conf. on Domain Specific Languages, pages 25-38, Oct. 1999 [20] K. Rothermel , C. Cook, M. Burnett, J. Schonfeld, T.R.G. Green, and G. Rothermel. "WYSIWYT nd testing in the spreadsheet paradigm: An empirical evaluation", 22 Intl. Conf. on Softw. Eng., Limerick, pp. 230-239, June 2000. [21] G. Rothermel, M. Burnett, L. Li, C. DuPuis, A. Sheretov, " A methodology for testing spreadsheets", ACM Trans. on Softw. Eng. and Methodology, (to appear). [22] G. Rothermel, L. Li, C. DuPuis, and M. Burnett, "What you see is what you test: A methodology for testing form-based visual programs", In The 20th Intl. Conf. Softw. Eng., pages 198-207, Apr. 1998. [23] T. Smedley, P. Cox, and S. Byrne, "Expanding the utility of spreadsheets through the integration of visual programming and user interface objects", In Adv. Vis. Int. '96, May 1996. [24] G. Viehstaedt and A. Ambler, "Visual representation and manipulation of matrices", Journal Vis. Lang. and Comp., 3(3):273-298, Sept. 1992. [25] E. J. Weyuker, "More experience with dataflow testing", IEEE Trans. Softw. Eng., 19(9): 912-919, Sept. 1993. [26] E. Wilcox, J. Atwood, M. Burnett, J. Cadiz, and C. Cook, "Does continuous visual feedback aid debugging in direct-manipulation programming systems", In ACM CHI'97, pages 258-265, Mar. 1997.
11