KSCE Journal of Civil Engineering (2011) 15(7):1289-1297 DOI 10.1007/s12205-011-1166-0
Water Engineering
www.springer.com/12205
Incorporating Uncertainty and Objective Load Reduction Allocation into the Total Maximum Daily Load Process in Korea Eun-Sung Chung*, Kyung-Tae Kim**, Kil Seong Lee***, and Steven J. Burian**** Received March 15, 2010/Accepted December 6, 2010
···································································································································································································································
Abstract This paper presents advancements to the approach for Total Maximum Daily Load (TMDL) development in Korea. The current Korean TMDL process does not directly consider uncertainty and it does not include an objective approach to allocate pollutant load reductions. This paper develops a methodology to address uncertainty by incorporating a margin of safety (MOS) based on three approaches: judgment, standard error of loading characteristics, and uncertainty and variability of loading characteristics. In addition, three pollutant load reduction allocation approaches are compared to assess their impact: equal load, equal percent, and equity standard reductions. These two proposed additions to the TMDL process in Korea are demonstrated for a BOD TMDL development in the Anyangcheon Watershed. The results confirm the importance of incorporating uncertainty into the TMDL process and clearly illustrate the significant differences in TMDL and load allocation produced when using different approaches to estimate the MOS. Further, the comparison of the three load allocation strategies highlights the potential limitations of equal load and equal percent reduction approaches. The use of technical expert and decision maker ranking of factors create an equitable and sustainable load allocation among the sub-watersheds. It can be concluded that incorporating uncertainty and providing an objective load allocation strategy are essential elements needed for future TMDL development in Korea. Keywords: total maximum daily load, load allocation, uncertainty, water quality ···································································································································································································································
1. Introduction Rapid urbanization in Korea has significantly degraded water quality. National efforts have been directed towards establishing point source controls at several locations including wastewater treatment facilities. However, water quality has not improved substantially and attention has expanded to include control of nonpoint source pollution in watershed management efforts (Kim and Yi, 2006; Jung et al., 2008). In 1999, the Korea Ministry of Environment (MOE) focused attention on the Han, Nakdong, Geum, and Yeongsan/Sumjin Rivers, four major rivers providing municipal and industrial water needs for nearly 80% of the population of Korea. The Korean government followed with the establishment of the Comprehensive Measures for Nonpoint Source Pollution Management in 2004, with the goal to protect the four major rivers and develop an approach to protect all rivers in Korea. One of the major components of this effort was the implementation of a Total Maximum Daily Load (TMDL) program as a means of developing fair and effective watershed protection strategies. The guidelines for the Korean TMDL program established by the National Institute of Environmental
Research includes steps similar to those performed in other countries (MOE, 2003): (1) select watershed of impaired water body, (2) identify water quantity and quality targets, (3) delineate sub-watersheds contributing to the impaired water body, (4) compute point and nonpoint pollutant loading, (5) determine TMDL, (6) develop load allocation reduction strategy. Biochemical oxygen demand (BOD) has been and continues to be the focus of water quality management efforts in Korea, although in the near future TMDL development is likely to expand to include nutrients (i.e., total nitrogen and total phosphorus). There exist established programs leading to the development of BOD TMDLs for four major rivers, but observations show BOD concentrations are consistently above 10.0 mg/L. As part of the Comprehensive Measures for Non-point Source Pollution Management actions, pilot projects have been established for nonpoint source (NPS) pollution control (Jung et al., 2008). Results from these pilot projects will guide the second phase - implementing NPS best management practices (BMPs) at the watershed scale. This is expected to lead to the third phase of the effort – nationwide implementation of NPS controls. Despite the water quality management efforts and implementa-
*Member, Assistant Professor, School of Civil Engineering, Seoul National University of Science and Technology, Seoul, 139-743, Korea (Corresponding Author, E-mail:
[email protected]) **Water Resources Division, Kunhwa Consulting and Engineering Co., LTD, Seoul, Korea (E-mail:
[email protected]) ***Member, Professor, Civil & Environmental Engineering, Seoul National University, Seoul 151-742, Korea (E-mail:
[email protected]) ****Associate Professor, Civil & Environmental Engineering, University of Utah, Salt Lake City, UT 84112, USA (E-mail:
[email protected]) − 1289 −
Eun-Sung Chung, Kyung-Tae Kim, Kil Seong Lee, and Steven J. Burian
tion of the initial TMDL program, water quality problems persist in Korea. Recently, four key problems were identified (Kim and Yi, 2006): 1. Uncertainty of data, methods, models, and model inputs, 2. Target discharge insufficient to satisfy water quality standard, 3. NPS unit load of generation does not consider regional runoff characteristics, 4. Lack of objective pollutant load reduction allocation approach. Similar problems are being faced in other countries. In the United States (US), for example, regulations governing the TMDL program were first issued in 1992, and the U.S. Environmental Protection Agency (USEPA) continues to advance the program. Of the four identified problems, the issue of uncertainty has received considerable attention in the US. Federal guidelines were recently implemented to require consideration of variability and uncertainty in the development of TMDLs (USEPA, 1999). One suggestion to address uncertainty has been to include a margin of safety (MOS) (Chen et al., 1999). Implicit approaches embed an MOS into one or more conservative assumptions in supporting analysis (e.g. estimation of ungauged loads or model coefficients) (Walker, 2003). If the MOS is not quantified, there is some risk that the resulting load control programs would be overdesigned (resulting in unnecessary regulation and expense) or under-designed (having a low probability of meeting objectives). If the MOS is explicitly quantified, control measures will generally be over-designed sufficiently to achieve the specified goals with a specified confidence level (Borsuk et al., 2002). In particular, integration of model uncertainty and data variability into the definition of the MOS has been pointed out by Reckhow (2003), Dilks and Freedman (2004), Zhang and Yu (2004), Labiosa et al. (2005) and Franceschini and Christina (2008). Although uncertainty is being addressed in other countries and uncertainty of low flow estimation has been occasionally studied in Korea (Kim and Lee, 2010), it remains a missing part of the Korea TMDL program. The objective of this paper is to address this gap by presenting an approach to incorporate uncertainty. In addition, three load reduction strategies are tested to identify an equitable approach for use in TMDL development in Korea. The approach to address uncertainty follows from the MOS concept described by Walker (2003), while the load reduction allocation strategy is based on the equitable allocation principle of international water law (Gleick, 1994; UN, 1997; Mimi and Sawakhi, 2003). The new approaches are demonstrated with a BOD TMDL case study in the Anyangcheon Watershed in Korea.
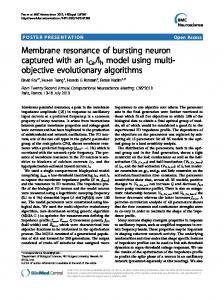
2. Methodology This paper introduces two advances to the approach used in Korea to develop TMDLs. The relations between these topics and the general TMDL process are shown in Fig. 1. Currently the TMDL for any water body in Korea is determined by summing the long-term average external loads:
Fig. 1. TMDL Development Process
TMDL = ΣLA + ΣWLA + B
(1)
where ΣLA is the sum of load allocations (nonpoint sources, above background) (kg/year); ΣWLA is the sum of waste load allocations (point sources) (kg/year); and B is the background load (natural sources) (kg/year). This formulation as implemented in Korea is missing two elements: (1) a component to account for uncertainty and (2) an objective load allocation reduction strategy (Kim and Yi, 2006). The following two subsections describe proposed methods to address these two needs. 2.1 Margin of Safety (MOS) To account for uncertainty, we propose TMDLs in Korea follow the USEPA (1999) approach and include a MOS term: TMDL = ΣLA + ΣWLA + B + MOS
(2)
where MOS = margin of safety (kg/year). Estimating the MOS may be accomplished with several different approaches. For this study, three approaches are applied: (1) simple factor, (2) standard error, and (3) uncertainty and variability. The simple factor is applied by multiplying a specified percentage by the TMDL to determine the magnitude of the MOS. A baseline factor of 10% was selected for this study based on its use in previous TMDL studies (NYCDEP, 1999). The standard error approach involves computing the standard error of the loading for each sub-watershed (NYCDEP, 1999). The standard error is then used to linearly interpolate between values of 1.0 and 3.0 to identify the MOS which will range from 10% to 20%. In cases where the standard error is less than 1.0 mg/L or greater than 3.0 mg/L the MOS will be set at 10% and 20% respectively. This relationship can be systemized as follows: MOS = ⎧ 10% if S.E. < 1.0 mg/L ⎪ ⎨ [ 0.10 + { 0.05 × ( S.E. – 1 ) } ] × 100 if ( 1.0 mg/L ≤ S.E. < 3.0 mg/L ) ⎪ if ( S.E. ≥ 3.0 mg/L ) ⎩ 20% (3)
− 1290 −
KSCE Journal of Civil Engineering
Incorporating Uncertainty and Objective Load Reduction Allocation into the Total Maximum Daily Load Process in Korea
MOS = TMDL ( 1 – FV FU )
The third approach to compute the MOS is based on representing uncertainty and variability. To distinguish between uncertainty and variability, Walker (2003) divided the MOS into two components: MOS = MOU + MOV
(4)
where MOU = margin of uncertainty (kg/year) and MOV = margin of variability (kg/year). For a given TMDL, increasing the MOV will reduce the expected load (point and nonpoint) and increase the “compliance rate” or frequency of meeting a given numeric goal. Increasing the MOU will increase the “confidence level”, or probability of meeting the goal at the desired frequency. The compliance rate and confidence level assumed in formulating the TMDL may be a water body-specific policy decision and/or determined by regulations. Walker (2003) demonstrated that these factors are at least as important as the selection of a numeric goal in determining the load allocation. The MOS, MOV, and MOU consistent with a given compliance rate (β) and confidence level (α) can be estimated by attaching stochastic terms to the TMDL mass balance (Walker 2003). Random year-to-year variations in concentrations are drawn from a lognormal distribution with a coefficient of variation SV. If sufficient time series data are available, an alternative approach would be to model year-to-year variations deterministically. Uncertainty in the predicted concentration under a given loading regime is modeled by attaching another lognormal deviate to the pollutant balance with a coefficient of variation SU. The TMDL represents the long-term-average load consistent with a compliance rate of 50% and confidence level of 50%. To meet the specified target at the specified compliance rate (β ) with a confidence level (α ), the allocated long-term-average load (LA) would have to be reduced as follows (Walker 2003): *
LA = ( Q + KA )P FV FU = FV FU TMDL
(5)
FV = exp ( –Zβ SV )
(6)
FU = exp ( –Zα SU )
(7)
where LA = allocated long-term-average load = TMDL – MOS (kg/year); Q = long-term-average lake outflow (hm3/year); P* = Lake P target (hm3/year); A = lake surface area (km2); FV = factor accounting for year-to-year variability in concentration; SV = year-to-year coefficient of variation (CV) of concentration; FU = factor accounting for uncertainty in the predicted average concentration; SU = model error CV for predicted average concentration; Zβ = value of standard normal variate with upper tail probability β ; Zα = value of standard normal variate with upper tail probability α ; β = assumed compliance rate = fraction of years with concentration < target concentration; and α = assumed confidence level = probable concentration < target concentration at specified β . By combining the above equations, the MOS, MOU, and MOV can be explicitly quantified as follows (Walker, 2003): LA = TMDL – MOS = FVFU TMDL Vol. 15, No. 7 / September 2011
(8)
(9)
MOU = MOS ( 1 – FU ) ⁄ ( 2 – FU – FV )
(10)
MOV = MOS – MOU
(11)
2.2 Pollutant Load Reduction Allocation Schemes The most commonly used TMDL pollutant load reduction allocation methods have been equal percent removal and equal effluent concentrations (Chadderton et al., 1981). The equal percent removal approach can be applied in two ways: the overall removal efficiencies of each pollutant source must be equal. The equal effluent concentration approach also can be applied in two general ways - equal final concentrations or equal incremental concentration reductions. This method is similar to the equal percent removal method if influent concentrations at all sources are approximately the same. However if one point source has substantially higher influent levels, requiring equal effluent concentrations will result in higher overall treatment levels for that source than the equal percent removal approach. The optimal allocation outcome can be written as Xj* = (X 1*, * X 2 , ..., X n*) and can be defined as the one that minimizes the square of the summation of the distances (d) measured outward from itself to all equity standards. In this study, X *j means the entitlements of the j-th sub-watershed from the all loads (%). The objective function was derived (Eq. (12)) to satisfy the above stated criterion (minimizes the square of the summation of the distances). The mathematics of the objective function considered the weight of the equity factors. min d =
m
n
i=1
j=1
∑ wi ∑ ( Xij – Xj* )2
(12)
where i: 1, …, m, refers to the equity standards. j: 1, …, n, refers to the sub-watersheds. d: square of the summation of the distances between the allocation outcome and the equity standards. wi: the weight of the i-th equity factor (%) Xij: the share of the i-th equity factor for the j-th subwatershed (%). To find the optimal allocation outcome from the set of possible allocation outcomes where the objective function has its smallest value (i.e. to optimize Eq. (12)), requires finding the point where the first derivative of the equation equals zero ( ∂d ⁄ ∂Xj* = 0 ). This leads to Eq. (13), which is the optimal solution of Eq. (12). m
∑ wiXij
=1 Xj* = i----------------m ∑ wi
(13)
i=1
Applying Eq. (13) to a selected watershed, the optimal allocation outcome specifies the proportional pollutants loads allocated to the sub-watersheds.
− 1291 −
Eun-Sung Chung, Kyung-Tae Kim, Kil Seong Lee, and Steven J. Burian
3. Case Study The two proposed additions to the TMDL process in Korea are tested with an application to the Anyangcheon Watershed (Fig. 2). A BOD TMDL was developed based on a target concentration of 10.0 mg/l in the Anyangcheon River established by the Korean MOE. The target concentration is multiplied by Q275 (75 percentile of flow duration curve) and Q355 (97 percentile of flow duration curve) to determine two TMDL magnitudes, one associated with the existing use of Q275 and a second for a proposed new flow standard. To determine the loads from each subwatershed an HSPF model was created and long-term simulations were performed. Descriptions of the Anyangcheon Watershed and the TMDL development process are presented in the next sub-sections. 3.1 Anyangcheon Watershed Description The Anyangcheon Watershed in central Korea near the capital city of Seoul is selected for this study because the Anyangcheon River has been observed to have a serious water quality problem producing fish kills on occasion. In addition, it is a first-order tributary of the Han River (Fig. 2), a river being targeted for TMDL development in Korea. The Anyangcheon River main channel length is 32.38 km, draining a watershed area of 287 km2, containing 3.88 million people (population density ~13,500 persons/km2). The watershed land cover (as of 2000) is 43% urbanized, 40% forest and 13% agricultural. Based on topography, the natural stream network, and the storm drainage network, the
Fig. 2. Map of the Anyangcheon Watershed used in this Study
watershed is divided into 11 sub-watersheds shown in Fig. 2: OJ, WG, DJ, SB (upstream), HU, SA, SB1, SS (middle-stream), SH, MG, DR (downstream). From 1972 to 2001, the average annual precipitation was 1,325 mm, with 927 mm (70%) occurring during the monsoon months of June through September. But, from 2002 to 2006, the average annual precipitation increased to 1,468 mm, with 1,086 (74%) occurring during the monsoon months. On average, approximately 57% of the precipitation input to the Anyangcheon Watershed is discharged as direct runoff and approximately 5% of the precipitation is discharged as baseflow (Lee et al., 2007). BOD concentrations have not been observed, but modeling studies have estimated the concentration to be approximately 15.0 mg/L and the daily load to be 21,852 kg/day (354 kg/ha/yr) (Chung and Lee, 2009). 3.2 HSPF Model Formulation Models are commonly used to simulate pollutant loading and resulting concentrations in water bodies for TMDL studies when observed data are insufficient or unavailable (which is the usual case). Models are essential tools to determine the allowable load for receiving waters with complex interactions among different pollution sources and to allocate pollutant loads among the identified point and nonpoint pollution sources (Santhi et al., 2001; DePinto et al., 2004). Moreover, the information provided by models is useful for preliminary evaluation of water quality, ranking, and targeting load reduction strategies. Novotny (1999) pointed out the need to integrated loading capacity models to the probability of exceeding the water quality standards. For this study, the Hydrologic Simulation Program – Fortran (HSPF) (Bicknell et al., 2001) was used to estimate BOD loads from the 11 sub-watersheds in the Anyangcheon Watershed. HSPF is a deterministic, lumped-parameter continuous simulation model that has evolved from the Stanford Watershed Model, the USEPA Agricultural Runoff Management (ARM) model, and Non-Point Source (NPS) model. HSPF requires physical (topographic and land use) and climate data to parameterize methods and provide input variables. In addition, streamflow and possibly water quality data are required for calibration and validation. A 1:25000 digital elevation model (DEM) and land use map (year 2000) of the study area were obtained from the National Geographic Information Institute (NGII) of the Ministry of Land and Ocean (MOLO) in Korea. The study area is located between the Suwon and Seoul stations of the Korea Meteorological Administration (KMA). Both stations provided daily (1993~2005) precipitation, temperature, average wind speed, average humidity, and average solar radiation data. Finally, streamflow quantity and quality were obtained from more than 100 field measurements during a four-year period (2003~2006) (Lee, 2007) and those of ministry of environment of Korea (http://water.nier.go.kr/weis). HSPF model in this study was already formulated and validated to the Anyangchen watershed in Chung and Lee (2009) and Chung et al. (2011). The HSPF model of the Anyangcheon Watershed was subjected to a sensitivity analysis. The parameters suggested by AQUA
− 1292 −
KSCE Journal of Civil Engineering
Incorporating Uncertainty and Objective Load Reduction Allocation into the Total Maximum Daily Load Process in Korea
TERRA (2004) were individually incrementally adjusted and the impact of the changes on total runoff volume, peak discharge, total BOD load, and peak BOD concentration were quantified. Of the water quantity parameters, those with an impact greater than 1% of total runoff volume and peak discharge were LZSN, UZSN, INFILT, INTFW, IRC, and AGWRC. Of the water quality parameters, those with an impact greater than 1% of total BOD load and peak BOD were KODSET, TCBOD, and KBOD20. The detailed descriptions and their ranges of all parameters are shown in Chung et al. (2010). The HSPF model was calibrated by adjusting the nine parameters identified as important in the sensitivity analysis. A trialand-error method with split samples was used to maximize the model efficiency and minimize the root mean square error (RMSE) for the water quality results. Since the study watershed covers an impractically large area for complete calibration, the calibration was performed for five areas. The periods of performance, the model efficiencies, and the RMSE resulting from the calibration and validation were shown in Chung and Lee (2009) and Kim et al. (2009). A decision had to be made during the design phase on whether to use site-specific observations or regional/national averages and literature values to estimate BOD unit loads used in the model. In general, unit loads for TMDL in Korea are based on national averages. This is known to be problematic because sitespecific runoff characteristics are ignored. The preliminary HSPF estimates of pollutant load using both general (based on national averages) pollutant loads and measurements are shown in Table 1. The national averages are taken from the Han River, a representative large river basin. Since the study watershed has a high urban area ratio (about 43%), the unit load is expected to be high. Therefore, without adequate site-specific data the higher unit load based on measurements is selected for this study. The verified HSPF model was applied at a daily time step to compute the quantities of runoff volume, evapotranspiration, infiltration, baseflow, deep percolation, changes in storage, and BOD loading for the 11 sub-watersheds. 3.3 Pollutant Load Reduction Allocation The approach presented here provides one possible solution to the problem of objectively allocating the required load reduction among governments, agencies, industries, and other stakeholders affiliated with contributing subwatersheds. The approach translates the principle of equitable utilization into a set of procedures to determine the riparian entitlements to the shared waters. After discussion among experts including water resources researchers, Table 1. Comparison of Measured and General BOD Unit Loads (kg/day) Classification
General unit load
Measured unit load
Discharged load
15,754
22,125
Loading capacity
11,512
11,512
Load reduction
4,242
10,613
Vol. 15, No. 7 / September 2011
hydrologists, environmentalists, and local governmental officials, five factors were selected as important to include in a load allocation strategy. The five factors are urban area ratio, outflow, water consumption, population, and annual budget. The factors were analyzed to verify they are closely related to the total daily loads. All of the correlation coefficients calculated are over 0.8. 3.3.1 Factor I – Urban Area Ratio (Correlation coeff. = 0.915) The sub-watersheds of the study area have a high rate of urban area ratio growth that is likely to cause freshwater conflicts in the future. A much higher urban area ratio level will inevitably require high stream water quality which might exacerbate tensions for clean water in the region. 3.3.2 Factor II – Discharged Load (Correlation coeff. = 0.883) The discharged load is the most important factor to improve water quality. Sub-watersheds contributing higher fractions of the load will usually be required to provide more effort towards water quality management. 3.3.3 Factor III – Water Consumption (Correlation coeff. = 0.898) The sub-watersheds of the study area have a high rate of water consumption growth that is likely to lead to conflicts in the future. 3.3.4 Factor IV – Population (Correlation coeff. = 0.904) The sub-watersheds of the study area have a high rate of population growth that is likely to contribute to freshwater conflicts in the future. Increased populations will inevitably have the higher impact potential and thus require greater attention to prevent water tensions in the region. 3.3.5 Factor V – Financial Resources (Correlation coeff. = 0.955) In general, the sub-watersheds having more financial resources can afford to invest more to protect the stream environment. It could be argued that some of the equity factors should be given greater prominence when determining states’ entitlements. But the process to select the key factors is not standardized and typically is strongly influenced by factors beyond engineering and science (e.g., politics). To facilitate the development of a realistic weight for each factor, a questionnaire was designed and sent to thirty water experts from the fourteen riparian local governments. The water experts who work in water institutions, universities and non-governmental organizations included professional economists, irrigation engineers, and water resources engineers. The questionnaire summarized international water law, the problem and the approach of the research. The main task for the experts was to assign a weight for each of the five equity factors (the summation of all weights should be one), this study used the average weight for each equity factor obtained from the collected answered questionnaires. The calculated values are 0.24 (urban area ratio), 0.38 (discharge load), 0.06 (water con-
− 1293 −
Eun-Sung Chung, Kyung-Tae Kim, Kil Seong Lee, and Steven J. Burian
sumption), 0.21 (population), and 0.11 (financial resources).
4. Results The TMDL was first determined using Eq. (1) and then the MOS was determined to adjust the TMDL. As mentioned above, TMDLs in Korea are currently determined for Q275, but it was suggested that Q355 should be used (Lee and Chung, 2007). To be comprehensive, this study was performed for both targets. The initially estimated TMDL based on Q275 is 2,352 kg/day and based on Q355 is 1,728 kg/day. 4.1 Margin of Safety As described earlier, three methods to estimate the MOS were used in this study: simple percentage factor, standard error, and uncertainty and variability. The simple percentage factor applied is 10%. The standard error and MOS were determined using Eq. (3) and available observations. MOV and MOU were determined using the measured data from MOE combined with the HSPF simulation results. The compliance rate (probability to satisfy the target quality) was assumed to be 80%. If the compliance rate is high, the possibility to improve the water quality becomes high, but the load reduction of each region will be large. Due to the same reason, the confidence level was assumed as 90%. Table 2 displays the parameters used in the calculations to determine the MOS. Table 3 shows the variability of the MOV, MOU, and MOS to changes in α and β . Increasing the confidence level and the compliance rate causes the MOS to increase. It is important to note the MOV is relatively independent to changes in confidence level, while the MOU is relatively independent to changes in compliance rate. Three MOS values selected for this study are 10%, 11.6%, and 43.8%. We used the case of α = 90% and β = 80%. We determined β = 80% because the target compliance rate of MOE is 75%. α = 90% is the general confidence rate since MOS follows the normal distribution (Walker, 2003). Clearly,
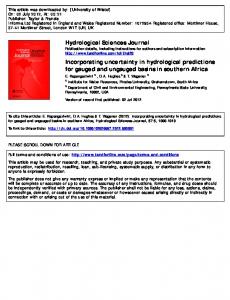
there are significant differences among the three methods. If the standard error (based on observations) is considered, the MOS is 11.6% compared to the arbitrarily selected 10%. And if the variability and uncertainty are considered the MOS is substantially increased to 43.8% which consists of 27.2% of uncertainty and 16.6% of variability (Kim et al., 2010). 4.2 Load Capacity and Load Reduction TMDLs and load reduction values using each of the three approaches to estimate the MOS are shown in Fig. 3. Also shown in the table is the difference in discharge load produced using the BOD unit load based on national averages and measurements. In general, as the MOS increases the TMDL decreases and in turn the required load reduction increases. The values produced by the arbitrarily selected MOS (10%) and the MOS
Fig. 3. Pollutant Loading, TMDL, and Load Reduction Based on Different Target Flows and Methods to Estimate the BOD Unit Loads in HSPF.
Table 2. Summary of Parameters Used to Determine Margin of Safety (MOS) Values Compliance rate, β
Inverse cdf of standard normal distribution Zβ
50%
-1.4E-16
1
80%
0.842
0.812
Confidence level, α
Coefficient of variation, SV
FV
0.247
Inverse cdf of standard normal distribution Zα
FL
50%
-1.4E-16
1
90%
1.282
0.692
Coefficient of variation, SV SL
SL
FV
0.287
0.209
0.197
Table 3. Sensitivity of MOS to Changes in α and β
β = 60%
Compliance rate
β = 70%
(unit: %)
β = 80%
β = 90%
Confidence level
MOS
MOU
MOV
MOS
MOU
MOV
MOS
MOU
MOV
MOS
MOU
α = 60% α = 70% α = 80% α = 90%
12.7
6.8
5.9
18.3
6.7
11.6
24.5
6.7
17.8
32.2
6.6
25.6
19.2
13.4
5.8
24.4
13.1
11.4
30.1
12.9
17.3
37.3
12.7
24.6
26.2
20.4
5.8
31.0
19.8
11.2
36.2
19.3
16.9
42.8
18.9
23.9
35.0
29.2
5.8
39.2
28.1
11.1
43.8
27.2
16.6
49.6
26.3
23.2
− 1294 −
MOV
KSCE Journal of Civil Engineering
Incorporating Uncertainty and Objective Load Reduction Allocation into the Total Maximum Daily Load Process in Korea
based on Standard Error (11.6%) are nearly the same. Incorporating uncertainty and variability into the MOS substantially decreases the TMDL and increases the necessary load reduction. The drought flow (Q355) reduces the loading capacity by 8% compared to the low flow (Q275). The TMDL and load reduction differences between low flow and drought flow are overall less important for this case study than the MOS method. Overall the loading capacity and reduction results indicate the importance of uncertainty in the results and the need to include them to provide the greatest chance of achieving water quality management goals. 4.3 Pollutant Load Reduction Allocation Returning to the five alternative equity standards, there is no manifestly ‘best’ division of waters; the standards do not converge on any one particular allocation outcome. The task, then, was to identify the outcome which did the ‘least upset’ to the five equity standards taken together (i.e. to distinguish an optimal allocation outcome which, while not necessarily the best when measured against each equity standard in isolation, was the least worst of all outcomes when all five standards were taken equally into account). The results of three allocation methods are shown in Table 4. It is important to note the problems associated with the equal load allocation approach, which caused some subwatersheds (e.g., WG, OJ) to be assigned unreasonable 100% load reduction requirements. In fact, the smaller load contributors are all required to achieve nearly 100% load reduction. The equal percent removal approach by definition will create more proportional load reduction requirements among the sub-watersheds as is observed in Table 4. The allocation strategy based on equity standards seems to provide a balance between the unreasonable equal load reduction and the overly proportional equal percent reduction approach. The largest load contributors (MG and DR)
are required to meet a higher load reduction than it is required in the equal load reduction approach, but they must not carry an unreasonably high load reduction compared to all sub-watersheds as would be required under the equal percent reduction approach. Interestingly the equity standards allocation requires sub-watershed HU to reduce loads completely. Overall, the allocation approach based on equity standards is shown to provide a means to incorporate factors deemed important by technical experts and decision makers to achieve a fair and sustainable solution. To check the acceptability of the allocation based on the equity standards, HSPF was used to simulate the pollutant loading under the proposed allocation strategy. It is found that the pollutant concentrations at the outlet are satisfactory (under 10 mg/L) using 2004-2006 data. The previous BOD concentration was 11.21 mg/L, but it will be 7.39 mg/L after TMDL implementation. This allocation would be satisfied at the outlets of the individual sub-watersheds as well as at the outlet of the study watershed.
5. Conclusions This paper presented two new additions to the TMDL development approach used in Korea. Firstly, three methods to incorporate uncertainty and reliability into the determination of the TMDL were presented. Secondly, three methods to objectively allocate load reductions were adopted from the water management community. The new approach was demonstrated for the Anyangcheon Watershed in Korea. The case study validated the need for the new additions to the TMDL development approach in Korea. Specifically, the need to consider uncertainty and variability in the form of a margin of safety was clearly indicated. The method used to define the MOS resulted in a wide range of MOS magnitudes. This wide range of MOS translated to significant differences in TMDL magnitudes and required load reductions. In addition,
Table 4. Comparison of Three Allocation Methods for Drought Flow (Q355) Equal Load Reduction SubWatershed
TMDL (kg/day)
Discharged Load (kg/day)
Equal Percent Reduction
Load reduction (kg/day)
TMDL (kg/day)
Equity Standards
Load reduction (kg/day)
TMDL (kg/day)
Load reduction (kg/day)
MOS (%) 10
11.6
43.8
10
11.6
43.8
10
11.6
43.8
10
11.6
43.8
10
11.6
43.8
10
11.6
43.8
40
39
25
94
95
109
51
51
40
83
83
94
WG
134
0
0
0
134
134
134
OJ
173
0
0
0
173
173
173
56
55
35
117
118
138
65
64
46
108
109
127
DJ
296
0
0
0
296
296
296
110
108
68
186
188
228
143
141
113
153
155
183
SB1
552
105
99
0
447
453
552
202
198
126
350
354
426
270
267
216
282
285
336
HU
536
169
164
61
367
372
475
232
228
145
304
308
391
0
0
0
536
536
536
SA
300
0
0
0
300
300
300
96
94
60
204
206
240
110
108
79
190
192
221
SS
451
0
0
0
451
451
451
136
134
85
315
317
366
166
164
125
285
287
326
SB2
173
0
0
0
173
173
173
54
53
34
119
120
139
65
64
49
108
109
124
0
0
0
269
269
269
170
172
207
131
132
155
SH
269
99
97
62
138
137
114
MG
2,396
1,335 1,330 1,227 1,061 1,066 1,169 778
764
486 1,618 1,632 1,910 940
929
702 1,456 1,467 1,694
DR
1,587
1,087 1,082 979
662
650
414
726
715
499
Others
3,098
2,340 2,382 3,098 989
971
618 2,109 2,127 2,480 780
751
176 2,318 2,347 2,922
Outlet
9,965
758
716
0
500
505
608
925
937
1173
861
872 1,088
3,454 3,391 2,267 6,511 6,574 7,698 3,454 3,391 2,158 6,511 6,574 7,807 3,454 3,391 2,158 6,511 6,574 7,807
Vol. 15, No. 7 / September 2011
− 1295 −
Eun-Sung Chung, Kyung-Tae Kim, Kil Seong Lee, and Steven J. Burian
the impact of using drought flow versus low flow in determining the TMDL and load reductions was found to be important, but not as important as incorporating uncertainty and variability in the form of an MOS. The pollutant load reduction allocation strategies investigated were found to produce significantly different allocations among the sub-watersheds. The equal load reduction was found to produce unfair requirements for most small contributors compared to the larger contributing sub-watersheds, while the equal percent reduction placed too much burden on the larger contributors. A more impartial approach based on incorporating equity standards ranked by technical experts and decision makers provided a reasonable and sustainable balance of load reductions across all sub-watersheds. This study supports the incorporation of uncertainty and objective load reduction allocation approaches into the TMDL development process in Korea.
Acknowledgements This research was supported by a grant (1-7-3) from Sustainable Water Resources Research Center of 21st Century Frontier Research Program of Ministry of Science and Technology (20%) through Engineering Research Institute of Seoul National University and Safe and Sustainable Infrastructure Research (80%).
References AQUA TERRA (2004). BASIN/HSPF Training Handbook. U.S. EPA. Bicknell, B. R., Imhoff, J. C., Kittle Jr., J. L., Jobes, T. H., and Donigian Jr., A. S. (2001). Hydrologic Simulation Program – Fortran (HSPF) User’s Manual for Version 12. U.S. Environmental Protection Agency, National Exposure Research Laboratory, Athens, GA. Borsuk, M. E., Stow, C. A., and Reckhow, K. H. (2002). “Predicting the frequency of water quality standard violations: A probabilistic approach for TMDL development.” Environmental Science & Technology, Vol. 26, No. 10, pp. 2109-2115. Chadderton, R., Miller, A., and McDonnell, A. (1981). “Analysis of wasteload allocation Procedures.” Water Resources Bulletin, Vol. 17, No. 5, pp. 760-66 Chen, C. W., Herr, J., Ziemelis, L., Goldstein, R. A., and Olmsted, L. (1999). “Decision support system for total maximum daily load.” Journal of Environmental Engineering, Vol. 125, No. 7, pp. 653659. Chung, E. S. and Lee, K .S. (2009). “Prioritization of water management for sustainability using hydrologic simulation model and multicriteria decision making techniques.” Journal of Environmental Management, Vol. 90, No. 3, pp. 1502-1511. Chung, E. S., Park, K., and Lee, K. S. (2011). “The relative impacts of climate change and urbanization on the hydrological response of a Korean urban watershed.” Hydrological Processes, Vol. 25, No. 4, pp. 544-560. DePinto, J. V., Freedman, P. L., Dilks, D. M., and Larson, W. M. (2004). “Models quantify the total maximum daily load process.” Journal of Environmental Engineering, Vol. 130, No. 6, pp. 703-713. Dilks, D. W. and Freedman, P. L. (2004). “Improved consideration of the margin of safety in total maximum daily load development.” Journal of Environmental Engineering, Vol. 130, No. 6, pp. 690-
694. Franceschini, S. and Tsai, C. W. (2008). “Incorporating reliability into the definition of the margin of safety in total maximum daily load calculations.” Journal of Water Resources Planning and Management, Vol. 134, No. 1, pp. 34-44. Gleick, P. (1994). “Reducing the risks of conflict over fresh water resources in the Middle East.” in Issac, J. and Shuval, H. (eds), Water and Peace in the Middle East, Amsterdam, pp. 31-54. Jung, Y. J., Stenstrom, M. K., Jung, D. I., Kim, L. H., and Min, K. S. (2008). “National pilot projects for management of diffuse pollution in Korea.” Desalination, Vol. 226, Nos. 1-3, pp. 97-105. Kim, K. T., Chung, E. S., Kim, S. U., and Lee, K. S. (2010). “Improvement and application of total maximum daily load management system of Korea: 2. Determination of margin of safety and allocation of pollutant loads.” Journal of Korean Society on Water Quality, Vol. 26, No. 1, pp. 168-176 (in Korean). Kim, K. T., Chung, E. S., Kim, S. U., Lee, K. S., and Sung, J. Y. (2009). “Improvement and application of total maximum daily load management system of Korea: 1. Calculation of total amount of pollutant load in the Anyangchen watershed.” Journal of Korean Society on Water Quality, Vol. 25, No. 6, pp. 972-978 (in Korean). Kim, S. U. and Lee, K. S. (2010). “Regional low flow frequency analysis using Bayesian regression and prediction at ungauged catchment in Korea.” KSCE Journal of Civil Engineering, Vol. 14, No. 1, pp. 8798. Kim, Y. I. and Yi, S. J. (2006). “A study on the improvement scheme of the total water pollution load management plan.” Journal of Korean Society on Water Quality, Vol. 22, No. 6, pp. 977-981 (in Korean). Labiosa, W., Leckie, J., Shachter, R., Freyberg, D., and Trytuba, J. (2005). “Incorporating uncertainty in watershed management decision making: A mercury TMDL case.” Proc. Watershed Management Conf.: Managing Watersheds for Human and Natural Impacts, ASCE, Reston, VA. Lee, K. S. (2007). Rehabilitation of the hydrologic cycle in the anyangcheon watershed, Sustainable Water Resources Research Center of 21st Century Frontier Research Program. Seoul National University, Seoul (in Korean). Lee, K. S. and Chung, E. S. (2007). “Development of integrated watershed management schemes for intensively urbanized region in Korea.” Journal of Hydro-Environmental Research, Vol. 1, No. 2, pp. 95-109. Lee, K. S., Chung, E. S., Lee, J. S., and Hong, W. P. (2007). “Analysis of hydrologic cycle and BOD loads using HSPF in the Anyangcheon watershed.” Journal of Korean Water Resources Association, Vol. 40, No. 8, pp. 585-600 (in Korean). Mimi, Z. A. and Sawalhi, B. I. (2003). “A decision tool for allocating the waters of the Jordan river basin between all riparian parties.” Water Resources Management, Vol. 17, No. 6, pp. 447-461. Ministry of Environment (MOE) (2003). Guidebook for Total Maximum Daily Load Programs. Ministry of Environment . New York City Department of Environmental Protection (NYCDEP) (1999). Methodology for Calculating Phase II Total Maximum Daily Loads (TMDLs) of Phosphorus for New York City Drinking Water Reservoirs. Novotny, V. (1999). “Integrating diffuse/nonpoint pollution control and water body restoration into watershed management.” Journal of American Water Resources Association, Vol. 35, No. 4, pp. 717-727. Novotny, V. (2004). “Simplified databased total maximum daily loads, or the world is log-normal.” Journal of Environmental Engineering, Vol. 130, No. 6, pp. 674-683.
− 1296 −
KSCE Journal of Civil Engineering
Incorporating Uncertainty and Objective Load Reduction Allocation into the Total Maximum Daily Load Process in Korea
Reckhow, K. (2003). “On the need for uncertainty assessment in TMDL modeling and implementation.” Journal of Water Resources Planning and Management, Vol. 129, No. 4, pp. 245-246. Santhi, C., Arnold, J. G., Williams, J. R., Hauck, L. M., and Dugas, W. A. (2001). “Application of a watershed model to evaluate management effects on point and nonpoint source pollution. Transactions of ASAE, Vol. 44, No. 6, pp. 1559-1570. UN (1997). Convention on the Law of the Non-navigational Users of International Watercourses.
Vol. 15, No. 7 / September 2011
USEPA (1999). Protocol for Developing Nutrient TMDLs. USEPA. Walker, W. W. (2003). “Consideration of variability and uncertainty in phosphorous total maximum daily loads for lakes.” Journal of Water Resources Planning and Management, Vol. 129, No. 4, pp. 337-344. Zhang, H. X. and Yu, S. L. (2004). “Applying the first-order error analysis in determining the margin of safety for total maximum daily load computations.” Journal of Environmental Engineering, Vol. 130, No. 6, pp. 664-673.
− 1297 −