Liam Murphy, University College Dublin, Ireland. Abstract. There is .... Lambrecht, 1996; Watson, Hu, & McGowan, 2000; Winkler, 1999), but they are limited and.
242 Cranley & Murphy
Chapter XII
Incorporating User Perception in Adaptive Video Streaming Systems Nicola Cranley, University College Dublin, Ireland Liam Murphy, University College Dublin, Ireland
Abstract There is an increasing demand for streaming video applications over both the fixed Internet and wireless IP networks. The fluctuating bandwidth and time-varying delays of best-effort networks makes providing good quality streaming a challenge. Many adaptive video delivery mechanisms have been proposed over recent years; however, most do not explicitly consider user-perceived quality when making adaptations, nor do they define what quality is. This chapter describes research that proposes that an optimal adaptation trajectory through the set of possible encodings exists, and indicates how to adapt transmission in response to changes in network conditions in order to maximize user-perceived quality.
Copyright © 2006, Idea Group Inc. Copying or distributing in print or electronic forms without written permission of Idea Group Inc. is prohibited.
Incorporating User Perception in Adaptive Video Streaming Systems
243
Introduction Best-effort IP networks are unreliable and unpredictable, particularly in a wireless environment. There can be many factors that affect the quality of a transmission, such as delay, jitter, and loss. Congested network conditions result in lost video packets, which, as a consequence, produce poor quality video. Further, there are strict delay constraints imposed by streamed multimedia traffic. If a video packet does not arrive before its playout time, the packet is effectively lost. Packet losses have a particularly devastating effect on the smooth continuous playout of a video sequence due to interframe dependencies. A slightly degraded quality but uncorrupted video stream is less irritating to the user than a randomly-corrupted stream. However, rapidly fluctuating quality should also be avoided as the human vision system adapts to a specific quality after a few seconds, and it becomes annoying if the viewer has to adjust to a varying quality over short time scales (Ghinea, Thomas, & Fish, 1999). Controlled video quality adaptation is needed to reduce the negative effects of congestion on the stream while providing the highest possible level of service and quality. For example, consider a user watching some video clip; when the network is congested, the video server must reduce the transmitted bitrate to overcome the negative effects of congestion. In order to reduce the bitrate of the video stream, the quality of the video stream must be reduced by sacrificing some aspect of the video quality. There are a number of ways in which the quality can be adapted; for example, the image resolution (i.e. the amount of detail in the video image), the frame rate (i.e. the continuity of motion), or a combination of both can be adapted. The choice of which aspect of the video quality should depend on how the quality reduction will be perceived. In the past few years, there has been much work on video quality adaptation and video quality evaluation. In general, video quality adaptation indicates how the bit rate of the video should be adjusted in response to changing network conditions. However, this is not addressed in terms of video quality, as for a given bit rate budget there are many ways in which the video quality can be adapted. Video quality evaluation measures the quality of video as perceived by the users, but current evaluation approaches are not designed for adaptive video streaming transmissions. This chapter will firstly provide a generalized overview of adaptive multimedia systems and describe recent systems that use end-user perception as part of the adaptation process. Many of these adaptive systems rely on objective metrics to calculate the userperceived quality. Several objective metrics of video quality have been developed, but they are limited and not satisfactory in quantifying human perception. Further, it can be argued that to date, objective metrics were not designed to assess the quality of an adapting video stream. As a case study, the discussion will focus on recent research that demonstrates how user-perceived quality can be used as part of the adaptation process for multimedia. In this work, the concept of an Optimal Adaptation Trajectory (OAT) has been proposed. The OAT indicates how to adapt multimedia in response to changes in network conditions to maximize user-perceived quality. Finally experimental subjective testing results are presented that demonstrate the dynamic nature of user-perception with adapting multimedia. The results illustrate that using a two-dimensional adaptation strategy based on the OAT out-performs one-dimensional adaptation schemes, giving better short-term and long-term user-perceived quality.
Copyright © 2006, Idea Group Inc. Copying or distributing in print or electronic forms without written permission of Idea Group Inc. is prohibited.
244 Cranley & Murphy
Review of Adaptive Multimedia Systems Given the seriousness of congestion on the smooth continuous play-out of multimedia, there is a strong need for adaptation. The primary goals of adapting multimedia are to ensure graceful quality adaptation, maintain a smooth continuous play-out and maximize the user-perceived quality. Multimedia servers should be able to intelligently adapt the video quality to match the available resources in the network. There are a number of key features that need to be considered in the development of an adaptive streaming system (Wang & Schulzrinne, 1999) such as feedback to relay the state of the network between client and server, the frequency of this feedback, the adaptation algorithm used, the sensitivity of the algorithm to feedback, and the resulting user-perceived quality. However, the most important thing is how the system reacts, adapts to congestion, and the perceived quality that results from this adaptation.
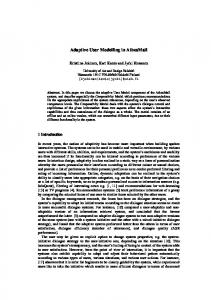
Adaptation Techniques Broadly speaking, adaptation techniques attempt to reduce network congestion by matching the rate of the multimedia stream to the available network bandwidth. Without some sort of rate control, any data transmitted exceeding the available bandwidth would be discarded, lost, or corrupted in the network. Adaptation techniques can be classified into the following generalized categories: rate control, rate shaping, and rate adaptive encoding (Figure 1). Each of these techniques adapts the transmitted video stream to match the available resources in the network by either adapting the rate at which packets are sent or adjusting the quality of the delivered video (Wu, Hou, Zhu, Lee, Chiang, Zhang, & Chao, 2000, 2002). These are briefly described in the following sections.
Figure 1. Adaptation techniques
Copyright © 2006, Idea Group Inc. Copying or distributing in print or electronic forms without written permission of Idea Group Inc. is prohibited.
Incorporating User Perception in Adaptive Video Streaming Systems
245
Rate Control Rate control is the most commonly-used mechanism employed in adaptive multimedia systems. Rate control can be implemented either at the server, the client, or a hybrid scheme whereby the client and server cooperate to achieve rate control. •
Sender-based rate control: On receipt of feedback from the client, the server adapts the transmission rate of the multimedia stream being transmitted in order to minimize the levels of packet loss at the client by matching the transmission rate of the multimedia stream to the available network bandwidth. Without any rate control, the data transmitted exceeding the available bandwidth would be discarded in the network.
•
Receiver-based rate control: The clients control the receiving rate of video streams by adding/dropping layers. In layered multicast, the video sequence is compressed into multiple layers: a base layer and one or more enhancement layers. The base layer can be independently decoded and provides basic video quality; the enhancement layers can only be decoded together with the base layer, and they enhance the quality of the base layer.
•
Hybrid rate control: This consists of rate control at both the sender and receiver. The hybrid rate control is targeted at multicast video and is applicable to both layered video and non-layered video. Typically, clients regulate the receiving rate of video streams by adding or dropping layers while the sender also adjusts the transmission rate of each layer based on feedback information from the receivers.
Unlike server-based schemes, the server uses multiple layers, and the rate of each layer may vary due to the hybrid approach of adapting both at the server and receiver.
Rate Shaping Rate shaping is a technique to adapt the rate of compressed video bit-streams to meet some target bit rate by acting as a filter (or interface) between the compression layer and the transport layer. There are a number of filters that can be used to achieve rate shaping. •
Frame-dropping filter: This filter distinguishes between the different frame types in a video stream (i.e., I-, P- and B-frames). The frame-dropping filter is used to reduce the data rate of a video stream by discarding frames according to their relative importance. For example, B-frames are preferentially dropped, followed by P-frames and finally I-frames.
•
Frequency filter: This filter performs filtering operations on the compression layer, for example, by discarding DCT coefficients at higher frequencies or reducing the color depth.
Copyright © 2006, Idea Group Inc. Copying or distributing in print or electronic forms without written permission of Idea Group Inc. is prohibited.
246 Cranley & Murphy
•
Re-quantization filter: performs quantizes the DCT coefficients. The filter extracts and de-quantizes the DCT coefficients from the compressed video stream then requantizes the coefficients with a larger quantization step which results in a reduced bitrate and reduced quality.
Rate Adaptive Encoding Rate adaptive encoding performs adaptation by adjusting the encoding parameters which in turn adapts the output bit rate. However, adaptive encoding is constrained by the capabilities of the encoder and the compression scheme used. There are a number of encoding parameters that can be adapted in rate adaptive encoding, such as dynamically adapting the quantization parameter, frame rate, and/or the spatial resolution.
Discussion The key questions that arise when developing or designing adaptation algorithms are how the system adapts and the perceived quality at the receiver. There are a number of common components in each of the different adaptation techniques described. Many adaptation algorithms have a strong dependency on the choice of control parameters used within the adaptation process. For example, in a server-based rate control system, upon receipt of feedback the server either increases its transmission rate by α or decreases its rate by β. If the rate of α is chosen to be too large, the increased transmission rate could push the system into causing congestion, which can in turn cause the client to experience loss and poor perceived quality. However, if α is too small, the server is very slow to make use of the extra available bandwidth and send a higher bit rate video stream. Thus, the algorithm is heavily dependent on the value of the control parameters, α and β, which drive the adaptation. Even more problematic is translating rate into real video encoding parameters. Consider a simple system where the server is delivering video at 150kbps, and based on feedback, the algorithm indicates that the transmission rate should be increased to 160kps. The question that remains is: How should the extra 10kps be achieved, how can the video stream be adjusted to achieve this rate? This is further complicated by the limitations of the encoder to adapt the video. Layer-based schemes are equally problematic since there is no firm definition of what constitutes a base layer and each of the enhancement layers. The most important issue that is often omitted in the design of adaptation algorithms is user-perception. User-perception should be incorporated into the adaptation algorithms, since it is the user who is the primary entity affected by adaptation, and should therefore be given priority in the adaptation decision-making process. For example, if a video clip is being streamed at a particular encoding configuration and the system needs to degrade the quality being delivered, how this adaptation occurs should be dictated by the users’ perception. The way to degrade should be such as to have the least negative impact on the users’ perception. There needs to be some sort of understanding of video quality and the perception of the video quality in order for adaptation to occur in an achievable and intelligent manner.
Copyright © 2006, Idea Group Inc. Copying or distributing in print or electronic forms without written permission of Idea Group Inc. is prohibited.
Incorporating User Perception in Adaptive Video Streaming Systems
247
Review of Objective Metrics The main goal of objective metrics is to measure the perceived quality of a given image or video. Sophisticated objective metrics incorporate perceptual quality measures by considering the properties of the Human Visual System (HVS) in order to determine the visibility of distortions and thus the perceived quality. However, given that there are many factors that affect how users perceive quality, such as video content, viewing distance, display size, resolution, brightness, contrast, sharpness/fidelity, and colour, many objective metrics have limited success in calculating the perceived quality accurately for a diverse range of testing conditions and content characteristics. Several objective metrics of video quality have been proposed (Hekstra, 2002; van den Branden Lambrecht, 1996; Watson, Hu, & McGowan, 2000; Winkler, 1999), but they are limited and not satisfactory in quantifying human perception (Masry & Hemami, 2002; Yu & Wu, 2000). In this section two key objective metrics, the Peak Signal to Noise Ratio (PSNR) and the Video Quality Metric (VQM) are reviewed. These two metrics have been widely applied to many applications and adaptation algorithms to assess video quality.
Peak Signal to Noise Ratio (PSNR) The most commonly-used objective metric of video quality assessment is the Peak Signal to Noise Ratio (PSNR). The advantage of PSNR is that it is very easy to compute. However, PSNR does not match well to the characteristics of HVS. The main problem with using PSNR values as a quality assessment method is that even though two images are different, the visibility of this difference is not considered. The PSNR metric does not take the visual masking phenomenon or any aspects of the HVS into consideration, that is, every single errored pixel contributes to the decrease of the PSNR, even if this error is not perceived. For example, consider an image where the pixel values have been altered slightly over the entire image and an image where there is a concentrated distortion in a small part of the image both will result in the PSNR value however, one will be more perceptible to the user than the other. It is accepted that the PSNR does not match well to the characteristics of the HVS (Girod, 1993; van den Branden Lambrecht & Verscheure, 1996).
Video Quality Metric (VQM) The ITU-T has recently accepted the Video Quality Metric (VQM) from the National Telecommunications and Information Administration (NTIA) as a recommended objective video quality metric that correlates adequately to human perception in ITU-T J.148 (2003) and ITU-T J.149 (2004). The Video Quality Metric (VQM) provides a means of objectively evaluating video quality. The system compares an original video clip and a processed video clip and reports a Video Quality Metric (VQM) that correlates to the perception of a typical end user. The VQM objective metrics are claimed to provide close
Copyright © 2006, Idea Group Inc. Copying or distributing in print or electronic forms without written permission of Idea Group Inc. is prohibited.
248 Cranley & Murphy
approximations to the overall quality impressions, or mean opinion scores (Wolf & Pinson, 1999). The quality measurement process includes sampling of the original and processed video streams, calibration of the original and processed video streams, extraction of perception-based features, computation of video quality parameters, and finally calculation using various VQM models.
Using Objective Metrics for Multimedia Adaptation Given the wide range of video quality metrics developed, the Video Quality Experts Group (VQEG) was formed in 1997 with the task of collecting reliable subjective ratings for a defined set of test sequences and to evaluate the performance of various objective video quality metrics (VQEG, 2005). In 2000, the VQEG performed a major study of various objective metrics on behalf of the ITU to compare the performances of various objective metrics against subjective testing in terms of prediction accuracy, prediction monotonicity, and prediction consistency. The results of the VQEG study found that no objective metric is able to fully replace subjective testing, but even more surprisingly, that no objective metric performed statistically better than the PSNR metric. The main difficultly with video quality metrics is that even though they give an indication of the video quality, they do not indicate how the video quality should be adapted in an adaptive system. Furthermore, many of these objective metrics require a comparison between the reference clip and the degraded video clip in order to calculate the video quality. This comparison is often done on a frame-by-frame basis and therefore requires both the reference and degraded clips to have the same frame rate. The more sophisticated metrics proposed are extremely computationally intense and are unsuitable for use in a real-time adaptive system. Given the limitations of objective metrics, it has been recognized that user-perception needs to be incorporated in adaptation algorithms for streamed multimedia. There are emerging adaptive streaming systems being developed that address this issue (Muntean, Perry, & Murphy, 2004; Wang, Chang, & Loui, 2004).
Optimum Adaptation Trajectories (OATs) This section will focus on an approach that incorporates user-perception into adaptation algorithms for video streaming. This work proposes that there is an optimal way in which multimedia transmissions should be adapted in response to network conditions to maximize the user-perceived quality (Cranley, Murphy, & Perry, 2003). This is based on the hypothesis that within the set of different ways to achieve a target bit rate, there exists an encoding configuration that maximizes the user-perceived quality. If a particular multimedia file has n independent encoding configurations, then there exists an adaptation space with n dimensions. When adapting the transmission from some point within that space to meet a new target bit rate, the adaptive server should select the encoding configuration that maximizes the user-perceived quality for that given bit rate. When the
Copyright © 2006, Idea Group Inc. Copying or distributing in print or electronic forms without written permission of Idea Group Inc. is prohibited.
Incorporating User Perception in Adaptive Video Streaming Systems
249
transmission is adjusted across its full range, the locus of these selected encoding configurations should yield an Optimum Adaptation Trajectory (OAT) within that adaptation space. This approach is applicable to any type of multimedia content. The work presented here focuses for concreteness on the adaptation of MPEG-4 video streams within a finite twodimensional adaptation space defined by the range of the chosen encoding configurations. Each encoding configuration consists of a combination of frame rate and resolution and is denoted as [Frame rate FPS, Resolution R]. These encoding variables were chosen as they most closely map to the spatial and temporal complexities of the video content. The example shown in Figure 2(a) indicates that, when degrading the quality from an encoding configuration of 25fps and 100% resolution or [25FPS, 100R], there are a number of possibilities such as reducing the frame rate only, [XFPS, 100R], reducing the resolution only, [25 FPS, YR], or reducing a combination of both parameters, [UFPS, VR]. Each of these possibilities lies within a zone of Equal Average Bit Rate (EABR). The clips falling within a particular zone of EABR have different, but similar bit rates. For example, the bit rates corresponding to the encoding points [17FPS, 100R], [25FPS, 79R] and [25FPS, 63R] were 85, 88, and 82 kbps, respectively. To compare clips of exactly the same bit rate would require a target bit rate to be specified, and then the encoder would use proprietary means to achieve this bit rate by compromising the quality of the encoding in an unknown manner. Using zones of EABR effectively quantizes the bit rate of different video sequences with different encoding configurations. The boundaries of these zones of EABR are represented as linear contours for simplicity, since their actual shape is irrelevant for this scheme. The OAT indicates how the quality should be adapted (upgraded or downgraded) so as to maximize the user-perceived quality. The OAT may be dependent on the characteristics of the content. There is a content space in which all types of video content exist in terms of spatial and temporal complexity (or detail and action). Every type of video content within this space can be expanded to an adaptation space as shown in Figure 2(b). Adaptation space consists of all possible dimensions of adaptation for the content. It can be implemented as part of an adaptive streaming server or adaptive encoder.
Figure 2(a). Adaptation possibilities
Figure 2 (b). Adaptation space
[25, 100%] [X, 100%]
[U, V%] [25, Y%] [Frame rate, Resolution]
Copyright © 2006, Idea Group Inc. Copying or distributing in print or electronic forms without written permission of Idea Group Inc. is prohibited.
250 Cranley & Murphy
OAT Discovery User perception of video quality may vary with the content type; for example, viewers may perceive action clips differently from slow-moving clips. Thus, there may exist a different OAT for different types of content based on their spatial and temporal characteristics. In order to characterize content in terms of its spatial and temporal complexity, a spatial-temporal grid was constructed, as shown in Figure 3(a). The spatial and temporal perceptual information of the content was determined using the metrics Spatial Information (SI) and Temporal Information (TI) (ITU-T P.910, 1999). Eight different content types were selected based on their SI and TI values in order to cover as much of the Spatial-Temporal grid as possible. These test sequences were acquired from the VQEG. Each test sequence was then expanded to form an adaptation space, as shown in Figure 3(b). During the preparation of the test sequences for the subjective testing, the encoding method used was the “most accurate”, that is, no target bit rate was specified, and the encoder followed the supplied encoding parameters as closely as possible regardless of the resulting bit rate. The subjective testing consisted of two independent testers performing identical test procedures and using identical test sequences on subjects. Subjects were eliminated if the subject was either knowledgeable about video quality assessment or had any visual impairments. Testing was conducted in two phases. Phase One considered four test sequences, one taken from each quadrant of the SI-TI grid. To facilitate subjective testing and reduce the number of test cases, adaptation space was sampled using a logarithmic scale to reflect Weber’s Law of Just Noticeable Difference (JND). Phase Two considered four different test sequences with similar SI-TI values to those used for Phase One. However, this time, the adaptation space was sampled using a linear scale. The main objective of having two different test phases was to verify and validate the results from
80
Low SI, High TI High SI, High TI
70 60
C2: Canoe
C1: Football
50 40
C3: Susie
30
C4: Wash DC
20 10
Low SI, Low TI
High SI, Low T I
0
100 Spatial Resolution (%)
Temporal Information (TI units)
Figure 3(a) Spatial-temporal grid sampled with four content types for phase one of testing; (b) Logarithmically-sampled adaptation space for content type C1
90
EABR 125kbps
80 70 60 EABR 50kbps
50
EABR 75kbps
EABR 100kbps
40 0
50
100
150
200
Spatial Information (SI units)
(a)
250
5
10
15
20
25
Frame Rate (fps)
(b)
igure 3 (a) Spatial-Temporal Grid sampled with 4 content types for phase one of testing Copyright © 2006, Idea Group Inc. Copying or distributing in print or electronic forms without written permission of Idea Group Inc. is prohibited.
Incorporating User Perception in Adaptive Video Streaming Systems
251
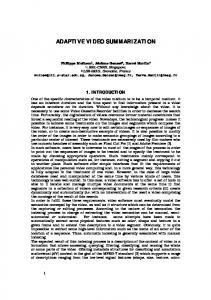
Phase One. In addition, by using different encoding scales, it could be verified that the OAT was similar in shape regardless of whether a linear or logarithmic scale was used, and regardless of the encoding points tested. There are a number of different subjective testing methodologies that are proposed by the ITU-T, including the Absolute Category Rating (ACR), the Degraded Category Rating (DCR), and Pair Comparison (PC) methods. The DCR method uses a five-point impairment scale whilst the ACR method uses a five-point quality grading scale, or alternatively a Continuous Quality Scale (CQS) (ITU-T P.910, 1999). However, by using such grading scales, it is criticized that different subjects may interpret the associated grading scale in different ways and use the grading scale in a non-uniform fashion (Watson, 1998). To overcome these difficulties in the grading procedure, the Forced Choice methodology is often employed. In the forced choice method, the subject is presented with a number of spatial or temporal alternatives in each trial. The subject is forced to choose the location or interval in which their preferred stimulus occurred. Using the forced choice method, the bias is binary, which simplifies the rating procedure and allows for reliability, verification, and validation of the results. The subjective tests consisted of a subject watching every combination of pairs of clips from each EABR zone for each content type and making a forced choice of the preferred encoding configuration. Intra-reliability and inter-reliability of a subject were factored into the test procedure by including repetition of the same test sequence presentation. The diagram in Figure 4 shows the subjective test results obtained for a particular content type. The diagram consists of a grid of circular encoding points where the frame rate is on the x-axis and the resolution is on the y-axis. Through these encoding points are diagonal grey lines denoting the zones of EABR, ranging from 100kbps to 25kbps. The encoding points marked with a percentage preference value are those points that were tested within a zone of EABR. For example, in EABR-100kbps, there were two encoding configurations tested, [17FPS, 100R] and [25FPS, 79R]. Seventy percent of the subjects preferred encoding configuration [17FPS, 100R], while the remaining 30% preferred encoding configuration [25FPS, 79R]. However, in the left-most zone of EABR, the preferred encoding configuration is [5FPS, 63R]. In this zone of EABR there are three encoding configurations, but since the frame rate is the same, the preferred encoding configuration is that with the highest resolution, [5FPS, 63R]. The Path of Maximum Preference and is the path through the zones of EABR joining the encoding configurations with the maximum user preference. Weighted points were then used to obtain the Optimal Adaptation Perception (OAP) points. The weighted points were interpolated as the sum of the product of preference with encoding configuration. For example, 70% of subjects preferred encoding [17FPS, 100 R] and 30% preferred encoding point [25FPS, 79 R]. The weighted vector of these two encoding configurations is [70%(17FPS)+30%(25FPS), 70%(100R)+30%(79R)] which equals OAP point [19.4FPS, 93.7R]. The Weighted Path of Preference is the path joining the OAPs. There are two possible paths which can be used to represent the OAT: the path of maximum user preference, and the weighted path of preference. It seems likely that by using the weighted path of preference, the system can satisfy more users by providing a smooth graceful quality adaptation trajectory. Using the same subjective testing methodology, the OAPs in each zone of EABR were compared against the maximum preferred encoding and all other encoding configurations. In all cases, the interpolated
Copyright © 2006, Idea Group Inc. Copying or distributing in print or electronic forms without written permission of Idea Group Inc. is prohibited.
252 Cranley & Murphy
Figure 4. Subjective test results for content type, C3
74%
54%
70%
100%
Spatial Resolution (%)
100 EABR 100kbps
90 80 70
42%
30%
EABR 75kbps
4%
26%
60 EABR 50kbps
50 40 5
10
15 20 Frame Rate (fps) Encoding pts Encoding pts tested Path of Max Pref OAP
25
OAP did not have a statistically-significant preference from the maximum preferred encoding indicating that this simple weighted vector approach is acceptable. It was also observed that there was a higher incidence of forced choices when the maximum preferred encoding and the OAP were close together. Figure 5 shows the paths of maximum preference and weighted paths of preference for the four content types used during Phase One of testing. It can be clearly seen from the paths of maximum user preference that when there is high action (C1 and C2), the resolution is less dominant regardless of whether the clip has high spatial characteristics or not. This implies that the user is more sensitive to continuous motion when there is high temporal information in the video content. Intuitively this makes sense as when
Figure 5. Path of maximum user preferenceand weighted path of preference for four different content types
Copyright © 2006, Idea Group Inc. Copying or distributing in print or electronic forms without written permission of Idea Group Inc. is prohibited.
Incorporating User Perception in Adaptive Video Streaming Systems
253
there is high action in a scene; often the scene changes are too fast for the user to be able to assimilate the scene detail. Conversely, when the scene has low temporal requirements (C3 and C4), the resolution becomes more dominant regardless of the spatial characteristics. Objective metrics were investigated to determine whether they yielded an OAT that correlated to that discovered using subjective testing. The results showed that there is a significant difference between the adaptation trajectories yielded using objective metrics and subjective testing techniques. This suggests that measuring quality and adapting quality based on this measurement are different tasks.
Oats in Practice In this section, how user-perception is affected by adapting video quality is investigated. In particular, the user-perceived quality is compared when video quality is varied by adapting the frame rate only, the resolution only, or adapting both the frame rate and the resolution using the OAT. Streaming multimedia over best-effort networks is becoming an increasingly important source of revenue. A content provider is unlikely to have the resources to provide real-time adaptive encoding for each unicast request and, as such, reserves this for “live” multicast sessions only. Typically, pre-encoded content is transmitted by unicast streams where the client chooses the connection that most closely matches their requirements. For such unicast sessions, the adaptive streaming server can employ several techniques to adapt the pre-encoded content to match the clients’ resources. In such adaptive streaming systems, two techniques that are most commonly used are frame dropping and stream switching. The OAT shows how to stream the video in order to maximize the user’s perceived quality in a two-dimensional adaptation space defined by frame rate and resolution (Figure 6). Adaptive frame rate can be achieved by frame dropping, while adapting spatial resolution can be achieved using track or stream switching. All adaptation algorithms behave in an A-Increase/B-Decrease manner where A and B are the methods of change and can be either Additive, Multiplicative, Proportional, Incremental, or Decremented (Figure 7). When there is no congestion, the server increases its transmission rate either additively (AI), proportionally (PI), or multiplicatively (MI), and similarly when there is congestion, it decreases its transmission rate either additively (AD), proportionally (PD), or multiplicatively (MD). There are many ways to adapt video quality, for example: •
Additive Increase/Multiplicative Decrease (AIMD) (Chiu & Jain, 1989)
•
Additive Increase/Additive Decrease (AIAD),
•
Additive Increase/Proportional Decrease (AIPD) (Venkitaraman, Kim, Lee, Lu, & Bharghavan, 1999),
Copyright © 2006, Idea Group Inc. Copying or distributing in print or electronic forms without written permission of Idea Group Inc. is prohibited.
254 Cranley & Murphy
Figure 6. One-dimensional versus two-dimensional adaptation Frame Rate Only
90
Resolution Only
Resolution (%)
100
80 OAT 70 60 50 5
•
10 15 20 Frame Rate (fps)
25
Multiplicative Increase/Multiplicative Decrease (MIMD) (Turletti & Huitema, 1996).
In general, all rate-control algorithms exhibit some form of AI and AD behavior, although the majority of adaptation algorithms are AIMD (Feamster, Bansal, & Balakrishnan, 2001). Thus the perception of adapting video quality is assessed in three different test cases. The first test assesses user perception when quality is adapted up in an AI manner, while the second assesses perception when quality is degraded down in an AD manner. Finally, the third assesses quality adapting in an Additive Increase/Multiplicative Decrease (AIMD) manner.
Figure 7. AIMD and MIMD
Copyright © 2006, Idea Group Inc. Copying or distributing in print or electronic forms without written permission of Idea Group Inc. is prohibited.
Incorporating User Perception in Adaptive Video Streaming Systems
255
Test Methodology The Forced Choice methodology is suitable for clips lasting not longer than 15 seconds. For video clips lasting longer than this duration, there are recency and forgiveness effects by the subject, which are a big factor when the subject must grade the overall quality of a video sequence. For example, the subject may forget and/or forgive random appearances of content-dependent artifacts when they are making their overall grade of the video sequence. To test clips of a longer duration, a different test methodology to the forced choice method needs to be applied to overcome the forgiveness and recency effects and to ensure the subject can make an accurate judgement. The Single Stimulus Continuous Quality Evaluation (SSCQE) methodology is intended for the presentation of sequences lasting several minutes (ITU-R BT.500-7, 1997). Continuous evaluation is performed using a slider scale on the screen to record the subjects’ responses without introducing too much interference or distraction, and provides a trace of the overall quality of the sequence (Pinson & Wolf, 2003). A reference clip was played out at the beginning of the test so that the subjects were aware of the highest quality sequence. The three varying quality sequences were then presented in random order to each subject in turn. As each sequence was played out, the subject continuously rated the quality of the sequence using the slider. When the slider is moved, the quality grade of the slider is captured and related to the playout time of the media. The Mean Opinion Score (MOS) and standard deviation are calculated at each media time instant. In this case, each media time instant corresponds to one second of media. The MOS and standard deviation is calculated for each clip segment. The test sequence chosen for this experiment contains a wide range of spatial and temporal complexity. The test sequence contains periods of high temporal complexity that are generally bursty containing many scene changes. In this test sequence, periods of high temporal complexity are generally followed by periods of relatively low temporal complexity but high spatial complexity consisting of detailed scenes such as facial closeups and panoramic views. This test sequence contains a broad diversity of complexity and is typical of film trailers. The test sequence was divided into segments of 15 seconds duration, and each segment was encoded at various combinations of spatial resolution and frame rate. These video segments were then pieced together seamlessly to produce three varying bit rate versions of the test sequence. It was necessary to control and align each adaptation in each of the test sequences used. During these tests, it is assumed that some mechanism is implemented that informs the streaming server of the required transmission bit rate.
Results Three scenarios were tested: First, the quality is adapted down from the best to worst; second, the quality is upgraded from worst to best; and third, the quality varies in an additive increase/multiplicative decrease fashion. The first two tests are complementary and are designed to assess symmetrical perception, that is, whether subjects perceive
Copyright © 2006, Idea Group Inc. Copying or distributing in print or electronic forms without written permission of Idea Group Inc. is prohibited.
256 Cranley & Murphy
quality increases and quality decreases uniformly. The third test is designed to test quality perception in a typical adaptive network environment. Of particular interest are the MOS scores when the quality is decreased.
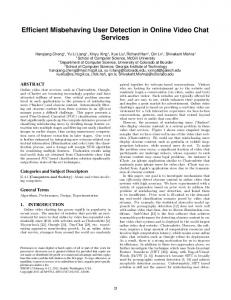
Additive Decrease Quality Adaptation In this test, the quality of the clip degrades from the best quality to the worst quality. Figure 8(a) shows the bit rate decreasing as the quality degrades. Figure 8(b) shows the encoding configuration of frame rate and resolution for each segment as the quality is adapting down in either the frame rate dimension only, or the resolution dimension only,
Figure 8. Time series during additive decrease (AD) in quality; (a) Segment average bit rate variations over time; (b) Video encoding parameter variations over time; (c) MOS Scores over time; (d) MOS Scores during period of lowest quality 350
Bit Rate (kbps)
300 250 200 150 100 50 0 0
15
30 45 60 Time (Sec)
75
90
(a)
(b)
(c )
(d)
Copyright © 2006, Idea Group Inc. Copying or distributing in print or electronic forms without written permission of Idea Group Inc. is prohibited.
Incorporating User Perception in Adaptive Video Streaming Systems
257
or using the OAT adapting down in both the frame rate and resolution dimensions. Through time interval 0-45 seconds, the resolution and frame rate dimensions are perceived the same (Figure 8(c). In time interval 45-60 seconds, there appears to be imperceptibility between a decrease in resolution from 80R to 70R. Using the OAT, there is a smooth decrease in the MOS scores, which outperforms both one-dimensional adaptation of frame rate and resolution. During time interval 45-60 seconds, there is high action in the content which may explain the sharp decrease in the MOS scores for adapting the frame rate only. When there is high action, subjects prefer smooth continuous motion. Further, when there is high action content, reductions in spatial resolution cannot be perceived as clearly as there is too much happening in the video clip for the detail to be perceived properly. Figure 8(d) shows a close up view of MOS
Figure 9. Time series during additive increase (AI) in quality; (a) Segment average bit rate variations over time; (b) Video encoding parameter variations over time; (c) MOS Scores over time; (d) MOS Scores during period of lowest quality
400
Bit Rate (kbps)
350 300 250 200 150 100 50 0 0
15
30 45 60 Time (Sec)
75
90
(a)
(b)
(c)
(d) Fr Only
Res Only
OAT
Copyright © 2006, Idea Group Inc. Copying or distributing in print or electronic forms without written permission of Idea Group Inc. is prohibited.
258 Cranley & Murphy
scores during the lowest quality level in time interval 70-90 seconds, the frame rate is perceived worst of all while the resolution performs very well. This may be due to the fact that the bit rate for the resolution is significantly greater than the two other methods. It was undesirable to achieve a lower bit rate for the resolution at 60%, as this would require a target bit rate to be set in the encoder.
Additive Increase Quality Adaptation In this test, the quality of the clip upgrades from the worst quality to the best quality. Figure 9(b) shows the encoding configuration of frame rate and resolution as the quality is adapting up in either the frame rate dimension only or the resolution dimension only or using the OAT adapting down in both the frame rate and resolution dimensions. During this experiment, the slider is placed at the highest quality value on the rating scale when the clip begins. It can be seen that it took subjects several seconds to react to the quality level and adjust the slider to the appropriate value (Figure 9(c)). At low quality, subjects perceive adaptation using the OAT better than one-dimensional adaptation. The quality is slowly increasing, however subjects do not seem to notice the quality increasing nor do they perceive it significantly differently – indicating that subjects are more aware of quality when it is low (Figure 9(d)).
AIMD Adaptation This section presents the results for AIMD adaptation, as might be expected from a TCPfriendly rate control mechanism. The same bit rate variation patterns were obtained in these three sequences by adapting quality in the frame rate dimension only, the spatial resolution dimension only, or both frame rate and spatial resolution dimensions, as shown in Figure 10(a). The traces in Figures 10(b) show the encoding configuration of frame rate or resolution for each segment as the quality was adapted in either the frame rate dimension only, or the resolution dimension only, or using the OAT adapting in both the frame rate and resolution dimensions. In Figure 10(a), it can be seen that although the first bit-rate reduction occurs at time 15 seconds, it is not fully perceived until time 28 seconds because there is a time delay for subjects to react to the quality adaptation. At time interval 70-90 seconds, a larger drop in bit rate occurs resulting in the lowest quality level that might reflect a mobile user entering a building. The MOS scores for adapting only the frame rate and spatial resolution are quick to reflect this drop. However, using the OAT, it takes subjects much longer to perceive this drop in quality. This is a high action part of the sequence and so the reduced frame rate is perceived more severely. The standard deviation of MOS scores using the OAT was much less than that for adapting frame rate only or spatial resolution only.
Copyright © 2006, Idea Group Inc. Copying or distributing in print or electronic forms without written permission of Idea Group Inc. is prohibited.
Incorporating User Perception in Adaptive Video Streaming Systems
259
Figure 10. Time series during additive increase multiplicative decrease (AIMD) in quality; (a) Segment average bit rate variations over time; (b) Video encoding parameter variations over time; (c) MOS Scores over time; (d) MOS Scores during period of lowest quality 400
Bit Rate (kbps)
350 300 250 200 150 100 50 0 0
25
50 75 100 125 150 Time (Sec)
(a)
(b)
(c)
(d) Fr Only
Res Only
OAT
Discussion From the experiments reported here, it appears that if a user’s average bit rate changes from being quite near their maximum to near the minimum that they can tolerate, then a one-dimensional adaptation policy will cause the perceived quality to degrade quite severely. Using the two-dimensional adaptation strategy given by the OAT allows the bit rate to be dropped quite dramatically but maintain substantially better user-perceived quality. In addition to the greater bit rate adaptation range achieved using the OAT, adaptation using the two-dimensional OAT out-performs one-dimensional adaptation using frame
Copyright © 2006, Idea Group Inc. Copying or distributing in print or electronic forms without written permission of Idea Group Inc. is prohibited.
260 Cranley & Murphy
rate or spatial resolution and reduces the variance of perception. From the various experiments conducted, subjects perceived adapting frame rate the worst, then resolution, and the OAT best of all. It was observed that there is a time delay of several seconds for subjects to react to quality adaptations. It was also observed that quality perception is asymmetrical when adapting the quality down and adapting quality up: Users are more critical of degradations in quality and less rewarding of increased quality. Similar observations were reported in Pinson and Wolf (2003). Perception is strongly dependent on the spatio-temporal characteristics of the content. Given this understanding of user-perception, adaptation algorithms should consider the contents characteristics when making adaptation decisions. Also, frequent quality adaptation should be avoided to allow the users to become familiar with the video quality. In the experiments, the globally-averaged OAT was used, but the OAT can be dynamic if the contents’ spatial and temporal characteristics are known at a given instant, thus making it more flexible to adapt according to the contents’ characteristics and maximize user-perceived quality. It is expected that a dynamic OAT that adapted on the changing complexity of the content would yield even higher MOS scores.
Summary This chapter provided a brief overview of adaptive streaming systems and identified key limitations of the techniques currently in use. Quite often, adaptation algorithms omit the user-perceived quality when making adaptation decisions. Recent work in multimedia adaptation has addressed this problem by incorporating objective video quality metrics into the adaptation algorithm, thereby making the adaptation process quality-aware. However, these objective metrics have limited efficacy in assessing the user-perceived quality. As a case study, we have focused on describing recent research that attempts to address both the limitations of objective video quality metrics and adaptation techniques. This work proposed that there is an Optimal Adaptation Trajectory (OAT), which basically states that there is an optimal way video should be adapted that maximizes the user-perceived quality. More specifically, within the set of different ways to achieve a target bit rate given by an adaptation algorithm, there exists an encoding that maximizes the user-perceived quality. Furthermore, the OAT is dependent on the spatio-temporal characteristics of the content. We have described a subjective methodology to discover the OATs through subjective testing, and applied it to finding OATs for various MPEG4 video clips. Further it was shown that using a two-dimensional adaptation strategy given by the OAT allows the bit rate to be dropped quite dramatically but maintain substantially better user-perceived quality over one-dimensional adaptation strategies. In addition to the greater bit rate adaptation range achieved using the OAT, adaptation using the two-dimensional OAT out-performs one-dimensional adaptation using frame rate or spatial resolution and reduces the variance of perception. Future work will assess the possibility of using and/or modifying existing objective metrics in order to mimic the OATs found by subjective methods and enable the
Copyright © 2006, Idea Group Inc. Copying or distributing in print or electronic forms without written permission of Idea Group Inc. is prohibited.
Incorporating User Perception in Adaptive Video Streaming Systems
261
development of a dynamic OAT. This will involve a greater analysis of the relationship between content characteristics and the corresponding OAT to determine the sensitivity of an OAT to the particular video being transmitted.
Acknowledgment The support of the Research Innovation Fund and Informatics Research Initiative of Enterprise Ireland is gratefully acknowledged.
References Chiu, D. M., & Jain, R. (1989). Analysis of the increase and decrease algorithms for congestion avoidance in computer networks. Elsevier Journal of Computer Networks and ISDN, 17(1), June 1989, 1-14. Cranley, N., Murphy, L., & Perry, P. (2003). User-perceived quality aware adaptive delivery of MPEG-4 content. Proceedings of the NOSSDAV’03, Monterey, California, June, 2003. Feamster, N., Bansal, D., & Balakrishnan, H. (2001). On the interactions between layered quality adaptation and congestion control for streamed video. Proceedings of Packet Video, 2001. Ghinea, G., Thomas, J. P., & Fish, R. S. (1999). Multimedia, network protocols, and users - Bridging the gap. Proceedings of ACM Multimedia ’99, Orlando, Florida, 1999 (pp. 473-476). Girod, B., (1993). What’s wrong with mean-squared error. In A. B. Watson (Ed.), Digital images and human vision (pp. 207-220). MIT Press. Hekstra, A. P., Beerends, J. G., et al. (2002). PVQM - A perceptual video quality measure. Signal Processing: Image Communication, 17(10), 781-798, 2002 Elsevier Science B.V. ITU-R Recommendation BT.500-7 (1996). Methodology for the subjective assessment of the quality of television pictures. ITU-T Recommendation J.143 (2000). User requirements for objective perceptual video quality measurements in digital cable television. ITU-T Recommendation J.144 (2001). Objective perceptual video quality measurement techniques for digital cable television in the presence of a full reference. ITU-T Recommendation J.148 (2003). Requirements for an objective perceptual multimedia quality model. ITU-T Recommendation J.149 (2004). Method for specifying accuracy and cross-calibration of Video Quality Metrics (VQM).
Copyright © 2006, Idea Group Inc. Copying or distributing in print or electronic forms without written permission of Idea Group Inc. is prohibited.
262 Cranley & Murphy
ITU-T Recommendation P.910 (1999). Subjective video quality assessment methods for multimedia applications. Masry, M., & Hemami, S. S. (2002). Models for the perceived quality of low bit rate video. IEEE International Conference on Image Processing (Rochester, NY), September 2002. Muntean, G. M., Perry, P., & Murphy, L. (2004). A new adaptive multimedia streaming system for all-IP multi-service networks. IEEE Transactions on Broadcasting, 50(1), March 2004. Pinson, M., & Wolf, S. (2003). Comparing subjective video quality testing methodologies. SPIE Video Communications and Image Processing Conference, Lugano, Switzerland, July, 2003. Turletti, T., & Huitema, C. (1996). Videoconferencing on the Internet. IEEE/ACM Transactions on Networking, 4(3), June 1996, 340-351. van den Branden Lambrecht, C. J. (1996). Color moving pictures quality metric. Proceedings of ICIP, Lausanne, Switzerland, 1996: Vol. 1 (pp. 885-888). van den Branden Lambrecht, C.J., & Verscheure, O. (1996). Perceptual quality measure using a spatio-temporal model of the human visual system. Proceedings of SPIE 96, San Jose, CA. Venkitaraman, N., Kim, T., Lee, K. W., Lu, S., & Bharghavan, V. (1999). Design and evaluation of congestion control algorithms in the future Internet. Proceedings of ACM SIGMETRICS’99, Atlanta, Georgia, May 1999. Video Quality Experts Group (VQEG) (2005). http://www.its.bldrdoc.gov/vqeg/. Wang, X., & Schulzrinne, H. (1999). Comparison of adaptive Internet applications. Proceedings of IEICE Transactions on Communications, E82-B(6), June 1999, 806-818. Wang, Y., Chang, S. F., & Loui, A. (2004). Subjective preference of spatio-temporal rate in video adaptation using multi-dimensional scalable coding. IEEE International Conference On Multimedia and Expo (ICME), Taipei, Taiwan, June 2004. Watson, A., & Sasse, M. A. (1998). Measuring perceived quality of speech and video in multimedia conferencing applications. Proceedings of ACM Multimedia ’98, 1216 September 1998, Bristol, England (pp. 55-60). Watson, A. B., Hu, J., & McGowan, J. F. (2000). DVQ: A digital video quality metric based on human vision. Journal of Electronic Imaging. Winkler, S. (1999). A perceptual distortion metric for digital color video. Proceedings of the SPIE, San Jose, CA, 1999: Vol. 3644 (pp. 175-184). Wolf, S., & Pinson, M. (1999). Spatial-temporal distortion metrics for in-service quality monitoring on any digital video system. SPIE International Symposium on Voice, Video, and Data Communications, Boston, MA, Sept. 11-22, 1999. Wu, D., Hou, T., Zhu, W., Lee, H. J., Chiang, T., Zhang, Y.Q., & Chao, H. J. (2002). MPEG4 video transport over the Internet: A summary. IEEE Circuits and Systems Magazine, 2(1), 43-46.
Copyright © 2006, Idea Group Inc. Copying or distributing in print or electronic forms without written permission of Idea Group Inc. is prohibited.
Incorporating User Perception in Adaptive Video Streaming Systems
263
Wu, D., Hou, Y. T., Zhu, W., Lee, H. J., Chiang, T., Zhang, Y. Q., & Chao, H. J. (2000). On end-to-end architecture for transporting MPEG-4 video over the Internet. IEEE Transactions on Circuits and Systems for Video Technology, 10(6), Sept. 2000. Yu, Z., & Wu, H. R. (2000). Human visual system based objective digital video quality metrics. Proceedings of the International Conference on Signal Processing of IFIP World Computer Conference 2, Aug. 2000 (pp. 1088-1095).
Copyright © 2006, Idea Group Inc. Copying or distributing in print or electronic forms without written permission of Idea Group Inc. is prohibited.