Galley Proof
16/02/2005; 11:06
File: bio762.tex; BOKCTP/ljl p. 1
BioFactors 15 (2005) 1–11 IOS Press
1
Increase in selenium requirements with physical activity loads in well-trained athletes is not linear Ir`ene Margaritisb,∗, Anne-Sophie Rousseaua , Isabelle Hiningera, St´ephane Palazzettib , Josiane Arnauda and Anne-Marie Roussela a Laboratoire
“Nutrition, Vieillissement et Maladies Cardio-vasculaires”, Universit e´ Joseph Fourier, Domaine de la Merci, La Tronche, France b Laboratoire Physiologie des Adaptations, Performance Motrice et Sant e ´ , Universit´e de Nice-Sophia-Antipolis, France Received 23 November 2004 Revised 31 December 2004 Accepted 06 January 2005 Abstract. Selenium requirements in athletes are supposed to be increased with energy expenditure (EE) to preserve selenium status and an optimal antioxidant balance. The question of whether selenium intakes are related to EE and whether plasma selenium status induces up-regulation in erythrocyte endogenous antioxidant defense and decreases plasma oxidative damage markers in athletes was addressed. 118 well-trained athletes completed 7 d food and activity records in a cross-sectional study. Blood was sampled on day 8. Among the athletes, 23% of the males and 66% of the females had Se intakes below two-third of the FRDAa. Plasma Se concentrations in most of less trained athletes were lower than the postulated concentration to be required to maximize erythrocyte GSH-Px activity. Athletes with the highest daily EE had the highest selenium intakes, percentage of vegetal protein intakes and plasma selenium concentrations. Only 2.6% of the athletes exhibited low plasma selenium concentrations (< 0.75 µmol/l). The relation between plasma selenium and EE was polynomial (r = 0.50; P < 0.005). Erythrocyte GSH-Px activity in athletes was not linked to selenium status. Selenium requirements are increased in athletes without being linearly related to EE. Keywords: Iipid peroxidation, glutathione reductase, glutathione peroxidase, thiols, oxidative stress, superoxide dismutase
1. Introduction It is well established that in response to chronic aerobic exercise training, the magnitude of increase in oxidative enzyme activities is higher than the relative increase in antioxidant defenses [1]. This observed mismatch between oxidant and antioxidant potential has led to consider athletes to be highly exposed to oxidative damages. However, the adaptive response of the endogenous antioxidant system to exercise training also depends on nutritional factors [2,3] and that could explain why in many studies ∗
Address for correspondence: Ir`ene Margaritis, Facult´e des Sciences du Sport, Universit´e de Nice-Sophia-Antipolis, 261 Route de Grenoble, BP 3259, 06205 Nice Cedex 3, France. Tel.: +33 4 92 29 65 02; Fax: +33 4 92 29 65 49; E-mail:
[email protected]. 0951-6433/03/$8.00 2005 – IOS Press. All rights reserved
Galley Proof
2
16/02/2005; 11:06
File: bio762.tex; BOKCTP/ljl p. 2
I. Margaritis et al. / Selenium intakes and status in athletes Table 1 Characteristics of the subjects according to EE groups Cat. 0 Cat. 1 Cat. 2 Cat. 3 (n = 16) (n = 62) (n = 44) (n = 12) Age (yr) 25.5 ± 4.5 25.5 ± 7.0 28.2 ± 6.8 30.4 ± 5.9 BMI (kg/m2 ) 22.1 ± 1.8 22.0 ± 2.7 22.9 ± 2.4 22.3 ± 1.4 Total cholesterol (mg/dl) 1.31 ± 0.49 1.10 ± 0.35 1.01 ± 0.29 1.18 ± 0.33 Training loads (hr/wk) 0 9 ± 3∗ 14 ± 5∗∗ 17 ± 4∗∗∗ ∗ ∗∗ EI (MJ/d) 8.64 ± 2.34 9.97 ± 2.14 12.76 ± 3.16 17.83 ± 2.23∗∗∗ Category 0: sedentary; Category 1: 9.20 (2197) to 12.96 (3096) MJ (kcal) EE/d; Category 2: 12.96 (3096) to 16.72 (3994) MJ (kcal) EE/d; Category 3: > 16.72 (3994) MJ (kcal) EE/d. EE, daily total energy expenditure; BMI, body mass index; EI: daily energy intake. ∗∗∗ P < 0.05: mean value was significantly different from other categories. ∗∗ P < 0.05: mean value was significantly different from Category 0 and 1. ∗ P < 0.05: mean value was significantly different from Category 0.
plasma lipid peroxidation markers in athletes were not higher compared to sedentary subjects [4–6]. Among antioxidant micronutrients, selenium (Se) supplementation might produce beneficial effects for individuals undergoing high exercise training given data from animal study [7]. Se constitutes the active center of the antioxidant enzyme glutathione peroxidase (GSH-Px), which has an important role in the reduction of peroxides in the cell. The estimation of Se requirements has been based on intakes that maximize activities of GSH-Px [8] since GSH-Px was supposed to be the selenoprotein that is most sensitive to Se deficiency [9]. However, it is still unknown whether Se intakes are linearly linked to erythrocyte GSH-Px activity in athletes. Antioxidant defense components including erythrocyte GSH-Px are widely determined by exposure to oxygen [see for review 10] and depend on the activation of signaling pathways [11]. Plasma Se concentrations were not shown to vary, despite an increase in erythrocyte GSH-Px activity, in response to aerobic exercise training in previously sedentary subjects [12]. Some studies had put into evidence a linear increase of erythrocyte GSH-Px activity in athletes with training loads [4,13]. French Recommended Dietary Allowances (FRDA) for athletes have been adjusted in a linear way for daily energy expenditure (EE) by adding 30 µg/d when daily EE exceeds 9.21 MJ/d for males and 7.72 MJ/d for females [14]. However, this relation was not demonstrated. Therefore, the question of whether Se intakes are related to EE and whether Se status induces an up-regulation in endogenous antioxidant defense and a decrease in oxidative damage markers in athletes was addressed in this study.
2. Material and methods 2.1. Subjects and design One hundred and eighteen competitive athletes (84 males, 34 females) and 16 sedentary subjects (8 males, 8 females) participated in a cross-sectional study. Characteristics of the subjects are presented in Table 1. Athletes were selected in reference to their practice level and during a steady state with concern to the training period. Food and activities records (7-d) were completed during this period by each subject to quantify nutrient intakes and daily EE respectively. We selected athletes having a regional to international level of competition, staging exercise training session no less than 3 exercise training sessions per week, each exercise training session lasting > 1 h. As a control group, sedentary subjects with no regular physical activity for a minimum of 3 years were
Galley Proof
16/02/2005; 11:06
File: bio762.tex; BOKCTP/ljl p. 3
I. Margaritis et al. / Selenium intakes and status in athletes
3
selected. None of the subjects used any vitamin and trace-element supplements. We excluded smokers, alcohol drinkers, subjects submitted to hypo- or hyper-energetic diets, subjects with a body-mass index (BMI) superior to 35, subjects with family history of CHD and subjects treated by anti-inflammatory or by any therapeutic containing antioxidants or modifying nutritional habits. Participants were all asked to maintain their normal lifestyle during the 7-d follow-up. The follow-up of female subjects was restricted to a lap of time, from the seventh to the fourteenth day of their menstrual cycle. The survey was developed in agreement with the declaration of Helsinki of 1975 that was revised in 1989. The survey received the approval of the protective Committee of People in the Biomedical Research (n◦ 02.002). Subjects were informed of the nature and the progress of the study before giving their formal consent. 2.2. Diet and activity record A 7-d food record and a 7-d activities diary representative of typical exercise training days were completed by each subject on a notebook. At the start, a standardized individual information session was organized to give instructions to each subject on how to record their daily food intakes. Food quantities were estimated, specifying the number of units and a code corresponding to the size of the portion, using a validated portion guideline book [15]. Parallel with the food record, subjects kept a 7-d activity record. Activities were broken down into five groups: 1) personal activities, 2) home and leisure activities, 3) physical locomotion, 4) trade, education or volunteer group activities and 5) exercise training. A scale of intensity was included. Subjects reported their body mass each morning in the same conditions to ensure stability of energy balance. After the 7-d recording, diet and activities recalls (24 h) were carried out face-to-face by trained interviewers – all of them were experts in nutrition – and lasted on average 30 min. The average macronutrients and riboflavin (cofactor of glutathione reductase (GR)) intakes was calculated using Regal Micro software (Version 1.2, Max Feinberg, France). Intakes of Se and copper were estimated using a French database [16]. Because of the lack of details of this table, we used values corresponding to food groups for some foods not represented in the table. Intakes referred to the French RDA for physically active people (FRDAa) based on additional needs for daily EE exceeding 9.21 (2200) MJ (kcal) for males and exceeding 7.72 (1800) MJ (kcal) for females, which have been recently established by the “French Food Agency of Security and Health” [14]. The Compendium of Physical Activities [17] was used to provide the energy cost of physical activity expressed as metabolic equivalents (METs). The appropriate MET values – based on the subject’s report of the type and intensity of their activity – were assigned. EE was calculated using a computer program specifically designed for this task. Any activity that could not be found in the database was carefully evaluated as to determine the most appropriate corresponding activity. 2.3. Constitution of the groups Firstly, subjects were divided into the following four categories according to their EE: Category 0: sedentary; Category 1: 9.20 (2197) to 12.96 (3096) MJ (kcal) EE/d; Category 2: 12.96 (3096) to 16.72 (3994) MJ (kcal) EE/d; Category 3: > 16.72 (3994) MJ (kcal) EE/d. Secondly, because groups of EE were not homogeneous regarding gender and type of performed activity, we controlled the interaction effect of those factors by dividing subjects into groups made according to gender and to the main energy pathway used for the type of performed activity (Sedentary (SED), Anaerobic (ANA), Aerobic (AE), and Intermittent (INT)). Subjects in ANA group were mainly sprint exercise training athletes, in AE group were mainly cyclists, triathletes and runners, and in INT group were mainly soccer, rugby, handball, ice-hockey and water-polo players.
Galley Proof
4
16/02/2005; 11:06
File: bio762.tex; BOKCTP/ljl p. 4
I. Margaritis et al. / Selenium intakes and status in athletes
2.4. Blood samples and assays Venous blood samples were collected in basal condition on day 8. Blood samples were collected from the antecubital vein in Vacutainer lithium and sodium heparinized tubes (Becton Dickinson, Le pont de Claix, France) following a night fast and at least 12 h following the last exercise session, between 8 and 10 a.m. The day before this blood sampling, subjects were permitted only light exercise training. Tubes were centrifuged immediately after the sampling for 10 min at 3000 g. The plasma and erythrocyte fractions were then transferred to cryotubes and to specific metal-free tubes for measurement of plasma Se. Cryotubes were kept at −80 ◦C and metal-free tubes were kept at −20 ◦ C, until measurement 6 months later. Samples were run in duplicate. Plasma Se concentrations were determined using a Perkin Elmer 5100 (Norwalk, CT) equipped with an HGA 600 furnace, an electron discharge lamp and a Zeeman background correction [18]. Erythrocyte GSH-Px activity was evaluated using terbutyl hydroperoxide (Sigma Chemical Co, Via Coger, Paris, France) as substrate instead of hydrogen peroxide [19]. This technique was adapted on a Hitachi 904 analyzer. Results are expressed as µmoles of NADPH (Boehringer-Mannheim, Germany) oxidized per min per g of hemoglobin. Erythrocyte Cu-Zn SOD activity was measured after hemoglobin precipitation by monitoring the auto-oxidation of pyrogallol [20]. This technique was also adapted on a Hitachi 904 analyzer. Erythrocyte GR was determined as described by Thurnham et al. [21]. Plasma thiol groups (SH groups) were assayed in 100 µl of plasma, using 5,5’-dithiobid (2-nitrobenzoic acid) for derivating the SH groups. Absorbance was measured at 412 nm [22]. Plasma thiobarbituric reactive substances (TBARS) were determined as described by Richard et al. [23] using the fluorimetric determination of malondialdehyde-thiobarbituric acid (MDA-TBA) complex after extraction with n-butanol. 2.5. Statistics Values are expressed as mean and standard deviations (mean ± SD). Factorial ANOVA tests were performed for comparisons between EE groups. In addition, factorial ANOVA tests were performed to determine the extent of interacting effect between gender, type of performed activity and EE. In this analysis, EE was introduced as a covariate. If significant differences were found, Fisher’s protected least significant difference post hoc test was applied to locate the source of significant difference. Moreover, bivariate associations between continuous variables were assessed by linear or polynomial regression analysis. Analyses were performed with StatView Abacus Concept version 5 software. Statistical significance level was set at P < 0.05. 3. Results Energy intake (EI) was positively correlated to EE (r = 0.65; P < 0.0001; AE = 0.91 × EE −100). Macronutrients, Se, copper and riboflavin intakes are presented in Table 2. The percentage of EI derived from carbohydrates, the protein intake expressed in g/kg of body weight per day and the percentage of protein intakes derived from vegetal origin were significantly higher in the group of EE > 16.72 (3994) MJ/d (kcal/d) (Table 2). Factorial ANOVA test evidenced an increase of Se intakes with EE (Table 2). A significant polynomial relation between Se intakes and EE (r = 0.68; P < 0.0001) was observed in athletes. A marked increase
Galley Proof
16/02/2005; 11:06
File: bio762.tex; BOKCTP/ljl p. 5
I. Margaritis et al. / Selenium intakes and status in athletes
5
Table 2 Daily nutrients intakes in sedentary subjects and in athletes according to EE groups Cat. 0 Cat. 1 Cat. 2 Cat. 3 (n = 16) (n = 62) (n = 44) (n = 12) Carbohydrates (g) 231 ± 70 275 ± 72 372 ± 104∗∗ 563 ± 118∗∗∗ Protein (g) 81 ± 21 96 ± 25∗ 119 ± 29∗∗ 158 ± 26∗∗∗ ∗ Protein (g/kg) 1.36 ± 0.38 1.53 ± 0.44 1.64 ± 0.43 1.98 ± 0.37∗∗∗ Vegetal protein (% protein) 31 ± 6 35 ± 12 37 ± 9 48 ± 17∗∗∗ Animal protein (% protein) 69 ± 6 65 ± 12 63 ± 9 52 ± 17∗∗∗ Fat (g) 85 ± 30 90 ± 30 116 ± 34∗∗ 130 ± 25∗∗ Carbohydrates (% of EI) 43.4 ± 5.0 46.9 ± 7.4 47.9 ± 5.9∗ 54.7 ± 8.0∗∗∗ Protein (% of EI) 16.5 ± 2.4 16.5 ± 3.3 16.0 ± 3.7 14.9 ± 1.8 Fat (% of EI) 35.9 ± 6.0 34.0 ± 7.1 33.8 ± 5.3 29.0 ± 7.3 Se (µg) 57 ± 13 59 ± 22 77 ± 21∗∗ 128 ± 20∗∗∗ Copper (mg) 1.12 ± 0.5 1.10 ± 0.33 1.64 ± 0.76∗∗ 1.96 ± 0.61∗∗∗ Riboflavin (mg) 1.85 ± 1.78 2.14 ± 1.32 2.5 ± 1.13 3.98 ± 2.32∗∗∗ Category 0: sedentary; Category 1: 9.20 (2197) to 12.96 (3096) MJ (kcal) EE/d; Category 2: 12.96 (3096) to 16.72 (3994) MJ (kcal) EE/d; Category 3: > 16.72 (3994) MJ (kcal) EE/d. ∗∗∗ P < 0.05: mean value was significantly different from other categories. ∗∗ P < 0.05: mean value was significantly different from Category 0 and 1. ∗ P < 0.05: mean value was significantly different from Category 0.
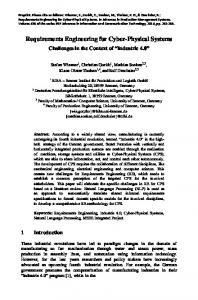
Fig. 1. Polynomial regression between Se intakes and daily EE in athletes. BS 1: breaking slope 1 corresponds to 75 µg/d (Se) and 14.7 MJ/d (EE).
in Se intakes in relation to EE, above 75 µg/d, was evidenced for an EE of above 14.7 (3500) MJ/d (kcal/d) (Fig. 1). Se FRDAa corresponds to an intake of 60 µg/d plus 30 µg/d per additional 4.19 (1000) MJ/d (kcal/d) of EE up to 9.21 (2200) MJ/d (kcal/d) for males or 7.54 (1800) MJ/d (kcal/d) of EE for females. 23% of male athletes and 66% of female athletes had Se intakes below two-third of the FRDAa. Moreover, 22.7% of female athletes and 3.3% of male athletes had Se intakes below the FRDA for non-athletes subjects (50 µg for females and 60 µg/d for males). Only 2.6% percent of athletes exhibited low Se concentrations (< 0.75 µmol/l). Plasma Se concentrations were higher in the athletes group with EE > 16.7 (3994) MJ/d (kcal/d) (Table 2). The relation between plasma Se concentrations and EE in athletes was also polynomial (r = 0.50; P < 0.0001). A marked increase in plasma Se concentrations in relation to EE was evidenced beyond 15.5 (3700) MJ/d
Galley Proof
6
16/02/2005; 11:06
File: bio762.tex; BOKCTP/ljl p. 6
I. Margaritis et al. / Selenium intakes and status in athletes Table 3 Plasma selenium concentrations, erythrocyte antioxidant enzyme activities, and markers of oxidation in sedentary subjects and in athletes according to EE groups Cat. 0 Cat. 1 Cat. 2 Cat. 3 (n = 16) (n = 62) (n = 44) (n = 12) Se (µmol/l) 0.93 ± 0.18 1.00 ± 0.19 0.99 ± 0.16 1.26 ± 0.25∗ Cu-Zn SOD (U/mg Hb) 1.37 ± 0.11 1.36 ± 0.12 1.34 ± 0.16 1.36 ± 0.10 GSH-Px (U/g Hb) 40.6 ± 5.3 44.9 ± 10.1 41.9 ± 9.7 45.75 ± 17.02 GR (U/g Hb) 3.212 ± 0.523 3.637 ± 0.773 3.692 ± 1.054 3.962 ± 1.184 TBARS (µmol/l) 2.84 ± 0.32 2.81 ± 0.50 2.66 ± 0.54 2.54 ± 0.31 SH groups (µmol/g prot) 5.49 ± 0.59 5.30 ± 0.81 5.31 ± 0.33 5.49 ± 0.59 Cu-Zn-SOD, erythrocyte superoxide dismutase activity; GSH-Px, erythrocyte glutathione peroxidase activity; GR, erythrocyte glutathione reductase activity; TBARS, plasma thiobarbituric acid reactive substances concentration; SH group, plasma total thiol groups concentration. Category 0: sedentary; Category 1: 9.20 (2197) to 12.96 (3096) MJ (kcal) EE/d; Category 2: 12.96 (3096) to 16.72 (3994) MJ (kcal) EE/d; Category 3: > 16.72 (3994) MJ (kcal) EE/d. Mean value was significantly different from that of other categories (protected least squares difference Fisher post hoc test): ∗ P < 0.05.
(kcal/d) of EE (Fig. 2). The selenium concentration/intake ratio was decreased with EE (r = −0.41; P < 0.0001) (Fig. 3). No effect of EE and/or Se status was observed on erythrocyte GSH-Px activity, even after controlling gender and type of performed activity (Table 4). Moreover, even after adjustment for copper intakes, no effect of EE was shown on erythrocyte Cu-Zn SOD activity. An interaction effect between EE and the type of performed activity was observed on erythrocyte GR activity. However, this effect was no longer significant after adjustment for riboflavin intakes (Table 4). Plasma TBARS and SH groups concentrations were not significantly different among EE, gender and type of performed activity groups, and were not related to Se status (Tables 3 and 5). 4. Discussion The question of whether Se intakes are related to EE and whether Se status induces up-regulation in the endogenous antioxidant defense and decrease in oxidative damage markers in athletes was addressed in this study. We put into evidence that the group of subjects with the highest daily EE – the more “exposed” group to oxidative stress – had both the highest Se intakes and the highest plasma Se concentrations in comparison to the other groups. As it is also put into evidence by the non-linear correlation between EE and Se intakes (Fig. 1), highly trained subjects – who are certainly more concerned about their diets – increased their daily dietary Se supply without taking supplements. The adoption of an energy balanced diet allowed daily Se intakes > 75 µg/d when daily EE exceeded 14.7 (3500) MJ/d (kcal/d). However, the marked increase in plasma Se concentrations was shown in athletes with higher EE (> 15.5 (3700) MJ/d (kcal/d)) (Fig. 2). Subjects with the highest EE had a higher percentage of protein intakes derived from plants in comparison to the other group. It is known that Se in plant diets is mostly derived from selenomethionine [24] whereas animal-derived food contains Se from both selenocysteine and selenomethionine [8]. So it would appear that the difference of Se intakes observed between the highest EE group and the medium EE group was mainly due to higher Se intakes in the chemical form of selenomethionine. It is known that, when dietary selenomethionine intakes increase, the fraction which is not incorporated into real selenoproteins is found in serum albumin or is incorporated into tissues with
Galley Proof
8
16/02/2005; 11:06
File: bio762.tex; BOKCTP/ljl p. 7
I. Margaritis et al. / Selenium intakes and status in athletes
Fig. 2. Polynomial regression between plasma Se concentrations and daily EE in athletes. BS 2: breaking slope 2 corresponds to 1.05 µmol/L (Se) and 15.5 MJ/d (EE).
Fig. 3. Linear regression between Se concentration/intake ratio and EE in athletes.
high rate of protein synthesis such as muscles and erythrocytes [25]. It can be postulated that the plasma Se concentrations increase observed in the highest EE group may indicate a saturated exchangeable pool of Se. This assumption is reinforced by the fact that the Se concentration/intake ratio was inversely correlated to EE in our study (Fig. 3). It is known that, as dietary Se intakes increase, the rate of urinary and faecal Se excretion is increased [26]. As an adaptive response to the increase in dietary Se intake, a decrease in absorption and/or an increase in urinary and faecal excretions may allow athletes to retain a much lower percentage of dietary Se intakes. However, this retention may be insufficient to fully return to plasma homeostasis in case of high Se intakes [26,27]. Moreover, the amount of Se incorporated into muscles, the main reserve of Se, is saturated with a Se rich diet [28]. This could explain why plasma Se concentrations were higher in the highest EE group. Together, high Se intakes and high EE induced the increase in plasma Se concentrations. Another way
Galley Proof
16/02/2005; 11:06
File: bio762.tex; BOKCTP/ljl p. 8
I. Margaritis et al. / Selenium intakes and status in athletes
9
of adapting to intakes in response to EE increase may be through selenoprotein synthesis. When dietary intake of Se is deficient, selenomethionine is converted into selenocysteine and used for selenoproteins synthesis such as GSH-Px. As erythrocyte GSH-Px activity was reported to depend on both chronic exercise stimulation [4,5,13] and Se status [8], we could have expected that erythrocyte GSH-Px activity would vary through a balance between Se status and EE in athletes. However, in our study, erythrocyte GSH-Px activity was not related to plasma Se in any of the EE groups despite a large range of plasma Se concentrations (0.48–2.01 µmol/l). Even if the population was divided with respect to gender and type of performed activity, the expected relationship could not be evidenced. Plasma and erythrocyte GSH-Px activities have been shown to reach a plateau at plasma Se concentrations of 1.15 µmol/l [29]. However, although most athletes exhibited lower plasma Se concentrations, their erythrocyte GSH-Px activity was not closely dependent on Se status. The higher erythrocyte GSH-Px activity observed in females – who were all recruited in the late follicular phase, in order to avoid the effects of modulation of antioxidant enzymes by sex steroids [30], menstrual phase-related fluctuations of erythrocyte GSHPx activity and plasma selenium concentrations [31] – was neither linked to Se status nor to EE. This supports the hypothesis of gender-dependant variations of GSH-Px activity, even in athletes. In addition, physical training may introduce additional factors, mostly considered to represent adaptive responses to exercise-induced oxidative stress [6,10–12]. In our study, the adaptive state of athletes, depending on the exercise training phase (i.e. overwhelm, tapering), could also modulate the antioxidant system independently of the EE [2]. Several studies have shown that oxidative stress or other stressful events led to the enhancement of endogenous defense systems via up-regulated expression of heat shock proteins or antioxidant enzymes [11,32] by the activation of signaling pathways. Some selenoproteins (eg. selenoprotein R, and thioredoxin reductase), which participate in the reduction of oxidized methionine residues [33,34], could be investigated for their antioxidant function related to physical activity loads. Moreover, gene expression of the selenoprotein W, a glutathione dependent antioxidant which is mainly present in skeletal muscle [35], is decreased with hypokinesia [36], suggesting a modulation of its expression by physical activity. During Se depletion, Se was shown to leak from muscle and to be deposited in tissues with a higher metabolic priority for Se such as testes, brain and endocrine organs [26, 37]. Priority for Se metabolism, and in consequence the repartition of Se into tissues for selenoproteins synthesis, may be different in athletes under oxidative stress exposure. We did not put into evidence any effect of EE and/or Se status on the lipid peroxidation marker. Exercise associated with dietary Se deficiency has no direct effect on lipoperoxidation despite a decrease in muscle GSH-Px activity [38] but can inhibit the production of thiol-containing enzymes [7]. Plasma total SH groups were not different between groups in our study. Our results differed from those of Bergholm et al. [39] who reported a decrease in total serum SH group concentrations in response to 3 months of running training with most of exogenous antioxidants concomitantly decreased. This is not the case in our study, likely because the well-trained subjects, as already shown previously [40], tend to adopt a better food quality, which could explain that no difference between EE groups was found. The noticeable up-regulation of the erythrocyte GR activity – the other enzyme of the glutathione-cycle – was no longer significant after the adjustment for riboflavin intakes. This confirms that GR variability closely depends on riboflavin status in athletes [41,42]. The lack of concomitant increase of erythrocyte GSH-Px and Cu-Zn SOD activities, together with the lack of high oxidative damage markers, might be interpreted to indicate that the antioxidant defense in erythrocyte is sufficient to cope with enhanced free radical production. under high exercise training stress.
Galley Proof
10
16/02/2005; 11:06
File: bio762.tex; BOKCTP/ljl p. 9
I. Margaritis et al. / Selenium intakes and status in athletes
5. Conclusion There is no evidence that a regular high volume of exercise training would result in a linear increase of dietary Se requirements with EE. Highly trained subjects adopted a high Se diet naturally, that allows reaching a high Se status. However, most of less trained athletes exhibited plasma Se concentrations below the concentration postulated to be required to maximize erythrocyte GSH-Px activity, and Se intakes for a part of athletes were lower than the FRDA for non-athletes subjects. Exercise training may introduce additional factors inducing adaptative responses of antioxidant system components. The hierarchy of Se incorporation into selenoproteins and distribution in tissues can be suspected to be different in athletes compared to sedentary subjects. This study may help to reinterprete previous data and to establish more reliable values for the French RDA for athletes. Acknowledgements We thank C. Garrel and her staff for measuring erythrocyte GSH-Px and SOD activities, M. Osman and A. Aubourg for technical assistance, P. Afriat for his medical assistance and Merck Laboratories (Dijon, France) for financial support. References [1] [2] [3] [4] [5] [6] [7] [8] [9] [10] [11] [12] [13] [14] [15]
M. Higuchi, L.J. Cartier, M. Chen and J.O. Holloszy, Superoxide dismutase and catalase in skeletal muscle: adaptive response to exercise, J Gerontol 40 (1985), 281–286. I. Margaritis, S. Palazzetti, A.S. Rousseau, M.J. Richard and A. Favier, Antioxidant supplementation and tapering exercise improve exercise-induced antioxidant response, J Am Coll Nutr 22 (2003), 147–156. S. Palazzetti, A.S. Rousseau, M.J. Richard, A. Favier and I. Margaritis, Antioxidant supplementation preserves antioxidant response in physical training and low antioxidant intake, Br J Nutr 91 (2004), 91–100. J.D. Robertson, R.J. Maughan, G.G. Duthie and P.C. Morrice, Increased blood antioxidant systems of runners in response to training load, Clin Sci 80 (1991), 611–618. H. Miyazaki, S. Oh-ishi, T. Ookawara, T. Kizaki, K. Toshinai, S. Ha, S. Haga, L.L. Ji and H. Ohno, Strenuous endurance training in humans reduces oxidative stress following exhausting exercise, Eur J Appl Physiol 84 (2001), 1–6. R. Cazzola, S. Russo-Volpe, G. Cervato and B. Cestaro, Biochemical assessments of oxidative stress, erythrocyte membrane fluidity and antioxidant status in professional soccer players and sedentary controls, Eur J Clin Invest 33 (2003), 924–930. J.C. Soares, V. Folmer and J.B. Rocha, Influence of dietary selenium supplementation and exercise on thiol-containing enzymes in mice, Nutrition 19 (2003), 627–632. C.D. Thomson, Assessment of requirements for selenium and adequacy of selenium status: a review, Eur J Clin Nutr 58 (2004), 391–402. D.L. Hatfield and V.N. Gladyshev, How selenium has altered our understanding of the genetic code, Mol Cell Biol 22 (2002), 3565–3576. K.B. Storey, Oxidative stress: animal adaptations in nature, Braz J Med Biol Res 29 (1996), 1715–1733. L.Z. Zhou, P.A. Johnson and T.A. Rando, NF Kappa B and AP-1 mediate transcriptional responses to oxidative stress in skeletal muscle cells, Free Rad Biol Med 31 (2001), 1405–1411. F. Tessier, I. Margaritis, M.J. Richard, C. Moynot and P. Marconnet, Selenium and training effects on the glutathione system and aerobic performance, Med Sci Sports Exerc 27 (1995), 390–396. I. Margaritis, F. Tessier, M.J. Richard and P. Marconnet, No evidence of oxidative stress after a triathlon race in highly trained competitors, Int J Sports Med 18 (1997), 186–190. J.C. Guilland, I. Margaritis, B. Melin, G. P´er`es, J.P. Richalet and P.P. Sabatier, Sportsmen and subjects with high physical activity, in: French population recommended dietary allowance, A. Martin, ed., Tec and Doc, Paris, 2001, pp. 337–394. N. Le Moullec, M. Deheeger, P. Preziosi, P. Montero, P. Valeix, M.F. Rolland-Cachera, G. Potier de Courcy, J.P. Christides, P. Galan and S. Hercberg, Validation of the photo manual used for the collection of dietary data in the SU.VI.MAX Study, Cah Nutr Diet 31 (1996), 158–164.
Galley Proof
16/02/2005; 11:06
File: bio762.tex; BOKCTP/ljl p. 10
I. Margaritis et al. / Selenium intakes and status in athletes [16] [17] [18] [19] [20] [21] [22] [23] [24] [25] [26] [27] [28] [29] [30] [31] [32] [33] [34] [35] [36] [37] [38] [39] [40] [41] [42]
11
M. Lamand, J.C. Tressol, J. Ireland-Ripert, J.C. Favier and M. Feinberg, R´epertoire g´en´eral des aliments (Tome 4): table de composition min´erale, ed., Tec and Doc, INRA, Paris, 1996. B.E. Ainsworth, W.L. Haskell, M.C. Whitt, M.L. Irwin, A.M. Swartz, S.J. Strath, W.L. O’Brien, D.R. Bassett, K.H. Schmitz, P.O. Emplaincourt, D.R. Jacobs and A.S. Leon, Compendium of physical activities: an update of activity codes and MET intensities, Med Sci Sports Exerc 32 (2000), S498–S504. J. Arnaud, A. Prual, P. Preziosi, A. Favier and S. Hercberg, Selenium determination in human milk in Niger: influence of maternal status, J Trace Elem Electrolytes Health Dis 7 (1993), 199–204. W.A. Gnzler, H. Kremers and L. Floh´e, An improved coupled test procedure for glutathione peroxidase (EC 1.11.1.9.) in blood, Z Klin Chem Klin Biochem 12 (1974), 444–448. S. Marklund and G. Marklund, Involvement of the superoxide anion radical in the autoxidation of pyrogallol and a convenient assay for superoxide dismutase, Eur. J. Biochem. 47 (1974), 469–474. D.I. Thurnham and P. Rathakette, Incubation of NAD(P)H2: glutathione oxidoreductase (EC 1.6.4.2.) with flavin adenin dinucleotide for maximal stimulation in the measurement of riboflavin status, Br J Nutr 48 (1982), 459–466. P. Faure and J.L. Lafond, Measurement of plasma sulfhydryl and carbonyl groups as a possible indicator of protein oxidation, in: Analysis of Free Radicals in Biology Systems, A.E. Favier, J. Cadet, B. Kalnyanaraman, M. Fontecave and J.L. Pierre, eds, Basel, Boston, Berlin: Birkh¨auser Press, 1995, pp. 237–248. M.J. Richard, B. Portal, J. Meo, C. Coudray, A. Hadjian and A. Favier, Malondialdehyde kit evaluated for determining plasma and lipoprotein fractions that react with thiobarbituric acid, Clin Chem 38 (1992), 704–709. W.R. Wolf and H. Zainal, Methylseleno-amino acid content of food materials by stable isotope dilution mass spectrometry, Food Nutr Bull 23 (2002), S120–123. G.N. Schrauzer, Selenomethionine: a review of its nutritional significance, metabolism and toxicity, J Nutr 130 (2000), 1653–1656. W.C. Hawkes, F.Z. Alkan and L. Oehler, Absorption, distribution and excretion of selenium from beef and rice in healthy North American men, J. Nutr. 133 (2003), 3434–3442. M. Janghorbani, Y. Xia, P. Ha, P.D. Whanger, J.A. Butler, J.W. Olesik and L. Daniels, Metabolism of selenite in men with widely varying selenium status, J Am Coll Nutr 18 (1999), 462–469. K.J. Hintze, G.P. Lardy, M.J. Marchello and J.W. Finley, Selenium accumulation in beef: effect of dietary selenium and geographical area of animal origin, J Agric Food Chem 50 (2002), 3938–3942. A.J. Duffield, C.D. Thomson, K.E. Hill and S. Williams, An estimation of selenium requirements for New Zealanders, Am J Clin Nutr 70 (1999), 896–903. R.E. Pinto and W. Bartley, The nature of the sex-linked differences in glutathione peroxidase activity and aerobic oxidation of glutathione in male and female rat liver, Biochemistry 115 (1969), 449–456. E.J. Ha and A.M. Smith, Plasma selenium and plasma and erythrocyte glutathione peroxidase activity increase with estrogen during the menstrual cycle, J Am Coll Nutr 22 (2003), 43–51. C. Vergely, C. Perrin, A. Laubriet, A. Oudot, M. Zeller, J.C. Guilland and L. Rochette, Postischemic myocardial recovery and oxidative stress status of vitamin C deficient rat hearts, Cardiovasc Res 51 (2001), 89–99. K.E. Hill, G.W. McCollum, M.E. Boeglin and R.F. Burk, Thioredoxin reductase activity is decreased by selenium deficiency, Biochem Biophys Res Commun 234 (1997), 293–295. G.V. Kryukov, R.A. Kumar, A. Koc, Z. Sun and V.N. Gladyshev, Selenoprotein R is a zinc-containing stereo-specific methionine sulfoxide reductase, Proc Natl Acad Sci 99 (2002), 4245–4250. D. Jeong, T.S. Kim, Y.W. Chung, B.J. Lee and I.Y. Kim, Selenoprotein W is a glutathione-dependent antioxidant in vivo, FEBS Lett 517 (2002), 225–228. J. St-Amand, K. Okamura, K. Matsumoto, S. Shimizu and Y. Sogawa, Characterization of control and immobilized skeletal muscle: an overview from genetic engineering, FASEB J 15 (2001), 684–692. D. Behne, H. Hilmert, S. Scheid, H. Gessner and W. Elger, Evidence for specific selenium target tissues and new biologically important selenoproteins, Biochem. Biophys. Acta 966 (1988), 12–21. L.L. Ji, F.W. Stratman and H.A. Lardy, Antioxidant enzyme systems in rat liver and skeletal muscle. Influences of selenium deficiency, chronic training, and acute exercise, Arch Biochem Biophys 263 (1988), 150–160. R. Bergholm, S. Makimattila, M. Valkonen, M.L. Liu, S. Lahdenpera, M.R. Taskinen, A. Sovijarvi, P. Malmberg and H. Yki-Jarvinen, Intense physical training decreases circulating antioxidants and endothelium-dependent vasodilatation in vivo, Atherosclerosis 145 (1999), 341–349. A.S. Rousseau, I. Hininger, S. Palazzetti, H. Faure, A.M. Roussel and I. Margaritis, Antioxidant vitamin status in high exposure to oxidative stress in competitive athletes, Br J Nutr 92 (2004), 461–468. H. Ohno, T. Yahata, Y. Sato, K. Yamamura and N. Taniguchi, Physical training and fasting erythrocyte activities of free radical scavenging enzyme systems in sedentary men, Eur J Appl Physiol Occup Physiol 57 (1988), 173–176. C.T. Evelo, N.G. Palmen, Y. Artur and G.M. Janssen, Changes in blood glutathione concentrations, and in erythrocyte glutathione reductase and glutathione S-transferase activity after running training and after participation in contests, Eur J Appl Physiol Occup Physiol 64 (1992), 354–358.
Galley Proof
Table 4 Plasma selenium concentrations and antioxidant enzyme activities in relation to gender and type of performed activity
7
File: bio762.tex; BOKCTP/ljl p. 11
Males (n = 92) Females (n = 42) SED (n = 8) ANA (n = 9) AE (n = 48) INT (n = 27) SED (n = 8) ANA (n = 4) AE (n = 21) INT (n = 9) EE (MJ/d) 9.76 ± 1.30 12.64 ± 2.24 14.81 ± 2.76 13.36 ± 1.99 8.34 ± 1.26 10.08 ± 0.94 11.56 ± 1.38 11.85 ± 1.50 TBARS (µmol/l) 2.66 ± 0.27 2.69 ± 0.21 2.61 ± 0.47 2.62 ± 0.46 3.01 ± 0.27 2.93 ± 0.31 3.06 ± 0.60 2.89 ± 0.52 SH groups (µmol/g prot) 5.73 ± 0.58 5.45 ± 0.33 5.43 ± 0.61 5.35 ± 0.36 5.19 ± 0.54 5.25 ± 0.16 5.03 ± 0.41 5.19 ± 0.31 EE, energy expenditure; SED, sedentary control group; ANA, anaerobic group; AE, aerobic group; INT, intermittent group. TBARS, plasma thiobarbituric acid reactive substances concentration, SH group, plasma total thiol groups concentration. EE is included as a covariate in this analysis.
16/02/2005; 11:06
Table 5 Markers of oxidation in athletes and sedentary subjects in relation to gender and type of performed activity
I. Margaritis et al. / Selenium intakes and status in athletes
Males (n = 92) Females (n = 42) SED (n = 8) ANA (n = 9) AE (n = 48) INT (n = 27) SED (n = 8) ANA (n = 4) AE (n = 21) INT (n = 9) EE (MJ/d) 9.76 ± 1.30 12.64 ± 2.24 14.81 ± 2.76 13.36 ± 1.99 8.34 ± 1.26 10.08 ± 0.94 11.56 ± 1.38 11.85 ± 1.50 Se (µmol/l) 0.97 ± 0.21 1.08 ± 0.37 1.06 ± 0.22 0.96 ± 0.12 0.90 ± 0.15 0.97 ± 0.09 1.02 ± 0.15 0.91 ± 0.15 Cu-Zn SOD (U/mg Hb) 1.40 ± 0.09 1.37 ± 0.13 1.34 ± 0.13 1.40 ± 0.10 1.33 ± 0.11 1.39 ± 0.09 1.32 ± 0.14 1.42 ± 0.15 GSH-Px (U/g Hb) 36.2 ± 3.5 45.4 ± 7.6 42.8 ± 10.3 42.0 ± 13.5 42.9 ± 5.5∗ 48.8 ± 8.0∗ 47.2 ± 9.2∗ 45.4 ± 7.6∗ GR (U/g Hb) 2.86 ± 0.40 4.87 ± 2.09 3.65 ± 0.84 3.61 ± 0.86 3.69 ± 0.51 3.84 ± 0.91 3.52 ± 0.72 3.33 ± 0.46 Cu-Zn-SOD, erythrocyte superoxide dismutase activity; GSH-Px, erythrocyte glutathione peroxidase activity (plasma Se concentrations and EE were included as covariates); GR, erythrocyte glutathione reductase activity (dietary riboflavin intakes and EE were included as covariates). SED, sedentary control group; ANA, anaerobic group; AE, aerobic group; INT, intermittent group. Mean value was significantly different from male athletes: ∗ P < 0.05.