Research
Original Investigation
Increased Prefrontal Cortex Activity During Negative Emotion Regulation as a Predictor of Depression Symptom Severity Trajectory Over 6 Months Aaron S. Heller, MS; Tom Johnstone, PhD; Michael J. Peterson, MD, PhD; Gregory G. Kolden, PhD; Ned H. Kalin, MD; Richard J. Davidson, PhD Editorial page 1131 IMPORTANCE Emotion regulation is critically disrupted in depression, and the use of
paradigms that tap into these processes may uncover essential changes in neurobiology during treatment. In addition, because neuroimaging outcome studies of depression commonly use only baseline and end-point data—which are more prone to week-to-week noise in symptomatology—we sought to use all data points over the course of a 6-month trial.
Related article yoi130014 Supplemental content at jamapsychiatry.com
OBJECTIVE To examine changes in neurobiology resulting from successful treatment. DESIGN, SETTING, AND PARTICIPANTS Double-blind trial examining changes in the neural circuits involved in emotion regulation resulting from 1 of 2 antidepressant treatments during a 6-month trial. Twenty-one patients with major depressive disorder and without other Axis I or Axis II diagnoses were scanned before treatment and 2 and 6 months into treatment at the university’s functional magnetic resonance imaging facility. INTERVENTIONS Venlafaxine hydrochloride extended release (with doses of up to 300 mg) or
fluoxetine hydrochloride (with doses of up to 80 mg). MAIN OUTCOMES AND MEASURES Neural activity, as measured using functional magnetic resonance imaging during performance of an emotion regulation paradigm, as well as regular assessments of symptom severity using the Hamilton Depression Rating Scale. For use of all data points, slope trajectories were calculated for rate of change in depression severity and for rate of change in neural engagement. RESULTS The depressed individuals who showed the steepest decrease in depression severity over the 6-month period were the same individuals who showed the most rapid increases in activity in Brodmann area 10 and the right dorsolateral prefrontal cortex activity when regulating negative affect over the same time frame. This relationship was more robust when using only the baseline and end-point data. CONCLUSIONS AND RELEVANCE Changes in prefrontal cortex engagement when regulating negative affect correlate with changes in depression severity over 6 months. These results are buttressed by calculating these statistics, which are more reliable and robust to week-to-week variation than are difference scores.
Author Affiliations: Author affiliations are listed at the end of this article.
JAMA Psychiatry. 2013;70(11):1-0. doi:10.1001/jamapsychiatry.2013.2430 Published online October 30, 2013.
Corresponding Author: Richard J. Davidson, PhD, Waisman Laboratory for Brain Imaging and Behavior, University of Wisconsin, Madison, 1500 Highland Ave, Madison, WI 53705 (
[email protected]).
1
Downloaded From: http://archpsyc.jamanetwork.com/ by a University of Wisconsin -Madison User on 11/25/2013
Research Original Investigation
E
motion dysregulation is a core component in the pathophysiology of major depressive disorder (MDD).1,2 In particular, the ability to adaptively regulate negative affect is thought to be an important mechanism by which depressed individuals recover from MDD and is part of the theor e t i c a l r at i o n a l e o f s e ve r a l e m p i r i c a l l y s u p p o r t e d psychotherapies.3 Meta-analyses of neuroimaging studies using emotion regulation paradigms has shown that both the prefrontal cortex (PFC) and the amygdala appear to be involved in the regulation of emotion,4 whereby it is hypothesized that the PFC enacts “top-down” control of the amygdala and affects its firing patterns.5 Studies have often found specific roles for the dorsolateral PFC (DLPFC) and the medial PFC (mPFC) in emotion regulation.6 Although the DLPFC does not have direct projections to the amygdala, the mPFC does, and the DLPFC may exert top-down control of amygdala function via the mPFC.7 Recently, it has been suggested that more dorsal regions of the mPFC are involved in the appraisal of emotion and that more ventral regions of the mPFC are involved in the regulation of emotion.7 Yet, despite near universal agreement that improvement of emotion regulation is essential to effective treatment, we are not aware of neuroimaging studies, to date, that have examined changes in the neurobiological substrates underlying emotion regulation processes as a result of treatment. Studies examining changes in the neurobiology of depression over the course of treatment have produced somewhat inconsistent results. For example, meta-analyses examining changes in functional magnetic resonance imaging (fMRI) and positron emission tomography following antidepressant treatment have found that activity in a variety of PFC, thalamic, and insular areas increase during treatment, whereas activity in the amygdala, hippocampus, ventral anterior cingulate cortex, and other PFC areas appear to decrease during treatment.8,9 It appears that the results depend to a significant degree on what type of paradigm is used (eg, either a resting state or one of several task activation paradigms). It is also common for studies to follow patients with MDD for 8 weeks or less; however, brain activation changes, as well as symptom severity, may change far beyond the first 8 weeks of treatment. Another reason for a lack of concordance between treatment studies of depression may be methodological. In treatment studies of depression, many intermediate measures of symptom severity are discarded, and only baseline and endpoint measures are examined. This approach is helpful for understanding final symptom severity but does so at the cost of examining the course of medication response. One problem with this approach is the potential large week-to-week variability in symptoms, which could lead to reduced accuracy if only baseline and end-point data are used. Such issues can be compounded when taking categorical approaches (eg, remitter vs nonremitter) because the cut-point distinctions are arbitrary.10 As the National Institute of Mental Health Treatment of Depression Collaborative Research Program noted,11 end-point and categorical approaches to assessing treatment outcome often make restrictive statistical assumptions and discard potentially informative data. Instead, this work group suggested the use of random regression models, whereby a tra2
Increased Prefrontal Cortex Activity
jectory (ie, slope) is calculated for each patient or treatment arm. This allows for the use of all data points, is robust in the face of missing data, allows for irregularly spaced measurement occasions, and can increase reliability of outcome measures. This type of approach has been successfully used in outcome studies.12-15 Because emotion dysregulation is generally regarded to be an essential feature of depression, using an experimental paradigm designed specifically to tap into these psychological processes has important ecological validity; there are no studies of which we are aware that have examined relations between changes in symptom severity resulting from treatment and changes in brain regions subserving emotion regulation. In addition, following patients for longer than the customary 8 weeks after treatment may be important in uncovering novel neurobiological circuits correlating with rate of treatment response. Lastly, the development of novel methodological approaches to examining relations between changes in symptom severity and brain engagement may be important for better understanding treatment response. To that end, a 6-month treatment outcome study was conducted in which untreated patients with MDD were assessed prior to and during treatment with 1 of 2 antidepressants (venlafaxine hydrochloride extended release or fluoxetine hydrochloride). Patients were scanned on 3 occasions: before treatment and 2 and 6 months into treatment. Depression severity was assessed regularly. Given that the regulation of negative affect is thought to be a central component of MDD,1,2 we used a paradigm designed to tap into these processes. Given that the PFC and the amygdala have been implicated in the successful regulation of emotion,4 we predicted that trajectories of change in the these areas would correlate with trajectories of change in the Hamilton Depression Rating Scale (HDRS).
Methods Participants At baseline, 29 medication-free, right-handed adults satisfying DSM-IV16 criteria for unipolar MDD were enrolled in our study. These participants were recruited through community advertisements, and they had to be medication free for at least 2 weeks prior to study entry. At enrollment, the participants were screened for standard MRI compatibility criteria, central nervous system medications, comorbid substance abuse/ dependence, other comorbid DSM-IV Axis I (including anxiety) or Axis II diagnoses, and a personal or familial history of bipolar disorder. Patients in this sample were screened for and excluded if they had a comorbid Axis I disorder. Patients were required to have had depressive symptoms for at least 1 month prior to enrollment and scores greater than 17 on the 21-item HDRS at enrollment and baseline fMRI assessment. The participants in our study are the same as those who participated in the studies by Heller et al,17,18 Johnstone et al,19 and Light et al.20 Our study was approved by the institutional review board, and each participant provided informed written consent.
JAMA Psychiatry November 2013 Volume 70, Number 11
Downloaded From: http://archpsyc.jamanetwork.com/ by a University of Wisconsin -Madison User on 11/25/2013
jamapsychiatry.com
Increased Prefrontal Cortex Activity
Original Investigation Research
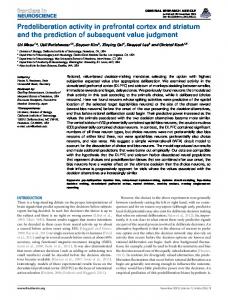
Figure 1. Schematic of the Emotion Regulation Paradigm Fixation 1s
Picture Presentation 12 s
ITI 5-10 s
+
0
Relax
1
5 “Maintain” “Enhance” “Suppress”
Regulation 8s
13
Following the initial, pretreatment scan session, patients were randomly assigned to receive a 6-month course of either venlafaxine or fluoxetine treatment. These patients were only receiving antidepressant medication treatment; they were not receiving other forms of therapy. In week 1, patients received either 37.5 mg of venlafaxine or 20 mg of fluoxetine. In week 2, patients received either 75 mg of venlafaxine or 20 mg of fluoxetine; these dosing levels were the minimum dosing levels for our study. Further titration was based on clinical response (adverse effects and antidepressant effects). The maximum dosing was 300 mg of venlafaxine and 80 mg of fluoxetine. The HDRS scores were acquired approximately weekly for the first 5 weeks (until an effective dose was achieved), roughly every other week for the next month, and approximately once a month through the completion of the 6-month study. Approximately 11 HDRS interviews were performed over 6 months if the patient completed the study. During the first 2 months of treatment, the mean (SD) dosage was 37 (8.7) mg/d for the patients randomly assigned to receive fluoxetine and 118 (36.6) mg/d for the patients randomly assigned to receive venlafaxine. Over the entire study, the mean (SD) dosage was 43.62 (11.76) mg/d for the patients randomly assigned to receive fluoxetine and 158.63 (62.06) mg/d for the patients randomly assigned to receive venlafaxine. For regression analyses controlling for medication quantity, we used the mean dosage that patients took over the entire study because a single dosage of venlafaxine and a single dosage of fluoxetine are thought to be of rough clinical equivalence. The rationale for using 2 different types of medication was 2-fold. First, it was to examine the general neurobiological substrates underlying medication treatment response. To do this, 2 medications were required to be able to examine such generalized patterns. A secondary goal was to be able to compare the neurobiological profiles resulting from both a selective serotonin reuptake inhibitor and a selective noradrenergic reuptake inhibitor, although our sample sizes were ultimately not large enough to be able to directly compare the treatments with sufficient statistical power. jamapsychiatry.com
18-23
This is an example trial in which a positive image was presented. Four seconds into image presentation, participants received an auditory prompt instructing them to “enhance,” “suppress,” or “attend” to their affect. ITI indicates intertrial interval.
At 2 and 6 months, depressed participants returned for 2 additional fMRI assessments. Eight patients discontinued participation, leaving 21 patients. There was a marginally significant difference in initial HDRS scores between those depressed patients completing the trial and those not completing the trial (t27 = 1.93; P = .06), such that those completing the trial had lower initial HDRS scores. After unblinding, it was revealed that 12 patients had taken venlafaxine and that 9 patients had taken fluoxetine. Analyses incorporated medication “responders” and “nonresponders.”
The fMRI Design All 3 scan sessions were identical in timing, procedure, and design. Participants were scanned while viewing a sequence of 72 positive and 72 negative images from the International Affective Picture System.21 Negative images were selected according to the International Affective Picture System norms to be both unpleasant (with scores ranging from 1 [most unpleasant] to 9 [most pleasant]; mean [SD] score, 2.95 [0.87]) and arousing (with scores ranging from 1 [least arousing] to 9 [most arousing]; mean [SD] score, 5.44 [0.80]), whereas positive images were pleasant (mean [SD] score, 7.13 [0.62]) and arousing (mean [SD] score, 5.28 [0.58]). Arousal ratings did not differ significantly across positive and negative images (t < 1), thus allowing us to manipulate valence while controlling for stimulus intensity. Stimuli were presented using E-Prime software (Psychological Software Tools). The same images were used at all scan sessions; however, the order of image presentation was randomized across the scans. Trials began with a 1-second fixation cross and auditory tone. Then, an image was presented for 10 seconds, followed by 6 seconds of blank screen. To ensure compliance, at the onset of each image, participants used a button response pad to judge whether the image was positive or negative. Four seconds following image onset, an auditory prompt instructed participants to increase (“enhance”) or decrease (“suppress”) their emotional response to the image or to continue to “attend” to the picture (Figure 1). While positioned inside a mock scanner during a preJAMA Psychiatry November 2013 Volume 70, Number 11
Downloaded From: http://archpsyc.jamanetwork.com/ by a University of Wisconsin -Madison User on 11/25/2013
3
Research Original Investigation
Increased Prefrontal Cortex Activity
Figure 2. Trajectories of Hamilton Depression Rating Scale (HDRS) Scores Over Time for 21 Patients With Major Depressive Disorder 21 HDRS Trajectories 35
30
HDRS Score
25
20
15
10
5
0 0
50
100
150
200
No. of Days
vious session, participants were trained on the use of cognitive reappraisal strategies to reevaluate the images as more or less emotional. For the suppress condition, participants were trained to either view the situation as fake or unreal or imagine that the situation being depicted had a different outcome than the one suggested (eg, a couple in love were just actors and did not feel the way that they were depicted in the image). For the enhance condition, participants were trained to either imagine themselves or a loved one experiencing the situation being depicted or imagine a more extreme outcome than the one depicted (eg, in response to a picture of a ferocious dog, a participant might imagine that the dog’s leash broke and that the dog is going to bite him or her). Alternatively, for the trials of the attend condition, participants were instructed to maintain their focus on the picture without changing their affective experience. Across six 380-second scans, there were 24 trials of the regulation conditions and 12 trials of the attend condition for each valence (order pseudorandomized).
Image Aquisition Images were collected on a General Electric 3-T scanner equipped with a standard clinical whole-head transmitreceive quadrature head coil. Functional images were acquired using a T2*-weighted gradient-echo, echo planar imaging pulse sequence (33 sagittal slices, 4-mm thickness, and 1-mm interslice gap; 64 × 64 matrix; 240-mm field of view; a repetition time of 2000 milliseconds, an echo time of 30 milliseconds, and a flip angle of 60°; 190 whole-brain volumes per run). A high-resolution T1-weighted anatomical image was also acquired (T1-weighted inversion recovery fast gradient echo; 256 × 256 in-plane resolution; 240-mm field of view; 124 × 1.1-mm axial slices).
Analysis of Change in Depression Symptoms To use the totality of the HDRS symptom data, we performed a multiple regression analysis for each depressed patient in which the vector of depression severity scores on the 21-item 4
HDRS over the course of the study was regressed on the square root of the number of days since the initial, pretreatment HDRS score. For each patient, this yielded an estimate of the B coefficient that corresponded to the rate of change of HDRS score over the square root of time plus a constant of 1 for the time variable. We used a square root transformation of time because previous reports11,13 have suggested that reductions in symptom severity are nonlinear over time following treatment with antidepressants. This can be seen descriptively in Figure 2. Further supporting the rationale for using a square root transformation of time was the fact that the mean R2 for the HDRS trajectory regressions across participants was significantly higher when the square root transformation (mean [SD] R2 = 0.65 [0.23]) of time plus 1 was used as opposed to when the nontransformed time variable (mean [SD] R2 = 0.55 [0.22]; paired t test: t20 = 6.46, P < .001) was used.
Image Analysis At each of the 3 time points, fMRI data were corrected for slice time and motion using AFNI software.22 Echo planar imaging data were normalized to the 2-mm Montreal Neurological Institute 152 T1 template (using FMRIB Software Library’s linear and nonlinear normalization algorithms FLIRT and FNIRT) and smoothed (5-mm full-width at half maximum). These data were then analyzed as single-participant generalized linear models to model each of the 6 trial types (positive/negative stimulus; enhance, attend, and suppress reappraisal instruction), as well as 6 motion estimate covariates. We also included a second-order polynomial used to model the baseline data and slow signal drift. Regressors consisted of a set of 7 sine basis functions, which were used to produce separate estimated hemodynamic response functions for each trial type over the entire trial. The estimated hemodynamic response functions were converted to percentage signal change values and averaged across time points corresponding to the peak hemodynamic response during the regulation period (8-14 seconds after stimulus onset). To examine brain function when
JAMA Psychiatry November 2013 Volume 70, Number 11
Downloaded From: http://archpsyc.jamanetwork.com/ by a University of Wisconsin -Madison User on 11/25/2013
jamapsychiatry.com
Increased Prefrontal Cortex Activity
regulating negative affect, we created contrast maps for each participant at all 3 time points by subtracting the “attend” condition from the “suppress” condition in response to negative stimuli. We performed an analysis (similar to the one we performed for the HDRS scores) in which data from all 3 scan sessions were used to assess treatment-induced change in brain activity when regulating emotion. As with the individual HDRS trajectories, time, in this case, corresponded to the number of days since the first scan occurred. Thus, for each participant, on a voxel-by-voxel basis, we regressed the vector of the 3 negative “suppress” vs “attend” contrast values on the vector of 3 time values (again using square root transformation). For each participant, this yielded an estimate of the B coefficient at each voxel corresponding to the rate of change of fMRI when regulating emotion resulting from treatment. For the analyses using the more traditional approach of examining change using difference scores (end vs starting points), we subtracted the initial HDRS score from the final HDRS score. For fMRI analyses, in a voxelwise manner, we subtracted the initial negative “suppress” vs “attend” from the final negative “suppress” vs “attend.”
Group Analysis Each patient now had 2 B coefficient estimates following initiation of antidepressant treatment. One of them corresponded to the rate of change of HDRS scores; the other corresponded to the rate of change of fMRI activity when regulating emotion. To examine which brain areas displayed a rate of change correlating with a rate of change of HDRS symptoms, we performed a between-subjects correlation, correlating the estimate of the B coefficient from the change in brain activity over time, with the estimate indicating the rate of change in HDRS scores. Brain areas demonstrating a significant association in this analysis can be interpreted as reflecting the rate of change of depression severity. Resulting brain maps from group analysis were thresholded at P < .005 with a cluster size of k > 51 voxels. This corresponds to P < .05 corrected for multiple comparisons based on the Monte Carlo simulation (the AlphaSim program in AFNI) using a wholebrain mask. Group analyses relating to the difference scores were performed in the same manner. For analyses of gray matter probability (GMP), we used FMRIB Software Library’s FAST algorithm.23 For comparability with studies examining treatment for 8 weeks, we performed a similar analysis with only the first 2 fMRI time points and HDRS measurements for 8 weeks. We calculated a difference score of the negative suppress vs attend condition for the 2 fMRI sessions and correlated that with the HDRS trajectory over the first 8 weeks. We also performed a connectivity analysis to examine whether the slope of amygdala-PFC connectivity related to the HDRS trajectory. We used an anatomical amygdala seed from the Juelich atlas,24 and we used the beta-seed connectivity approach.25 We specifically looked at those PFC regions that were significant in the univariate analysis. We subsequently calculated the slope of change in connectivity across the 3 time
jamapsychiatry.com
Original Investigation Research
points and correlated that with the HDRS slope, as already described. See eAppendix in Supplement.
Results Symptom Change Patients completing the 6-month trial were interviewed with the HDRS a mean (SD) 12 (0.54) times. Their final HDRS assessment visit, which coincided with the third and final MRI session, was a mean (SD) of 189 (10.48) days after the initial HDRS assessment and MRI session. At the initial time point, the mean (SD) HDRS score was 20.33 (2.22), and at the final time point, the mean (SD) HDRS score was 6.00 (4.30). At final assessment, 14 of the 21 patients had “remitted” (HDRS score ≤7), and 2 of the 7 nonremitting patients were medication “responders” (≥50% decrease). The mean HDRS score at final assessment was significantly lower than at initial assessment (t20 = 14.46, P < .001). The mean (SD) estimate of the B coefficient indicating the rate of change of HDRS score over time (square root transformation) across participants was −10.22 (0.43). For the non–square root transformed data, the mean (SD) estimate of the B coefficient was −0.07 (0.03). As can be seen in Figure 2, individual patients demonstrated substantial variability at the final HDRS assessment (compared with their most recent previous assessments), highlighting the potential power in using a trajectory-based approach for assessing symptom change.
Correlation Between HDRS Trajectory and fMRI Trajectory When Regulating Negative Affect The between-subjects correlation, examining the relation between the treatment-related blood oxygenation level– dependent (BOLD) signal changes during the regulation of negative affect and the HDRS trajectory, revealed several areas. Perhaps most interestingly, 2 areas of the PFC, Brodmann area (BA 10; peak: −4, 62, 12; Figure 3A) and the right DLPFC (RDLPFC [BA 9]; peak: 18, 50, 44; Figure 3B) demonstrated a significant negative association with HDRS rate of change. Those individuals showing the steepest increase, over the 6-month trial, in negative “suppress” vs “attend” BOLD signal in these prefrontal regions were those individuals showing the most rapid decrease in HDRS score. Controlling for age and sex in the 2 PFC regions did not attenuate the relationship. Other areas that showed a similar association can be seen in our Table. We found no such relationship between HDRS trajectory and negative “suppress” vs “attend” trajectory in the amygdala, contrary to our prediction. Furthermore, recent models of antidepressant treatment change26 have suggested that change in amygdala activity in response to negative stimuli (in the absence of emotion regulation) may predate changes in PFC activity. As a result, we calculated a similar trajectory for the negative “attend” condition only and correlated that with HDRS trajectory. Using the negative “attend” trajectory, we did not see a relationship with HDRS trajectory within the amygdala, even at the more liberal threshold of P < .01.
JAMA Psychiatry November 2013 Volume 70, Number 11
Downloaded From: http://archpsyc.jamanetwork.com/ by a University of Wisconsin -Madison User on 11/25/2013
5
Research Original Investigation
Increased Prefrontal Cortex Activity
Figure 3. Correlation Between Treatment-Related BOLD Signal Changes During Regulation of Negative Effect and HDRS Trajectory L
A
0
Rate of HDRS Change
–0.5 R2 = 0.3567 –1 –1.5 –2
Remitters (HDRS score ≤7) Nonremitters –0.04
–0.02
0
0.02
0.04
Rate of BA 10 Change (Suppress vs Attend)
y = 62 mm
0
Rate of HDRS Change
B
y = 48 mm
–0.5 R2 = 0.3437 –1 –1.5 –2 –2.5 –0.02
0
0.02
0.04
0.06
0.08
Rate of RDLPFC Change (Suppress vs Attend)
Analyses Addressing Specificity To examine the specificity of these findings, we performed several analyses to address the specificity of the findings. When controlling for medication type (eg, fluoxetine vs venlafaxine), the relationship between HDRS trajectory and BA 10 trajectory remained significant (B = −11.46, t18 = −3.09, P = .006); the effect of medication was not significant (B = −0.10, t18 = −0.62, P = .54). Similarly, when controlling for medication type, the relationship between HDRS trajectory and DLPFC trajectory remained significant (B = –11.72, t18 = −2.91, P = .009); the effect of medication was not significant (B = −0.02, t(18) = −0.13, P = .90). This suggests that drug type does not account for this relationship. Because this effect could be driven by individual differences in initial depression severity, we next performed analyses controlling for baseline HDRS score. When controlling for
The changes in Brodmann area 10 (BA 10 [A]) and the right dorsolateral prefrontal cortex (RDPFC [B]) during negative emotion regulation demonstrated significant associations with the changes in the Hamilton Depression Rating Scale (HDRS). The functional magnetic resonance imaging scans, along with their y coordinates (insets), are shown on the left. BOLD indicates blood oxygenation level–dependent; L, left.
baseline HDRS score, the relationship between HDRS trajectory and BA 10 trajectory slightly increased in significance (B = −11.86, t18 = −3.98, P < .001); interestingly, the effect of baseline HDRS score was also significant (B = −0.09, t18 = −3.18, P = .005) such that individuals with higher baseline HDRS scores had steeper HDRS trajectories. When controlling for baseline HDRS score, the relationship between HDRS trajectory and DLPFC trajectory remained significant (B = −9.71, t18 = −2.53, P = .02); in this case, the effect of baseline HDRS score was not significant (B = −0.06, t18 = −1.63, P = .12). This suggests that these findings are due to relationships in the trajectory, specifically, and not initial depression severity, per se. Lastly, we examined the condition when participants were increasing positive affect (namely, the positive “enhance” vs positive “attend” conditions). We calculated fMRI trajectories for each participant and correlated them with HDRS tra-
Table. Brain Regions Showing a Significant Association Between HDRS Trajectory and fMRI Trajectory When Regulating Negative Affect
Location
Brodmann Area
Cluster Size, Voxels
Maximum t Value
Superior occipital gyrus
17/18
−4, −90, 24
189
−4.24
Right middle temporal gyrus
20
70, −35, −8
109
−4.37
Left middle temporal gyrus
21
−64, −12, −14
102
−4.50
Medial prefrontal cortex
10
−4, 62, 12
74
−3.83
14, −86, −40
55
−3.85
18, 50, 44
53
−4.69
Cerebellum Right superior frontal gyrus
6
x, y, z Coordinates, mm
9
JAMA Psychiatry November 2013 Volume 70, Number 11
Downloaded From: http://archpsyc.jamanetwork.com/ by a University of Wisconsin -Madison User on 11/25/2013
Abbreviations: fMRI, functional magnetic resonance imaging facility; HDRS, Hamilton Depression Rating Scale. jamapsychiatry.com
Increased Prefrontal Cortex Activity
jectories. There were no significant associations between HDRS trajectory and trajectory of upregulating positive affect when correcting for multiple voxelwise comparisons. This may be due, in part, to the fact that the HDRS has only 3 items inquiring about reductions in positive affect in MDD.
Correlation Between HDRS Baseline to End-Point Difference and fMRI Difference When Regulating Negative Affect To evaluate whether calculating HDRS and fMRI trajectories yields additional and potentially more robust information compared with the more traditional difference score approach, we assessed whether the significant effects among BA 10, DLPFC, and HDRS trajectories held when using baseline and 6-month difference scores. The correlation between the BA 10 difference score and the HDRS difference score (r = −0.39, P = .08) and the correlation between the RDLPFC difference score and the HDRS difference score (r = −0.37, P = .10) were not significant. Note that the association is in the same direction as the trajectory-based approach, but in these areas, the correlation is attenuated—when testing whether the difference in correlations was significant between the trajectory and difference score approaches, neither were significantly different from one another (P = .41 for BA 10 and P = .39 for the DLPFC). However, given the relatively strict requirements for multiple comparison correction in imaging paradigms, we would not have found these effects using the traditional difference score approach.
Correlation Between HDRS Trajectory and GMP Trajectory Because several studies have suggested that changes in brain structure may accompany changes in depressive symptom severity, we calculated GMP maps for each depressed patient at all 3 time points and ran a voxelwise regression similar to that for the functional data. There was no significant correlation between GMP trajectory in BA 10 and HDRS trajectory (r = −0.05, P = .82). When controlling for the GMP trajectory, we found that the association between the BOLD signal BA 10 trajectory when regulating negative affect and the HDRS trajectory remained significant (B = −12.11, t18 = −3.19, P = .005) and that the association between the BA 10 GMP trajectory and the HDRS trajectory was not significant (B = −12.10, t18 = 0.43, P = .67). There was also no significant correlation between the GMP trajectory in the RDLPFC and the HDRS trajectory (r = −0.23, P = .32). Similarly, when controlling for the GMP trajectory, we found that the association between the BOLD signal RDLPFC trajectory when regulating negative affect and the HDRS trajectory remained significant (B = −11.84, t18 = −2.83, P = .01) and that the association between the RDLPFC GMP trajectory and the HDRS trajectory was not significant (B = −0.54, t18 = −0.02, P = .98). This suggests that the findings are not due to changes in structure but are specific to functional changes. We computed a slope measure for each participant’s HDRS scores across the initial 2 months—up to the point at which the second scan occurred. We also computed a difference score for change in brain activity when regulating negative affect, and we performed a between-subjects voxelwise correlation of
jamapsychiatry.com
Original Investigation Research
these 2 individual difference metrics. Interestingly, no areas survived multiple comparison correction for this analysis at 2 months. For the connectivity analysis, we examined whether the rate of change in amygdala–BA 10 connectivity or in amygdalaRDLPFC connectivity predicted the HDRS trajectory. We found no significant relationship between the rate of change in either DLPFC-amygdala connectivity (P = .54) or BA 10–amygdala connectivity (P = .65) and HDRS trajectory. See eAppendix in Supplement.
Discussion Emotion regulation is a core feature of the pathophysiology in depression; however, studies examining brain changes during the regulation of emotion over the course of treatment have not been conducted. We calculated depression severity and fMRI trajectories for each participant over 6 months of antidepressant treatment as they performed an emotion regulation task. Performing a between-subjects regression with these 2 measures revealed that the rate of change of activity in BA 10 and the RDLPFC when regulating negative affect tracked with the rate of change of depression severity such that those depressed patients evidencing more rapid increases in BA 10 and RDLPFC activity were those individuals showing the most rapid decreases in depression symptom severity. We did not find such a relationship in the amygdala, or when upregulating positive affect as opposed to downregulating negative affect. In addition, the calculation of symptom and brain trajectories following treatment in psychiatric studies has several virtues, including increasing the reliability of change statistics. The use of more reliable statistical measures, along with the use of theoretically motivated experimental paradigms, may lead to a greater concordance across studies and may aid in designing better treatments. This finding fits with some previous work examining the neurobiological correlates underlying symptom change in depression. Studies have found increases in DLPFC activity resulting from 8 weeks of antidepressant treatment27 or increases in medial PFC activity resulting from treatment.28,29 This finding is also partially consistent with a model for treatment change suggesting that increases in PFC and decreases in amygdala engagement would follow successful depression treatment.26 The lack of a change in the amygdala when either regulating negative affect or during negative emotional reactivity is notable, however. It may be that the use of a paradigm designed to more spec ific ally probe amygdala reactivity,30,31 as opposed to the emotion regulation paradigm used herein, would have more power to reveal relationships between the trajectory of amygdala reactivity and the trajectory of depression severity. Given the importance of the regulation of emotion in mood disorders such as depression,1,2 using paradigms with face validity may be particularly important in uncovering the unique neurobiological substrates underlying the disorder and its successful treatment. In particular, changes in distinct brain networks appear to be related to changes in symptom severity, deJAMA Psychiatry November 2013 Volume 70, Number 11
Downloaded From: http://archpsyc.jamanetwork.com/ by a University of Wisconsin -Madison User on 11/25/2013
7
Research Original Investigation
pending on the type of task used, and whether there is a task at all (eg, at rest). This is not to say that emotion regulation paradigms are the only or best approach—other paradigms designed to examine disturbances in emotional reactivity, memory, or cognitive disruption are also important to understanding the neurobiology underlying depression and its treatment. This highlights not only the heterogeneity of the neurobiology underlying depression but also the importance of the field to consider which imaging paradigms may be the most valuable in aiding our understanding of the disorder. There are at least 2 reasons for why we may have seen a lack of a relationship between changes in amygdala activity and changes in depression severity. First, it may more likely be due to the paradigm that was used than to the reduced role of the amygdala in depression treatment. In particular, a paradigm designed to more robustly activate the amygdala may yield greater variance across time points and may be sensitive to changes resulting from treatment compared with the emotion regulation paradigm used herein. Second, evidence suggests that although the psychological effects of an antidepressant may take weeks to occur, its effect on amygdala activity may occur much more rapidly (ie, within hours32). As a result, there may have been a disconnect between changes in amygdala activity and changes in HDRS score, making it difficult to find such a relationship. Our finding that changes in BA 10 and RDLPFC trajectory track changes in symptom severity raises the question of how the rate of change in engagement of these specific subregions of PFC corresponds to the rate of improvement in HDRS. Both of these areas have been found by meta-analysis to be involved in the regulation of emotion,4 but the roles of the specific subregions of the PFC during the regulation of affect have yet to be identified. Recently, it has been suggested that the medial PFC network can be subdivided into a dorsal area subserving the appraisal of emotion and a ventral area subserving the regulation of affect.7 The PFC areas found in this study fall within the dorsal nexus. Although it may be surprising that the PFC regions were more likely found in dorsal portions of the PFC and within this “appraisal” subdivision, it may, in fact, be that how a depressed patient interprets stimuli in their life is an important feature of how patients improve resulting from treatment. In fact, slope trajectories in several regions other than the PFC were associated with the HDRS trajectory. These included the occipital gyrus and middle temporal gyri. As we already suggested, the location of the PFC regions raises the possibility that brain areas responsible for appraisal processes are changing as depression severity is changing, and it may not be surprising that other perceptual areas are showing similar relationships. It may be that rates of change in such perceptual areas, in concert with the frontal areas, subserve changes in how depressed patients are in fact experiencing such affective stimuli. The most significant limitation in comparing a data set with only 3 time points with a data set with 12 time points is the mis-
8
Increased Prefrontal Cortex Activity
match in resolution. Ideally, we would have had 12 fMRI scans and 12 HDRS assessments—although it would have been too costly and too burdensome for respondents to complete such a study. As such, one limitation is that we were required to examine only linear relationships over the course of the 6-month trial. Although we ran linear regressions to compute fMRI slopes (to correlate with HDRS slopes), a depressed patient’s brain may change in nonlinear ways when regulating negative affect, and the use of nonlinear functions may better model both the psychological and the biological changes resulting from treatment. Inherent in this limitation is that with greater scanning resolution, we would have also been able to look at whether rates of brain changes differ early on in treatment vs later in treatment. In our view, these are very important questions for future research. Patients in this sample were screened for and excluded if they had comorbid Axis I disorders. Clinically, this is less common—depressed patients often present with comorbid Axis I disorders including generalized anxiety. In our view, this is both a strength and a limitation. It is a strength in that we are modeling the neural correlates of reductions in depressive symptoms specifically resulting from treatment. Using a more representative sample of patients who have a variety of comorbid Axis I disorders might enhance the generalizability of the findings that BA 10 and DLPFC trajectories track with reductions in HDRS score but might also introduce noise as patients experience reductions in additional clusters of symptoms. To address these questions, future work examining relations between changes in neurobiological trajectories resulting from treatment and changes in symptom severity should be more inclusive as to comorbidity. In summary, changes in PFC engagement when regulating negative affect track with changes in depression symptom severity over 6 months. These results were buttressed by calculating change statistics, which are theoretically more reliable than the use of difference scores. We believe that the use of paradigms that are thought to tap into core features of the disorder being studied, in addition to the use of statistics that make use of all the data acquired, can increase reliability and foster cross-study comparison because the findings are less reliant on an individual data point (symptom or fMRI measure) being robust and accurate. Most importantly, the findings from our study underscore the use of probing emotion regulation in depression and indicate that decreases in depression severity with treatment are associated with increases in prefrontal activation during the voluntary regulation of negative affect. These findings are consistent with the conjecture that increased prefrontal activation during the regulation of negative affect confers some benefit and may facilitate more rapid recovery following a negative challenge and thus, over time, may result in decreased depression severity.
JAMA Psychiatry November 2013 Volume 70, Number 11
Downloaded From: http://archpsyc.jamanetwork.com/ by a University of Wisconsin -Madison User on 11/25/2013
jamapsychiatry.com
Increased Prefrontal Cortex Activity
Original Investigation Research
Funding/Support: This study was supported by National Institutes of Health grants P50 MH069315, P50-MH084051, and R01 MH043454 to Dr Davidson; a Wyeth-Ayerst Pharmaceuticals grant to Dr Kalin; and grants from the Fetzer Institute, the John Templeton Foundation, the John W. Kluge Foundation, and the Impact Foundation.
a post hoc comparison of elderly (“young old”) and midlife patients. Am J Psychiatry. 1996;153(10):1288-1292.
Author Affiliations: Laboratory for Affective Neuroscience, University of Wisconsin, Madison (Heller, Davidson); Waisman Laboratory for Brain Imaging and Behavior, University of Wisconsin, Madison (Heller, Davidson); Department of Psychology, University of Wisconsin, Madison (Heller, Kolden, Kalin, Davidson); Centre for Integrative Neuroscience and Neurodynamics, Department of Psychology, University of Reading, Reading, England (Johnstone); Department of Psychiatry, University of Wisconsin, Madison (Peterson, Kolden, Kalin, Davidson); Lane Neuroimaging Laboratory, University of Wisconsin, Madison (Kalin); Health Emotions Research Institute, University of Wisconsin, Madison (Kalin); Center for Investigating Healthy Minds, University of Wisconsin, Madison (Davidson).
Role of the Sponsor: The funding agencies had no role in the design and conduct of the study; collection, management, analysis, and interpretation of the data; and preparation, review, or approval of the manuscript; and decision to submit the manuscript for publication.
16. American Psychiatric Association. Diagnostic Criteria From DSM-IV-TR. Arlington, VA: American Psychiatric Association; 2000.
Author Contributions: Dr Heller had full access to all of the data in the study and takes responsibility for the integrity of the data and the accuracy of the data analysis. Study concept and design: All authors. Acquisition of data: Johnstone, Peterson, Kolden. Analysis and interpretation of data: Heller, Johnstone, Kolden, Kalin, Davidson. Drafting of the manuscript: Heller, Kolden, Davidson. Critical revision of the manuscript for important intellectual content: All authors. Statistical analysis: Heller, Davidson. Obtained funding: Kalin. Administrative, technical, or material support: All authors. Study supervision: Johnstone, Kolden, Kalin, Davidson.
3. Beck AT. Depression: Causes and Treatment. Philadelphia, PA: University of Pennsylvania Press; 1970.
ARTICLE INFORMATION Submitted for Publication: September 27, 2012; final revision received April 10, 2013; accepted May 6, 2013. Published Online: October 30, 2013. doi:10.1001/jamapsychiatry.2013.2430.
Conflict of Interest Disclosures: Dr Kalin has disclosed that he received grant support from APIRE/Janssen Resident Psychiatric Mentor Grant, the National Institute for Mental Health, and the Stanley Medical Research Institute. He serves on the scientific advisory boards of AstraZeneca, Bristol-Meyers Squibb, CeNeRx BioPharma, Centocor Ortho Biotech, Corcept Therapeutics, Cyberonics, Double Helix, Eli Lilly, Forest Laboratories, General Electric Corp, Jazz Pharmaceuticals, Medivation, Neurocrine Biosciences, Neuronetics, Neuronetics LLC, Otsuka American Pharmaceuticals, Sanofi Syntholabs, and Wyeth Pharmaceuticals. He is a stockholder and maintains equity options in CeNeRx BioPharma and Corcept Therapeutics. He is the owner of Promoter Neurosciences LLC and owns the following patents: promoter sequences for corticotropin-releasing factor CRF2α and method of identifying agents that alter the activity of the promoter sequences (US patent 7071323 issued on July 4, 2006; US patent 7531356 issue on May 12, 2009); promoter sequences for urocortin II and the use thereof (US patent 7087385 issued on August 8, 2006); and promoter sequences for corticotropin-releasing factor binding protein and use thereof (US patent 7122650 issued on October 17, 2006). No other disclosures were reported.
jamapsychiatry.com
REFERENCES 1. Davidson RJ, Pizzagalli D, Nitschke JB, Putnam K. Depression: perspectives from affective neuroscience. Annu Rev Psychol. 2002;53:545-574. 2. Ochsner KN, Gross JJ. Cognitive emotion regulation: insights from social cognitive and affective neuroscience. Curr Dir Psychol Sci. 2008;17(2):153-158. doi:10.1111/j.14678721.2008.00566.x.
4. Kalisch R. The functional neuroanatomy of reappraisal: time matters. Neurosci Biobehav Rev. 2009;33(8):1215-1226. 5. Miller EK, Cohen JD. An integrative theory of prefrontal cortex function. Annu Rev Neurosci. 2001;24:167-202. 6. Ochsner KN, Gross JJ. The cognitive control of emotion. Trends Cogn Sci. 2005;9(5):242-249. 7. Etkin A, Egner T, Kalisch R. Emotional processing in anterior cingulate and medial prefrontal cortex. Trends Cogn Sci. 2011;15(2):85-93. 8. Delaveau P, Jabourian M, Lemogne C, Guionnet S, Bergouignan L, Fossati P. Brain effects of antidepressants in major depression: a meta-analysis of emotional processing studies. J Affect Disord. 2011;130(1-2):66-74. 9. Fitzgerald PB, Laird AR, Maller J, Daskalakis ZJ. A meta-analytic study of changes in brain activation in depression. Hum Brain Mapp. 2008;29(6): 683-695. 10. Dougherty DD, Rauch SL. Brain correlates of antidepressant treatment outcome from neuroimaging studies in depression. Psychiatr Clin North Am. 2007;30(1):91-103. 11. Gibbons RD, Hedeker D, Elkin I, et al. Some conceptual and statistical issues in analysis of longitudinal psychiatric data. Application to the NIMH treatment of Depression Collaborative Research Program dataset. Arch Gen Psychiatry. 1993;50(9):739-750. 12. Uher R, Muthén B, Souery D, et al. Trajectories of change in depression severity during treatment with antidepressants. Psychol Med. 2010;40(8):1367-1377. 13. Elkin I, Gibbons RD, Shea MT, et al. Initial severity and differential treatment outcome in the National Institute of Mental Health Treatment of Depression Collaborative Research Program. J Consult Clin Psychol. 1995;63(5):841-847. 14. Reynolds CF III, Frank E, Kupfer DJ, et al. Treatment outcome in recurrent major depression:
15. DeRubeis RJ, Hollon SD, Amsterdam JD, et al. Cognitive therapy vs medications in the treatment of moderate to severe depression. Arch Gen Psychiatry. 2005;62(4):409-416.
17. Heller AS, Johnstone T, Light SN, et al. Relationships between changes in sustained fronto-striatal connectivity and positive affect in major depression resulting from antidepressant treatment. Am J Psychiatry. 2013;170(2):197-206. 18. Heller AS, Johnstone T, Shackman AJ, et al. Reduced capacity to sustain positive emotion in major depression reflects diminished maintenance of fronto-striatal brain activation. Proc Natl Acad Sci U S A. 2009;106(52):22445-22450. 19. Johnstone T, van Reekum CM, Urry HL, Kalin NH, Davidson RJ. Failure to regulate: counterproductive recruitment of top-down prefrontal-subcortical circuitry in major depression. J Neurosci. 2007;27(33):8877-8884. 20. Light SN, Heller AS, Johnstone T, et al. Reduced right ventrolateral prefrontal cortex activity while inhibiting positive affect is associated with improvement in hedonic capacity after 8 weeks of antidepressant treatment in major depressive disorder. Biol Psychiatry. 2011;70(10):962-968. 21. Lang PJBM, Cuthbert BN. International Affective Picture System (IAPS): Affective Ratings of Pictures and Instruction Manual. Technical Report A-6. Gainesville, FL: University of Florida; 2005. 22. Cox RW. AFNI: software for analysis and visualization of functional magnetic resonance neuroimages. Comput Biomed Res. 1996;29(3):162-173. 23. Zhang Y, Brady M, Smith S. Segmentation of brain MR images through a hidden Markov random field model and the expectation-maximization algorithm. IEEE Trans Med Imaging. 2001;20(1):45-57. 24. Eickhoff SB, Paus T, Caspers S, et al. Assignment of functional activations to probabilistic cytoarchitectonic areas revisited. Neuroimage. 2007;36(3):511-521. 25. Rissman J, Gazzaley A, D’Esposito M. Measuring functional connectivity during distinct stages of a cognitive task. Neuroimage. 2004;23(2):752-763. 26. DeRubeis RJ, Siegle GJ, Hollon SD. Cognitive therapy versus medication for depression: treatment outcomes and neural mechanisms. Nat Rev Neurosci. 2008;9(10):788-796. 27. Fales CL, Barch DM, Rundle MM, et al. Antidepressant treatment normalizes hypoactivity in dorsolateral prefrontal cortex during emotional interference processing in major depression. J Affect Disord. 2009;112(1-3):206-211. 28. Fu CH, Williams SC, Cleare AJ, et al. Attenuation of the neural response to sad faces in major depression by antidepressant treatment: a prospective, event-related functional magnetic resonance imaging study. Arch Gen Psychiatry. 2004;61(9):877-889.
JAMA Psychiatry November 2013 Volume 70, Number 11
Downloaded From: http://archpsyc.jamanetwork.com/ by a University of Wisconsin -Madison User on 11/25/2013
9
Research Original Investigation
10
Increased Prefrontal Cortex Activity
29. Anand A, Li Y, Wang Y, et al. Antidepressant effect on connectivity of the mood-regulating circuit: an FMRI study. Neuropsychopharmacology. 2005;30(7):1334-1344.
event-related fMRI assessment of sustained amygdala activity in response to emotional information in depressed individuals. Biol Psychiatry. 2002;51(9):693-707.
30. Siegle GJ, Steinhauer SR, Thase ME, Stenger VA, Carter CS. Can’t shake that feeling:
31. Hariri AR, Tessitore A, Mattay VS, Fera F, Weinberger DR. The amygdala response to
emotional stimuli: a comparison of faces and scenes. Neuroimage. 2002;17(1):317-323. 32. Murphy SE, Norbury R, O’Sullivan U, Cowen PJ, Harmer CJ. Effect of a single dose of citalopram on amygdala response to emotional faces. Br J Psychiatry. 2009;194(6):535-540.
JAMA Psychiatry November 2013 Volume 70, Number 11
Downloaded From: http://archpsyc.jamanetwork.com/ by a University of Wisconsin -Madison User on 11/25/2013
jamapsychiatry.com