INCREASING FIELD WORK PRODUCTIVITY IN IRRIGATION EVALUATION PROCESSES THROUGH THE USE OF COMBINED IRRIGATION MODELS Sergio Lecina1, Christopher M.U. Neale2, Gary P. Merkley3, Carlos A.C. dos Santos4 1
Visiting Post-doctoral Scholar (from EEAD-CSIC), Dept. of Biological and Irrigation Engineering. Utah State University. 4105 Old Main Hill. Logan, UT 84322. USA. Phone: (435) 797 2476. E-mail:
[email protected] 2 Professor, Dept. of Biological and Irrigation Engineering. Utah State University. 4105 Old Main Hill. Logan, UT 84322. USA. Phone: (435) 797 3689. E-mail:
[email protected] 3 Professor, Dept. of Biological and Irrigation Engineering. Utah State University. 4105 Old Main Hill. Logan, UT 84322. USA. Phone: (435) 797 1139. E-mail:
[email protected] 4 PhD Student, Dept. of Atmospheric Science. Federal University of Campina Grande. 882 Aprigio Veloso. Campina Grande, PB, 58429-900, Brazil. E-mail:
[email protected] ABSTRACT A surface irrigation evaluation process in an irrigation project requires expensive field work. Models that reproduce irrigation events help to analyse the data obtained, and evaluate different scenarios of improvement. The use of combined models that reproduce the interaction between irrigation water and the conveyance and drainage network, agricultural production, and the environment can increase the productivity of the field work. Their results surpass the analyses based only on application efficiency, and provide a wide range of irrigation, hydrological and economic indicators. The application of one of these models (Ador-Simulation) in a study area of the Bear River irrigation project (UT) showed that an increase in irrigation efficiency from 56 to 77 % can be achieved optimizing current irrigation time. This results in a 27 % of water saving over the 2008 demand, and in a little increase in current low economic productivities. INTRODUCTION Irrigation is facing a time of changes. Some of the reasons behind these changes are the liberalization of trade in world agricultural commodity markets, the reductions in agricultural subsidies, the environmental restrictions, and the water scarcity in many areas of the world. Improving water management is a key factor for optimizing the use of this natural resource and achieving economic, social and environmental sustainability in the agricultural sector. Its application is user appreciated and cost effective, since its economic return (conserved water/investment) is often orders of magnitude larger than that obtained from improving the structures (Playán and Mateos, 2006).
Benchmarking is an important tool for improving water management in irrigation projects. It is a systematic process for securing continual improvement through comparison with relevant and achievable goals, norms, and standards (Malano and Burton, 2001). The rapid appraisal process (RAP) is a key part of benchmarking that allows for quickly determining key indicators of irrigation projects (Burt and Styles, 1999; Burt and Styles, 2004). A more detailed diagnosis can be obtained through an irrigation evaluation process. This methodology combines field work and computer simulation. The data obtained in on-farm irrigation evaluations are used for applying simulation models. These models allow the assessment of the current irrigation performance, and identification of the main factor for improving water management. The models applied in this process have evolved from single on-farm irrigation simulation models (Playán et al., 2000; Dechmi et al., 2003; Lecina et al., 2005) to complex models that combine a number of integrated modules which permit us to simulate water flows in an irrigation district (Lecina and Playán, 2006a). This last kind of software has been designed to extend the insight on irrigation district performance gained through the process of irrigation evaluation. In this paper we evaluate a surface irrigation area in the Bear River Basin (Utah) using the model Ador-Simulation. This model reproduces the interaction between irrigation water and the conveyance and drainage network, agricultural production, and the environment. It is composed of five simulation modules covering on-farm irrigation, crop growth, hydrosaline balance, water flow, and decision making in water allocation to farmers. Since the previous models and decision support systems do not include the simulation of the on-farm irrigation system (Merkley, 1994, Yamashita and Walker, 1994, Prajamwong et al. 1997, Mateos et al., 2002), AdorSimulation presents the unique feature of analysing the interaction between on-farm and district irrigation management. A detailed description of this model can be found in Lecina and Playán (2006b). The objective of this study is to show the capabilities of using such models, to improve water management by farmers and by Irrigation Districts/Companies water managers both on-farm and at irrigation project levels, and to support water resources decision making at basin level. This improvement takes into account the preference of the farmers of the study area to maintain current structures. THE STUDY AREA The study area is located close to the town of Tremonton, North Utah (Figure 1). The total irrigated area is 1,213 ha, all of them surface irrigated, and included in the Bear River irrigation project, that irrigates a total of 26.856 ha. This project was developed by a sugar beet company at the beginning of the twentieth century, and is currently managed by the Bear River Canal Co. (BRCC). The climate is continental (the mean temperature is 10 ºC), with a large temperature difference between winter and summer. The mean annual precipitation is 441 mm (82 mm in summer). According to the soil maps of the Natural Resources Conservation Service (NRCS), two main soil units can be distinguished in the study area, located in the terraces of the Malad river (Figure 1). The first unit correspond to Parleys soils (PdA). These
soils are deep, stone-free, and have a loam texture with no salinity problems. This unit occupies 530 ha in the study area. The second unit covers the remaining area and corresponds to Fielding soils (Fd), with similar characteristics, but with a silt-loam texture.
Malad River
Westside Canal
UTAH
Evaluations Canal/Ditch Stream/River
– 0
0.5
Fielding soils 1
2
km
Parleys soils
Figure 1. Location of the study area and irrigation evaluations. The background soil map has been adapted from NRCS. A total of 79 land owners compose the study area, owning a total of 130 plots, according to the 2008 management database of the BRCC. The on-farm irrigation systems are, almost exclusively, blocked-end borders. Alfalfa (35 %) and corn (32 %) are predominant, and grass (11 %) and winter/spring grains (21 %) are also present in the cropping pattern of the area. Only 1 % of the irrigated is not cropped. The main destination of agricultural production is the livestock industry in the region. Water conveyance structures consists of a network of unlined ditches which, starting at 24 headgates at the Westside canal, deliver water to the plots. Each headgate delivers the same discharge to all the plots within its irrigated command area. Irrigation return flows are collected and conveyed through buried drainage collectors that discharge into the Malad River, the natural drainage system of the area, and flow into the Great Salt Lake 25 km downstream. Water deliveries is performed by the ditch riders of the BRCC. A rotation system is used applied with a daily irrigation period of 24 h. According to the classification system proposed by Clemmens (1987) for water delivery systems, the system is negotiated arranged, with fixed discharge. A fixed pricing structure (a specified fee per acre) is applied for water and services billing.
MATERIAL AND METHODS On-farm irrigation evaluation The purposes of the irrigation evaluations were to determine on-farm irrigation performance and to characterize soil infiltration. During 2008 a total of 13 irrigation evaluations were performed within the study area adopting the methodology proposed by Merriam and Keller (1978). Five of them were performed in the Parleys soils, and eigth evaluations were performed in the Fielding soils (Figure 1). Borders were selected which were rectangular in shape. During the irrigation evaluation the farmer performed the normal irrigation practices. A measuring tape was used to determine the border dimensions. The slope and the standard deviation of soil surface elevation were determined from soil surface elevation measurements performed every 10-30 m along the border using a topographic level. Both parameters resulted from regression of elevation vs. distance along the border. The inflow irrigation discharge was measured using a mini-propeller meter. The advance phase was determined from recordings of the advance time to reference points located along the border every 10-30 m. The flow depth at the upstream end of the border was measured shortly before cut off. A number of flow depth measurements were performed across the border, every 3-4 m. The average of all measurements was used to represent flow depth at this point and time. Infiltration and roughness were determined from advance and flow depth using SIRMOD, a hydrodynamic one-dimensional surface irrigation model (Walker, 1993). Such a model was iteratively executed using tentative values of the coefficient k and the exponent a from the Kostiakov infiltration equation, and Manning n. The three parameters were adjusted until the model satisfactorily reproduced the experimental values of flow depth and irrigation advance for each evaluation. The total available water (TAW, mm) (Allen et al, 1998) was determined by a soil survey carried out in the same field where the irrigation was evaluated. A soil sample was obtained in two holes in each plot for the top 0.15 m, and each subsequent 0.30 m until a depth of 1.20 m was reached. Field capacity, wilting point, and moisture content just before irrigation were determined (Soil Survey Division Staff, 1993). Bulk density was also determined at 0.20 m depth. The target irrigation depth (Zr) was determined as 50 % of TAW (Allen et al, 1998). The next step was to determine the irrigation performance indices (Burt et al. 1997). These indices included the application efficiency (Ea) and the low-quarter distribution uniformity (DUlq). Ea expresses the percentage of irrigation water contributing to Zr. DUlq can be defined as the percentage of the average low-quarter infiltrated depth to the average infiltrated depth. Model application The basic data for the simulations were obtained from field work, the BRCC offices, and NRCS soil maps. Such data included on-farm irrigation water management, land tenure, morphology of the irrigation systems, water conveyance structures, crops and soil survey. Simulations were performed for the 2008 irrigation season on a daily basis (hourly for water delivery). The weather this growing season was slightly warmer and drier than the average.
In the Ador-Simulation model, the plot is the basic geographical unit. A typical irrigation unit (a border in this case) is characterized for each plot. Irrigation simulation is performed in the typical irrigation unit and extended to the whole plot area. In a large irrigation district it would be unmanageable to identify, characterize and simulate all borders in all cadastral plots. Therefore, a typical border was defined as characteristic of the irrigated area for each headgate (measured at the cartographical restitution of an aerial photograph, and taking into account the slopes determined in the on-farm evaluations). One of the two soil units of the study area was assigned to each plot according to the soil maps. The initial soil water depletion at the onset of the simulation period was estimated from the meteorological conditions prevailing during the weeks preceding sowing. Depletion was established as a percent of TAW. The sowing date for each crop was statistically assigned, following the statistical distribution derived from farmers’ interviews. Each plot was related to a water conveyance network element (an irrigation ditch), and to the drainage network. In the case of the irrigation network, each element was characterized by a service and a conveyance discharge, which were obtained from the BRCC. Crop growth and irrigation simulations were performed on the typical border of each plot. An irrigation was requested when 25 % of the border area was under water deficit (soil water depletion above allowable depletion). The duration of the phenological phases and the crop coefficients, the values of the thermal integral and the related temperature threshold, were derived from local experiences (Hill, 1994). The FAO methodology (Allen et al., 1998) was applied for computing the crop water requirements. The weather data was obtained from a weather station of the Utah State University Extension Service located in Tremonton. The Stewart coefficients for the determination of water stress sensitivity were obtained from the work by Doorembos and Kassam (1979). The common irrigation practices were gathered from farmers and BRCC manager interviews, and used to establish the relationship between agronomy and irrigation: pre-sowing irrigation, irrigation events following alfalfa and forage harvest. Yields, the economic value of crops, and costs were obtained from Government statistics. The simulation of the current water performance was based on the cutoff time determined in the irrigation evaluations. In all evaluations, the cutoff time was longer than required to refill the soil water deficit. A simulation was performed in the typical border defined as characteristic of the irrigated area of each headgate to determine the optimum cutoff time. This optimum can be defined as the minimum cutoff time necessary in order to ensure that the average low-quarter infiltrated depth in the border attained at least Zr. The irrigation evaluations were equally optimized, and the ratio of real to optimum irrigation time was obtained for each soil type. This ratio was used to estimate the “real” irrigation time for each headgate under the current water management practices. Two simulations of the water flows in the whole study area were carried out. The first simulated a representative scenario of the current conditions of on-farm irrigation practices in 2008. The second simulated the water flows for a scenario of optimum irrigation time. A number of irrigation quality, hydrological and
economic indicators were computed from the obtained results (Burt et al., 2007; Molden et al., 1998; Willardson et al., 1994). RESULTS AND DISCUSSION On-farm irrigation evaluation Table 1 presents the aggregated results of the irrigation evaluations, distinguishing the two soil units. The evaluated crops were alfalfa and spring grains. The border size averaged about one and a half hectares, with a moderate variability. Borders are larger in Parleys soils than in Fielding soils. The field slope has a wide range of variation. On average, the slope was similar in both soil units (about 1.61 ‰). The standard deviation of soil surface elevation ranged between 10 and 22 mm, with an average value of 15 mm. These values indicate that laser levelling is often practiced in the study area. Table 1. Results of the irrigation evaluations performed in the study area.
2
Area (m ) Width (m) Slope (0/00) Standard deviation of soil surface elevation (mm) Discharge (m3 s-1) Irrigation time (h ha-1) Irrigation depth (mm) Manning n Kostiakov k (m min-1) Kostiakov a Total Available Water (mm) Application Efficiency (%) Low Quarter Distribution Uniformity (%)
Average CV (%) Average CV (%) Average CV (%) Average CV (%) Average CV (%) Average CV (%) Average CV (%) Average CV (%) Average CV (%) Average CV (%) Average CV (%) Average CV (%) Average CV (%)
Parleys soils Fielding soils 12,589 17,569 47 21 37 49 17 20 1.89 1.48 31 58 13 16 38 22 0.091 0.091 53 14 5.70 7.18 49 22 144 230 22 19 0.18 0.23 20 13 0.0145 0.0173 15 18 0.318 0.376 4 5 204 228 6 4 65 51 18 18 66 74 18 13
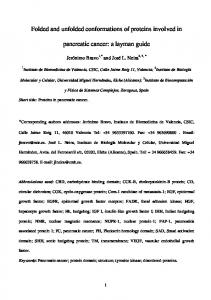
The irrigation discharges present a large variability –between 50 and 120 l s-1- among irrigation ditches. Discharges were similar in both soil units, with an average of 91 l s-1. The irrigation times, although largely variable as a function of the irrigation discharge, were long: about six hours per hectare in Parleys soils and seven hours per hectare in Fielding soils. The irrigation application depth was generally high, with an average of 144 mm in Parleys soils, and 230 mm in Fielding soils. These irrigation depths were due to the available discharges, and to the irrigation scheduling influenced by soil physical characteristics and the presence of a water table. The TAW was high and uniform, with an average of 204 and 228 mm for Parleys and Fielding soils respectively. The seepage from the Westside canal resulted in the presence of a water table at a depth of about 1.30 and 1.50 m according to a piezometer network available in the area. The soil moisture of the vadose zone was used by crops for evapotranspiration, and constitutes a second source of water for this purpose. This effect was checked by the soil moisture determinations carried out just before the irrigation events. In an irrigation interval of about four weeks, the soil water depletion was about 55 % of the crop evapotranspiration. Figure 2 presents the infiltration functions derived from the irrigation evaluations. The graphical representation has been grouped by soil unit. Based on these infiltration characteristics, two infiltration functions were derived and later applied to the simulation of irrigation in the study area. Infiltration in Fielding soils is larger than in Parleys soils. However, the geometry, slope, and discharge of the borders suggest that farmers have not taken soil infiltration rate differences into consideration. The main reason for that is the high spatial variability of the distribution of the soil units in the study area (Figure 1). Only in 9 of the 24 headgates contain a predominant soil unit occupying 85 % or more of the irrigated area. 0.350 0.300
Parleys soils z = 0.0145 0.318
Fielding soils z = 0.0173 0.376
R2 = 0.915
R2 = 0.912
Infiltration, m
0.250 0.200 0.150 0.100 0.050 0.000 0
100
200
300
400
500 0
100
200
Time, min Evaluations
Infiltration class
300
400
500
Time, min Evaluations
Infiltration class
Figure 2. Infiltration functions corresponding to borders in Parleys and Fielding soils. The figures present results from the irrigation evaluations (symbols) and average infiltration curves (lines) and corresponding equations.
Application efficiency reached 65 % in Parleys soils, with uniform frequencies in a range of 54 to 87 %. In Fielding soils, the average application efficiency was 51 %, ranging from 35 to 63 %. These values of Ea can be classified as low, and the potential improvement for current irrigation pratices will be shown below. The minimum DUlq was 55 %. In the Parleys soils the average uniformity was 66 %, while the average value for Fielding soils was 74 %. The accumulation of water at the end of the blocked-end borders is the main reason for these low values. Model application The first step was to optimize the cutoff time of the irrigation evaluations. The results showed that it is possible to reduce the irrigation time to an average of 5.2 h ha-1 ensuring that the average low-quarter infiltrated depth in the border attains at least Zr. This reduction allows for the increase of the application efficiencies to 72 % in Parleys soils, and 67 % in Fielding soils, with irrigation depths of 0.140 and 0.170 mm respectively. The simulation of water flows in the whole study area for the scenario of current conditions of on-farm irrigation practices in 2008 considered the irrigation times determined in the evaluations. A number of parameters related to irrigation scheduling, conveyance network water losses, and evapotranspiration from the vadose zone were also considered in the simulation of the whole study area. Irrigation scheduling parameters were the minimum interval between irrigations, and the maximum number of irrigations per crop. These parameters were provided by farmers and BRCC managers. Corn is irrigated between four and five times per season, with a minimum average interval of 14 days. Alfalfa and grass present the same number of irrigations but with an interval of about 28 days. Grains are irrigated three times per season in a minimum average interval of 21 days. A previous study carried out by the BRCC determined that the average seepage and spills water losses in the conveyance network are about 10 % of the total water delivered from headgates. A layer with constant moisture (field capacity) was considered in the model for reproducing the effect of the water table over the crop evapotranspiration. The depth of this layer was estimated at 0.70 m -over a root zone of 1.20 m- for obtaining similar water depletions just before irrigation to the depletions determined in the irrigation evaluations carried out during July and August. Figure 3 shows the monthly water demand of the study area provided by the BRCC, and the demand simulated with the model. On a cumulative basis, the simulation results compare well with the BRCC data, with a seasonal difference of 3 %. On a monthly basis, during the peak of the season the differences vary between 2 and 10 %. In spring and autumn the differences are highly variable, reaching values between 8 and 35 %. These differences can be attributed to the agronomic practices of the farmers, which are difficult to establish and model. Additionally, soil infiltration during the first irrigation of the season is usually very large. Initial soil water content, temporal distribution of conveyance network water losses and water table depth oscillation are other factors which influence these monthly differences.
3,500,000
Water demand, m 3
3,000,000 2,500,000 Model
2,000,000
BRCC
1,500,000 1,000,000 500,000
O ct ob er
be r
t
Month
Se pt em
Au gu s
Ju ly
Ju ne
ay M
Ap ril
0
Figure 3. Water demands as registered by BRCC and simulated by Ador-Simulation in the study area. The simulation of water flows in the whole study area for the scenario of optimum irrigation practices considered the optimized irrigation times determined for the evaluated irrigation events. The same values of irrigation intervals, percentage of conveyance network water losses and depth of the constant soil moisture layer were considered. Table 2 shows the values of different indicators for the two simulated scenarios. The optimization of the cutoff time increase efficiencies about 20 %, to an average of 75 %, and DUlq from 62 to 75 %. The high TAW of the soils, the initial soil water content, and the vadose zone are the main factors that explain the reduced differences between application and irrigation efficiencies. Improving on-farm irrigation practices would allow the reduction of water demand by 27 %, equivalent to a volume of 3,3 hm3. The reduction could be higher if improvements in water delivery management are achieved, but this study did not have enough data for this estimation. This volume not only represents a water conservation, but also, a water saving due to the diminished irrigation returns flow to the nearby Great Salt Lake where this water can not be reused. For this reason, the consumptive fraction of the water demand is 100 %. The productive (crop evapotranspiration) consumptive fraction is increased from 60 to 77 % due to the reduction of return flows, and a minimal increase of the crop evapotransporation. The vadose zone contributes to this evapotranspiration with an estimated volume of 1,8 hm3. The difference between real and potential crop evapotranspiration is about 9 % in both scenarios, similar to other irrigation projects in the USA (Allen et al., 2005). This difference is mainly due to the effect of low DUlq, the optimization of cutoff time until the Zr is reached in the average low-quarter infiltrated depth in the borders, and the irrigation intervals applied. Although the capacity of the conveyance network allows for increasing the number of irrigation events with the irrigation times
adopted, the impact over crop evapotranspiration and yields are minimum, about 2 % (results not shown). Table 2. Summary of simulation results obtained through the application of AdorSimulation to the current scenario of the study area and an optimized scenario. Current Optimized Scenario Scenario IRRIGATION INDICATORS Irrigation time, h ha-1 Average Application Efficiency, % Average Irrigation Efficiency, % Average LQ Distribution Uniformity, % HYDROLOGICAL INDICATORS Canal Water Demand, hm3 Precipitation, hm3 Water Use from Vadose Zone Crop Evapotranspiration, hm3 Irrigation and Rain Return Flows, hm3 Seasonal Soil Water Variation Consumptive Fraction, % Productive Consumptive Fraction, % Crop Evapotranspiration Reduction, % ECONOMIC INDICATORS Crop Yield Reduction, % Crop Gross Value Reduction, % Crop Gross Value, M$ Crop Net Value, M$ Gross Surface Productivity, $ ha-1 Net Surface Productivity, $ ha-1 Gross Consumptive Water Productivity, $ m-3 Net Consumptive Water Productivity, $ m-3
6.8 53 56 62
4.6 74 77 75
12.27 1.25 1.88 9.55 6.25 -0.40 100 60 9
8.96 1.25 1.78 9.59 2.90 -0.51 100 77 9
14 12 1.488 0.504 1226 416 0.092 0.031
12 10 1.516 0.532 1249 439 0.117 0.041
The crop evapotranspiration reductions imply a yield reduction of about 14 % in the current scenario, and 12 % in the optimized scenario, and consequently, a reduction in the gross crop production value of 12 and 10 % respectively. Due to these small differences between scenarios, and the low value of these field crops, the economic incentives for adopting a more careful control over irrigation time are negligible for the farmers. The net surface productivity is only increased by 23 $ ha-1. Similar effects occur over low consumptive water productivities, whose value is lower than the average of US (Clemmens et al, 2008). Nevertheless, the water saving obtained from improving on-farm irrigation practices can increase the water availability in drought years, and this fact can constitute a true incentive for farmers. In order to achieve the results shown in the Table 3 for the scenario of optimum irrigation practices, the farmers should apply the findings obtained in this study about irrigation time. For this purpose, a number of graphics like the one shown in Figure 4 were developed. These figures indicate the irrigation
7.0 -1
100 90 80 70 60 50 40 30 20 10 0
Irrigation time, h ha
Application efficiency, %
time that optimizes the application efficiency considering different unitary discharge and slopes, and a Zr equivalent to 50 % of TAW. As Burt and Styles (2000) pointed out, technical assistance to farmers and districts/companies is a key factor for improving water management.
Parleys soils
6.0 5.0 4.0 3.0 2.0 1.0
Parleys soils
0.0 0.0
1.0
2.0
3.0
4.0 -1
0.0
5.0
-1
0.002
0.003
0.000
7.0 -1
0.001
3.0
4.0
5.0
-1
Discharge / Width, l s m
Irrigation time, h ha
Application efficiency, %
0.000
2.0
-1
Discharge / Width, l s m 100 90 80 70 60 50 40 30 20 10 0
1.0
Fielding soils
0.001
0.002
0.003
6.0 5.0 4.0 3.0 2.0 1.0
Fielding soils
0.0 0.0
1.0
2.0
3.0
4.0 -1
5.0
0.001
0.002
1.0
2.0
3.0
4.0 -1
-1
5.0
-1
Discharge / Width, l s m
Discharge / Width, l s m 0.000
0.0
0.003
0.000
0.001
0.002
0.003
Figure 4. Application efficiencies for optimized irrigation times with a discharge of 85 l s-1 and different widths and slopes (m/m) in Parleys soils (with Zr of 102 mm) and Fielding soils (with Zr of 114 mm). CONCLUSIONS The productivity of irrigation evaluation field work processes can be notably increased by the use of combined models like Ador-Simulation. These models surpass the analyses based only on application efficiency, and provide a wide range of irrigation, hydrological and economic indicators. The results can be useful for farmers and irrigation projects managers in order to improve on-farm irrigation practices, water delivery, and structures. River Basin Authorities managers can analyse potential water conservation and/or water saving in the agricultural water uses of the basin, and the economic and water security effects on farmers. The application of this methodology to the study area in the Bear River irrigation project has shown that optimizing irrigation time can provide a potential of water
saving of about 27 % over the 2008 water demand. Although the effects of this improvement on the economic value of crop production and productivities are low, the water conserved could be important for reducing economic losses during drought years as the Bear River Canal Company could store some of that water in Bear Lake, upstream. The simulation can be easily applied to other years if managerial data are available, for example from RAPs, and using the data obtained from the field work performed in 2008. ACKNOWLEDGEMENT Thanks are due to the managers and farmers of the Bear River Canal Co., and technicians of the Utah State University Extension Service for their support. The postdoctoral contract of S. Lecina was funded by the Spanish Ministry of Science and Innovation and the Spanish Foundation for Science and Technology. REFERENCES Allen, R.G., Pereira, L.S., Raes, D., Smith, M. (1998). “Crop evapotranspiration. Guidelines for computing crop water requirements”. FAO Irrigation and Drainage Paper nº 56. FAO. Rome (Italy). 300 pp. Allen, R.G., Clemmens, A.J., Burt, C.M., Solomon, K., O’Halloran, T. (2005). “Prediction accuracy for projectwide evapotranspiration using crop coefficients and reference evapotranspiration”. J. Irrig. Drain. Eng. 131(1):24-36. Burt, C.M., Styles, S.W. (1999). “Modern water control and management practices in irrigation. Impact on performance”. FAO Water Reports No. 19. FAO. Rome (Italy). 223 pp. Burt, C. M., Styles, S. W. (2000). "Irrigation district service in the western United States." Journal of Irrigation and Drainage Engineering-Asce, 126(5), 279-282. Burt, C.M., Styles, S.W. (2004). “Conceptualizing irrigation project modernization through benchmarking and the rapid appraisal process”. Irrigation and Drainage, 53:145-154. Burt, C.M., Clemmens, A.J., Strelkoff, T.S., Solomon, K.H., Bliesner, R.D., Hardy, L.A., Howell, T.A., Eisenhauer, D.E. (1997). “Irrigation performance measures: efficiency and uniformity”. J. Irrig. Drain. Engrg., ASCE, 123(6),423-442. Clemmens, A.J. (1987). “Delivery system schedules and required capacities”. In: Planning, operation, rehabilitation and automation of irrigation water delivery systems. Portland, OR (USA). pp. 18-34. Clemmens, A. J., Allen, R. G., and Burt, C. M. (2008). "Technical concepts related to conservation of irrigation and rainwater in agricultural systems." Water Resources Research, 44, 16. Dechmi, F., Playán, E., Faci, J.M., Tejero, M., Bercero, A. (2003). “Analysis of an irrigation district in northeastern Spain: II: Irrigation evaluation, simulation and scheduling”. Agric. Wat. Manage., 61, 93-109. Doorembos, J., Kassam, A.H. (1979). Yield response to water. FAO Irrig. and Drain. Paper nº 33. FAO. Rome (Italy). 212 pp. Hill, R.W. (1994). “Consumptive use of irrigated crops in Utah”. Research Report 145. Utah Agricultural Experiment Station. Utah State University. Logan, UT (USA). 361 pp.
Lecina, S., Playán, E., Isidoro, D., Dechmi, F., Causapé, J., Faci, J.M. (2005). “Irrigation evaluation and simulation at the irrigation district V of Bardenas (Spain)”. Agric. Wat. Manage., 73, 223-245. Lecina, S., Playán, E. (2006a). “A model for the simulation of water flows in irrigation districts: II. Application”. J. Irrig. and Drain. Engrg., ASCE, 132(4):322-331. Lecina, S., Playán, E. (2006b). A model for the simulation of water flows in irrigation districts: I. Description. J. Irrig. and Drain. Engrg., ASCE, 132(4):310321. Malano, H., Burton M., (2001). “Guidelines for benchmarking performance in the irrigation and drainage sector”. In: International Programme for Technology and Research in Irrigation and Drainage, 2001. Mateos, L., López-Cortijo, I., Sagardoy, J.A. (2002). “SIMIS: the FAO decision support system for irrigation scheme management”. Agric. Wat. Manage., 56, 193-206. Merkley, G.P. (1994). “Planning Distribution Model. A simulation tool for water management planning in large-scale irrigation and drainage networks. User's Guide”. Biological and Irrigation Engineering Department, Utah State University. Logan, UT (USA). 104 pp. Merriam, J.L., Keller, J. (1978). “Farm irrigation system evaluation: A guide for management”. Utah State University. Logan, UT (USA). 271 pp. Molden, D.J., Sakthivadivel, R., Perry, J., Fraiture, C., Kloezen W.H. (1998). “Indicators for comparing performance of irrigated agricultural systems”. Research Report 20, International Water Management Institute. Colombo, Sri Lanka. 26 pp. Playán, E., Mateos, L., (2006). “Modernization and optimization of irrigation systems to increase water productivity”. Agric. Wat. Manage., 80, 100-116. Playán, E., Slatni, A., Castillo, R., Faci, J.M. (2000). “A case study for irrigation modernisation: II. Scenario Analysis”. Agric. Wat. Manage., 42, 335-354. Prajamwong, S., Merkley, G.P., Allen, R.G. (1997). “Decision support model for irrigation water management”. J. Irrig. and Drain. Engrg., ASCE, 123(2), 106113. Soil Survey Division Staff. (1993). “Soil survey manual”. United States Department of Agriculture. Handbook No. 18. Washington, D.C. (USA). Yamashita, S., Walker, W.R. (1994). “Command area water demands. Part I. Validation and calibration of UCA model”. J. Irrig. and Drain. Engrg., ASCE, 120(6), 1025-1042. Walker, W.R. (1993). “SIRMOD, Surface irrigation simulation software”. Utah State University. Logan, UT (USA). 27 pp. Willardson, L.S., Allen, R.G., Frederiksen, H.D. 1994. “Elimination of irrigation efficiencies”. In: 13th Tech. Conf. USCID, USCID (Ed.), 19-22 October, at Denver, CO (USA). 17 pp.