2016 IEEE Electrical Power and Energy Conference (EPEC)
Incremental Mining of Frequent Power Consumption Patterns from Smart Meters Big Data Shailendra Singh, Abdulsalam Yassine, Shervin Shirmohammadi Distributed and Collaborative Virtual Environments Research Laboratory School of Electrical Engineering and Computer Science, University of Ottawa 800 King Edward Street,Ottawa, Canada
[email protected],
[email protected],
[email protected]
Abstract—The key elements for understanding power consumption of a typical home are related to the activities that users are performing, the time at which appliances are used, and the interdependencies with other appliances that may be used concurrently. This information can be extracted from context rich smart meters big data. However, the main challenge is how to mine complex interdependencies among different appliances usage within a home where multiple concurrent data streams are occurring. Furthermore, generation of energy consumption data from a smart meter is an ongoing continuous process and over period of time inter-appliance associations can change or new ones can establish. In this paper, we propose incremental mining of frequent power consumption patterns from smart meters big data. Our model exploits the benefits of pattern growth strategy and mine in quantum of 24 hour period, i.e. frequent patterns are extracted from data comprising of appliance usage tuples for 24 hours period, in a progressive manner. The details and the results of evaluating the proposed mechanism using real smart meters dataset are presented in this paper.
I. I NTRODUCTION Currently, millions of homes are being equipped with smart meters, capable of generating data measurements of more than 100 energy consumption data points every 15 minutes resulting in a massive volume of data [1]; i.e smart meters big data. The generated big data have a time-series notion typically consist of usage measurements of component appliances over a time interval [2]. Extracting appliance usage patterns from smart meters big data is extremely valuable for effective demand side management mechanisms and energy conservation policies. In reality, end uses of energy in residential premises is related to the activity that the user is performing, the time at which an appliance is used, and the interdependencies with other appliances that may be used concurrently. For example, a user might charge the electric vehicle at the same time when the washing machine is on, or the user finds it convenient to watch the TV whenever he/she is ironing clothes. These relationships are key elements for understanding power consumption of a typical home. Demand side management schedules that consider shifting the operation of appliances from one time slot to another, while ignoring their association and correlation relationships, may not meet the user’s preference requirements; which is not acceptable. The main challenge, however, is how to mine complex interdependencies among different appliances usage within a home where multiple concurrent time-series data streams are occurring. In
978-1-5090-1919-9/16/$31.00 ©2016 IEEE
addition, generation of energy consumption data from a smart meter is an ongoing continuous process and over period of time inter-appliance associations can change or new ones can establish. To address the above challenge, in this paper we propose frequent pattern mining technique as a means of extracting vital information about energy consumption behavior. We propose an incremental mining of frequent power consumption patterns from smart meters big data. The model exploits the benefits of pattern growth strategy and mine in quantum of 24 hour period, i.e. frequent patterns are extracted from data comprising of appliance usage tuples for 24 hours period, in a progressive manner. The main contribution of our mechanism is that it takes behavioral variations in the order of appliances usage into consideration, by examining energy consumption patterns incremental and progressively, to discover occupants personal preferences; which can to be one essential input parameter to energy programs to buy-in consumer confidence and achieve greater success. We propose to use interestingness measure Kulczynski Measure (Kulc)] [5] alongside Imbalance ratio (IR) [5] to supplement support − conf idence frame-work, which can ensure effective elimination of uninteresting rules. The use of Kulc alongside IR ensures selection of not only frequent but non-so-frequent patterns of interest. For the evaluation of the proposed mechanism, we use the UK Domestic Appliance Level Electricity dataset [7]; which includes time series data of power consumption collected from 2012 to 2015 with time resolution of 6 seconds for five houses with 109 appliances from Southern England. The details and the results of evaluating the proposed mechanism are presented in this paper. The organization of this paper is as follows: The next section II discusses the related work. In section III, the proposed model is presented followed by evaluation results in section IV. Finally, we conclude the paper and discuss future direction in section V. II. R ELATED WORK Mining appliance usage and association in form of frequent patterns from context-aware smart-meter data can reveal surprising underlying information. In this section, we present existing studies that are directly related to frequent pattern mining of smart meters big data.
2016 IEEE Electrical Power and Energy Conference (EPEC)
P h ase - I I I I n t er - A p p l i an ce A sso ci at i o n R u l es G en er at i o n
TABLE I F REQUENT PATTERN S OURCE DATABASE
Vi su al i z at i o n
P h ase - I I I n cr em e n t al F r eq u en t Pa t t er n s Pr o g r ess i ve I n t er - A p p l i an ce F r eq u en t Pat t er n A sso ci a t i o n s Mining
P er si st a n t D at ab ase
F r eq u en t P at t e r n s
As so c i a t i o n Rules
Ph ase - I V
D at a P r e - p r o ce ssi n g
F So P ur Min ce in Da g ta
S m ar t M et er
30 minutes time interval are included into source database for frequent pattern data mining. The real dataset UK-Dale [7] had over 400 million raw records of five houses with a time resolution of 6 seconds. We reduced it to 20 million during preprocessing phase without loss of accuracy or precision. In table (I), we show an example of the resultant ready to mine source data format of four appliances in one house.
Ph ase - I
Fr Pa eq tt ue er n ns t
R aw Da t a
Apriori
FP-growth
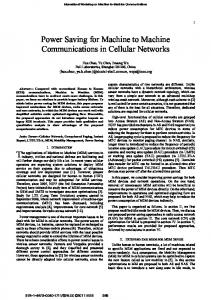
Fig. 1. Model: Incremental frequent pattern & association rules mining
The work presented by [2] and [8] uses sequential pattern mining to understand electrical appliance usage patterns with a goal to conserve energy. Similarly, [9] uses incremental sequential mining technique to discover correlation patterns among appliances, and proposes a new algorithm offering reduction in memory with improved performance. The approach provided by [10], uses rule mining along with JMeasure to filter strong rules. It analyzes appliance energy consumption and related behavioral characteristics to assist energy conservation, demand-response and anomaly detection. The study in [11] utilizes sequential association rule mining in conjunction with hierarchical clustering to extract appliance associations with time and occupants activities to forecast energy consumption. The above discussed approaches does not take human behavioral variations, such as high uncertainty in order of use of appliances to complete an activity, or variations, such as increased or reduced frequency of use of appliances due to seasons. These dissimilarities have direct influence over energy consumption patterns, which results in increased number of patterns to be analyzed along with different interpretation of same event/activity at different occasions. We address these shortcomings by adapting incremental progressive unsupervised machine learning through frequent pattern mining, translating energy consumption patterns into frequent patterns representing inter-appliance associations, as an illustration of occupant behavior. III. P ROPOSED M ODEL Figure 1 represents our proposed model with distinct four phases; data preparation, frequent pattern mining, association rules generation, and visualization. In this section, we discuss these phases and provide details about the proposed mechanism. A. Data preparation Smart meters time-series raw data, which is a high timeresolution data, is transformed into 1 min resolution load data; subsequently translated into a 30 minutes time-resolution source data, i.e. 24 * 2 = 48 readings per day, while recording usage duration, average load, and energy consumption for each active appliance. All the appliances registered active during the
Start Time End Time 2013-08-01 07:00 2013-08-01 07:30 2013-08-01 07:30 2013-08-01 08:00 where, 10 = Laptop, 11 = Monitor, 15 =
Active Appliances ’10 11 15 16’ ’10 15 16’ Speakers, 16 = Washing Machine
B. Frequent Pattern Mining Frequent patterns are repeated patterns or itemsets, which often appear in a dataset. Considering smart-meter data, an itemset, comprising of laptop and washing machine, that often presents itself together is a frequent pattern. Hence, frequent pattern mining can help discover association and/or correlation among appliances, which defines relationship among data interpreting consumer energy consumption behavior. Therefore, with enormous quantity of data progressively being collected from smart meters; it is not only of keen interest to energy producers and utilities, but also to end- user consumers to mine such frequent patterns for defining and facilitating decisionmaking processes such as energy saving plans, demand response optimization, and cost reduction. C. Frequent Itemsets and Association Rules In this subsection, we introduce preliminary background on frequent pattern mining based on [5]. Let Γ = {I1 , I2 , ..., Ik } be an itemset containing k items (appliances) which is referred to as k-itemset (lk ). Let DB, represents transaction database with a set of transactions as described in table (I), where each transaction Υ is an itemset (set of appliances) having Υ ⊆ Γ and Υ 6= ∅. The frequency of appearance of an itemset is the number of transactions that contain the itemset, defined as support count, or count of the itemset. Let, X and Y be set of items, such that X ⊆ Υ and Y ⊆ Υ. Itemsets X and Y are considered frequent itemsets or patterns, provided respective support sX and sY , if the percentage of transactions of the itemset appears in the transaction database DB are greater than or equal to minsup; where minsup is the pre-defined minimum support threshold. support can be viewed as probability of itemset in transaction database DB. This is referred to as relative support, whereas the frequency of occurrence is known as absolute support. Hence, if the relative support of an itemset X(sX ) [or Y (sY )] satisfies a pre-defined minimum support threshold minsup, then the absolute support of X (or Y ) satisfies the corresponding minimum support count threshold. Association rules are results of the second iteration of the frequent pattern mining process, where already discovered frequent patterns are processed to generate association rules.
2016 IEEE Electrical Power and Energy Conference (EPEC)
Rules, of form {X ⇒ Y }, are generated using support − conf idence framework, where support sX⇒Y is the percentage of transactions containing (X ∪ Y ) in transaction database DB, which is also can be seen as the probability P (X∪Y ). The conf idence cX⇒Y is defined as the percentage of transactions in DB containing X that also contain Y , which is the conditional probability, P (Y |X) [5]. Equations (1) and (2) capture the above notions respectively. support(X ⇒ Y ) = P (X ∪ Y ) = support(X ∪ Y ) support(X ∪ Y ) conf idence(X ⇒ Y ) = P (Y |X) = support(X)
(1) (2)
Hence, an association rule established as {X ⇒ Y }, where X ⊂ Γ, Y ⊂ Γ, X ∩ Y = ∅, X 6= ∅, and Y 6= ∅, with support sX⇒Y ≥ minsup and conf idence cX⇒Y ≥ minconf are classified as strong, where minconf is pre-defined minimum confidence threshold. Additionally, association rule’s support sX⇒Y will automatically satisfy the minimum support threshold as the rules are essentially generated from frequent patterns X, and Y having respective support sX , sY ≥ minsup. Thus, once the support for X, Y , and (X ∪ Y ) are determined, corresponding association rules {X ⇒ Y } and {Y ⇒ X} can be extracted, which satisfies minsup and minconf i.e. association rule generation process can be deduced to a two-step operation; first, frequent pattern mining, and second, generating strong association rules of interest [5]. D. Incremental Approach of Data Mining for Frequent Pattern Extraction using FP-growth: Discovering Inter-Appliance Associations In this subsection, we discuss our proposed approach towards incremental progressive frequent pattern mining along with additional interestingness measures for the discovery of correlation relationships. The mining of frequent patterns is generally considered as an off-line and costly process on large databases. In, a real world application, transaction data generation is a continuous process, where new transactions are generated and old transactions may become obsolete as the time progress. In such situation, existing frequent patterns are invalidated and/or new frequent pattern associations are established. Therefore, an incremental and progressive update strategy is imperative, where these variations/updates are taken into account and discovered frequent patterns are duly maintained. For example, an appliance such as room-heater generally will be used during winter and we can expect reduced usage frequency during other seasons. As an effect a significant gain in support during winter but decrease during other seasons will be registered. As a result, room-heater should appear higher on the list of frequent patterns and association rules during winter, but much lower during summer or spring. This objective can be achieved through progressive incremental data mining while eliminating the need for re-mining the entire database at a regular interval. Frequent pattern mining in a large database can be accomplished through pattern growth approach [3], [4].
We extend pattern growth approach and present an incremental frequent pattern mining strategy of progressive manner, which is discussed next. 1) FP-growth : A Pattern-Growth Approach, Without Candidate Generation For Mining Frequent Itemsets: Apriori [6] algorithm with candidate generation approach suffers from two problems, it generates a large number of candidate sets and repeatedly searches through the entire database to find support for an itemset. To overcome these deficiencies, the work in [3] and [4] proposed pattern growth or FP-growth approach, which exploits the divide-and-conquer technique. To start with, it generates a compact representation of transactions from database in form of frequent pattern tree or FP-tree. FP-tree preserves the association information, derived from each individual transaction, along with support count for each constituent item. Next, conditional databases(tree) for each frequent item is extracted from FP-Tree to mine frequent patterns, which the item under consideration is part of. Therefore, inspecting only divided portion relevant to the item and its associated growing patterns, and addressing both the shortcoming of Apriori approach. 2) Incremental frequent pattern extraction: Our proposed technique exploits the benefits of pattern growth strategy and extends it to achieve incremental progressive mining of frequent patterns by mining in quantum of 24 hour period, i.e. frequent patterns are extracted from data comprising of appliance usage tuples for every 24 hours period, in a progressive manner. With this approach, we mine only a portion of entire database at each iteration thus reducing the memory overhead for FP-growth strategy and achieve improved efficiency. In our proposed approach, available data is recursively mined in quantum of 24 hours, and frequent patterns discovered database, represented in table II, is maintained across successive mining exercises. In other words, data mining can be viewed as a process conducted at the end of each day in an incremental manner. During each consecutive mining operation, support count and database size for the existing frequent patterns are incremented and new patterns, with applicable support count and database size, are added to persistent database. Moreover, we cease the use of minimum support threshold minsup at the mining stage to eliminate any candidate patterns, resulting in discovery of all the possible frequent patterns. This change in technique is incorporated to avoid missing candidate patterns, which can become frequent if time quantum is increased or complete database is mined in a single operation. At the end of mining process, database size is updated for all the frequent patterns in the frequent patterns discovered database (table II) to ensure correct computation of support. Frequent patterns discovered database (table II), can be maintained in-memory using hash table data-structure or off the memory in Database Management System (DBMS). The latter approach reduces the memory requirement on the cost of marginal increase in processing time, whereas former approach reduces processing time but requires more memory. Considering smart meter environment although quicker processing
2016 IEEE Electrical Power and Energy Conference (EPEC)
time is of importance, however persistence of information discovered through days, months or years is more vital to achieve useful and usable results for the future. Therefore, we prefer permanent storage using DBMS over in-memory volatile storage. We present the extended two-step process for frequent pattern mining using FP-growth, i.e. constructing FP-Tree and generating frequent patterns, in algorithm (1). Algorithm (2) outlines the mechanism to achieve persistent storage of frequent patterns discovered from mining process into a permanent storage such as DBMS. Step-1 Constructing Frequent Pattern Tree (FP-Tree): It takes two scans of transaction database; first to create the list of 1-itemset frequent itemsets with support, and second to construct the FP-Tree [3], [4]. In our setting, we do not eliminate 1-itemset frequent itemsets based on minimum support threshold (minsup) for the reasons discussed earlier, which is a departure from original proposed algorithm by [3], [4]. Step-2 Generating Frequent Patterns: Once FP-Tree is created, bottom-up recursive elimination approach is taken to generate complete set of frequent patterns from FP-Tree. FPtree mining is accomplished by starting from each frequent length-1 pattern (as an initial suffix pattern), and constructing its conditional − pattern − base from prefix paths extracted from FP-tree, where suffix co-occur with prefix. Later, conditional−F P −tree is created from conditional− pattern−base and mined. The pattern growth is accomplished through concatenation of the suffix pattern with the frequent patterns generated from a conditional FP-tree. For the purpose of making frequent patterns available for future manipulation and utilization, we store all the frequent patterns extracted into a DBMS. Algorithm 1 Incremental Frequent Pattern Mining Require: Transaction database DB Ensure: Incremental discovery of frequent patterns, stored in frequent patterns discovered database F P DB 1: for all 24 hour quantum transaction data db24 in DB do 2: Determine database size Database Sizedb24 for db24 3: Constructing Frequent Pattern Tree (FP-Tree) {As described in Step-1} 4: Generating Frequent Patterns, while calling function save update f requent pattern to save frequent patterns to frequent patterns discovered database F P DB {As described in Step-2} 5: end for 6: For all Frequent Patterns in Database F P DB increment Database Size by Database Sizedb24 The results of frequent pattern mining are represented in table (II). Thus, a frequent pattern of this form, for example ”Laptop, Monitor, Speakers”, represents association among appliances or inter-appliance associations. The respective probabilistic evidence, supporting occurrence of these association, can be computed as shown in equation (1).
Algorithm 2 Function save update f requent pattern Require: Frequent Pattern extracted F P extracted, support count absolute support, Frequent pattern discovered database F P DB Ensure: Add or update Frequent Pattern in frequent patterns discovered database 1: Search a frequent pattern F P = F P extracted in F P DB 2: if Frequent Pattern found then 3: Increment support count by absolute support. 4: else 5: Add a new Frequent Pattern with support count absolute support and Database size = 0. 6: end if TABLE II F REQUENT PATTERNS :
FREQUENT PATTERNS DISCOVERED DATABASE
Frequent Pattern Absolute Support Database Size ’10 11’ 3939 7899 ’10 15’ 2840 7899 ’10 11 15’ 2649 7899 ’11 15’ 2649 7899 ’10 11 15 16 ’ 1299 7899 where, 10 = Laptop, 11 = Monitor, 15 = Speakers, 16 = Washing Machine
E. Association Rules Generation Using Correlation Analysis In general, FP-growth [3], [4] and Apriori [6] algorithms use support − conf idence frame-work to generate frequent patterns and extract association rules, while eliminating uninteresting rules by comparing support and conf idence with minsup and minconf respectively. The support and conf idence do not evaluate correlation of rule’s antecedent and consequent. This turn out to be less effective in eliminating uninteresting association rules. Additionally, the commonly used correlation measure Lif t affects from nulltransactions. Null-transaction, are transactions where itemsets under consideration are not part of it, and in a large database null-transactions can outbalance the support count for itemsets. Hence, this approach fails when contemplating low minimum support threshold or searching for extended patterns as explained by the study in [5]. This study suggests using null-invariant interestingness measures of Kulczynski measure (Kulc) along with Imbalance Ratio (IR) to supplement support − conf idence frame-work to extract more interesting rules. A correlation rule can be expressed as: X ⇒ Y [support, conf idence, correlation]
(3)
Kulczynski Measure (Kulc) [5]: Kulc of X and Y , is an average of conf idence measures for X and Y ; which, by definition of conf idence can be translated into average of conditional probabilities. Kulc measure is null-invariant and it is defined as: 1 (4) Kulc(X, Y ) = (P (X|Y ) + P (Y |X)) 2 If Kulc = 0, then X is negatively correlated Y i.e. occurrence of X indicates absence Y or vice-versa. If the Kulc = 1, then
2016 IEEE Electrical Power and Energy Conference (EPEC)
X and Y are positively correlated i.e. occurrence X indicates presence Y or vice-versa, whereas Kulc = 0.5 indicates X and Y are independent having no correlation. Imbalance Ratio (IR) [5]: IR measures the imbalance of antecedent and consequent of the rule. It is defined as, IR(X, Y ) =
|sX − sY | sX + sY − s(X∪Y )
(5)
Where IR = 0 and IR = 1 represent perfectly balanced and very skewed scenario respectively. Imbalance ratio is null-invariant and is not influenced by database size. Association Rule Generation: It is an effortless process to extract association rules from frequent itemsets discovered from transactions in a database DB. Association rules can be derived, as explained in algorithm (3), where we introduce the use of correlation measures of Kulc to extend the Apriori [6] approach in order to filter out uninteresting association rules along with measure of imbalance ratio IR to explain it. Algorithm 3 Apriori Association Rule Generation Require: frequent patterns discovered database, F P DB, minimum support minsup, minimum confidence minconf , minimum Kulczynski Measure minkulc Ensure: Association Rules 1: for all Frequent itemset F Pi in F P DB do 2: Generate all subsets subsetF Pi having subsetF Pi 6= ∅ 3: for all Subset in subsetF Pi do 4: Output rule ”subsetF Pi ⇒ (F Pi −subsetF Pi )”, having Kulc >= minkulc, support ≥ minsup, and conf idence ≥ minconf 5: end for 6: end for
TABLE III A PPLIANCE A SSOCIATION RULES Sr. 1 2 3
Association Rule Support Confidence Monitor ⇒ Laptop 0.50 0.99 Laptop ⇒ Monitor 0.50 0.93 Monitor, Speakers ⇒ 0.34 1.00 Laptop 4 Laptop, Speakers ⇒ 0.34 0.93 Monitor 5 Monitor, Washing 0.22 0.98 Machine ⇒ Laptop 6 Laptop, Washing 0.22 0.91 Machine ⇒ Monitor 7 Monitor, Speakers, 0.16 1.00 Washing Machine ⇒ Laptop 8 Laptop, Speakers, 0.16 0.91 Washing Machine ⇒ Monitor Kulc ≥ 0.60, minsup ≥ 0.10, minconf ≥ 0.90
Kulc 0.96 0.96 0.81
IR 0.06 0.06 0.38
0.80
0.27
0.70
0.58
0.68
0.50
0.65
0.69
0.62
0.62
TABLE IV A PPLIANCE U SAGE P RIORITY Sr. Appliance 1. Washing Machine 2. Laptop 3. Monitor 4. Speakers 5. Laptop 2 6. Running Machine 7. Kettle minsup ≥ 0.05
Relative Support (%) 62.74 53.84 50.34 48.83 15.43 09.61 06.13
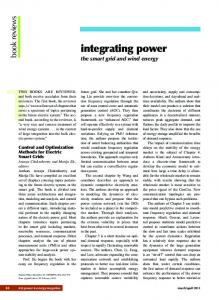
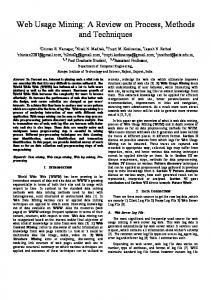
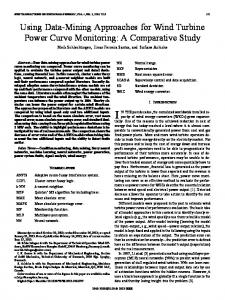
to examine intermediate and final results. The outcome of the evaluation comprehensively supports our hypothesis of undeviating influence of human behavior over energy consumption patterns at a household learned from appliance associations. Due to space constraint we present final results from one house. Figure (2) presents snapshot of frequent pattern visualization with minsup ≥ 0.2, where tree structure exhibits associative relationship among appliances with respective support. Further, table (III) represents inter-appliance association rules with related interestingness measures; and table (IV) demonstrates the frequency of single appliance usage, which can be interpreted as priority of usage of an appliance over others. With reference to the appliance association rules, rules 1 and 2 are balanced and other rules exhibit moderately skewed cases (as explained by corresponding IR). We observed that four appliances Washing Machine, Laptop, Monitor and Speakers exhibit strong association rules and priority usage as shown in table (III), figure (2), and table (IV). Further, energy consumption curves snap-shots in figures (3), (4), (5) and (6) compliments the results of frequent patterns and association rules discovery. It can be noted that the energy consumption patterns of different appliances exhibit close similarities, which is expected. Thus, we can infer that these appliances were in-fact used simultaneously as shown by our data mining outcomes. Additionally, from the frequent patterns and association rules we can notice occupants’ behavioral traits. For example, Laptop is used along with Washing Machine i.e. occupant likes to work on computer while washing cloths even listens to music. Also, from appliance usage priority table, Washing Machine is listed as the highest used appliance in the home. From a demand side management scheduling perspective, this appliance should be considered first in any energy saving plan, but the user preferences should be accounted to minimize any inconveniences to the user’s day-to-day lifestyle. V. C ONCLUSION AND F UTURE W ORK
IV. E VALUATION R ESULTS We carried out exhaustive incremental data mining on the energy consumption data from 5 houses of UK-Dale [7]
In this paper, we demonstrated that the appliance associations are direct reflection of occupant energy usage behavior while revealing personal preferences depicting expected comfort. These must be indispensable input parameters to energy saving programs and related decision making processes, at each level that is household to system, to ensure improved consumer participation and achieve success in laid out goals of smart grids environment. In our future work, we will
2016 IEEE Electrical Power and Energy Conference (EPEC)
500
900
450
800
400
700
Power Consumption (Watts)
Power Consmuption (Watts)
Fig. 2. Inter-Appliance Associations extracted through frequent pattern mining with minsup ≥ 0.2
350 300 250 200 150 100
500 400 300 200 100
50 0 2013-07-20
600
2013-07-30
2013-08-09
2013-08-19
2013-08-29
0 2013-07-20
2013-07-30
2013-08-09
2013-08-19
2013-08-29
Period (Dates)
Period (Dates)
Fig. 6. Energy consumption: Washing Machine
Fig. 3. Energy consumption: Laptop 1200
Power Consumption (Watts)
1000 800 600 400 200 0 2013-07-20
2013-07-30
2013-08-09
2013-08-19
2013-08-29
Period (Dates)
Fig. 4. Energy consumption: Monitor 300
Power Consumption (Watts)
250 200 150 100 50 0 2013-07-20
2013-07-30
2013-08-09
2013-08-19
2013-08-29
Period (Dates)
Fig. 5. Energy consumption: Speakers
extend our analysis of energy consumption behavior to include prediction of multiple appliances usage to forecast energy consumption on a short-term and long term basis. R EFERENCES [1] T. Yu, N. Chawla, S. Simoff, Computational Intelligent Data Analysis for Sustainable Development, Chapman and Hall/ CRC, Chapter 7, 2013
[2] D. Schweizer, M. Zehnder, H. Wache, H. F. Witschel, Using consumer behavior data to reduce energy consumption in smart homes, 2015 IEEE 14th International Conference on Machine Learning and Applications (ICMLA), Miami, FL, USA, pp 1123 - 1129 London, UK: IEEE, 2015. [3] J. Han, M. Kamber, J. Pei, Mining Frequent Patterns without Candidate Generation, In: Proc. Conf. on the Management of Data (SIGMOD00, Dallas, TX), pp 1 - 12. NY, USA : ACM Press, 2000. [4] J. Han, M. Kamber, J. Pei, Mining Frequent Patterns without Candidate Generation: A Frequent-Pattern Tree Approach, Data Mining and Knowledge Discovery, 8, pp 53 - 87, 2004. Netherlands : Kluwer Academic Publishers, 2004. [5] J. Han, M. Kamber, J. Pei, Data Mining: Concepts and Techniques, (Third Edition), Chapter 6, pp 243 - 278. San Francisco, USA: Morgan Kaufmann Publishers (Elsevier), 2012. [6] R. Agrawal, R. Srikant, Fast Algorithms for Mining Association Rules, In Proceedings of the 20th International Conference on Very Large Data Bases (VLDB94), Santiago, Chile. San Francisco, USA: Morgan Kaufmann Publishers (Elsevier), 1994. [7] J. Kelly, W. Knottenbelt, The UK-DALE dataset, domestic appliancelevel electricity demand and whole-house demand from five UK homes., Sci. Data 2:150007 doi: 10.1038/sdata.2015.7. London, UK: Scientific Data, 2015. [8] M. Hassani, C. Beecks, , D. Tws, T. Seidl, Mining Sequential Patterns of Event Streams in a Smart Home Application, Proceedings of the LWA 2015 Workshops: KDML, FGWM, IR, and FGDB. Trier, Germany, Trier, Germany: http://ceur-ws.org, 2015. [9] Y. Chen, H. Hung, B. Chiang, S. Peng, P. Chen, Incrementally Mining Usage Correlations among Appliances in Smart Homes, 2015 18th International Conference on Network-Based Information Systems Taipei, Taiwan, pp 273 - 279 : IEEE, 2015. [10] S. Rollins, N. Banerjee, Using Rule Mining to Understand Appliance Energy Consumption Patterns, 2014 IEEE International Conference on Pervasive Computing and Communications (PerCom), Budapest, Hungry, pp 29 - 37 : IEEE, 2014. [11] S.Rollins, N. Banerjee, Data Mining Techniques for Detecting Household Characteristics Based on Smart Meter Data, Energies 2015, 8(7), 7407 - 7427; doi:10.3390/en8077407 Basel, Switzerland : Energies, MDPI, 2015.