Washington, D.C.: Interstate Technology & Regulatory Council, Incremental. Sampling ... Jennifer Corack§, Navy and Marine Corps Public Health Center ...... been sprayed only along the edges or in garden pockets of a residential yard. ...... Figure A-16 Post plot for Scenario M3-A representing a shooting range with a central.
Technical and Regulatory Guidance
Incremental Sampling Methodology
February 2012
Prepared by The Interstate Technology & Regulatory Council Incremental Sampling Methodology Team
ABOUT ITRC The Interstate Technology and Regulatory Council (ITRC) is a public-private coalition working to reduce barriers to the use of innovative environmental technologies and approaches so that compliance costs are reduced and cleanup efficacy is maximized. ITRC produces documents and training that broaden and deepen technical knowledge and expedite quality regulatory decision making while protecting human health and the environment. With private- and public-sector members from all 50 states and the District of Columbia, ITRC truly provides a national perspective. More information on ITRC is available at www.itrcweb.org. ITRC is a program of the Environmental Research Institute of the States (ERIS), a 501(c)(3) organization incorporated in the District of Columbia and managed by the Environmental Council of the States (ECOS). ECOS is the national, nonprofit, nonpartisan association representing the state and territorial environmental commissioners. Its mission is to serve as a champion for states; to provide a clearinghouse of information for state environmental commissioners; to promote coordination in environmental management; and to articulate state positions on environmental issues to Congress, federal agencies, and the public. DISCLAIMER This material was prepared as an account of work sponsored by an agency of the United States Government. Neither the United States Government nor any agency thereof, nor any of their employees, makes any warranty, express or implied, or assumes any legal liability or responsibility for the accuracy, completeness, or usefulness of any information, apparatus, product, or process disclosed, or represents that its use would not infringe privately owned rights. Reference herein to any specific commercial product, process, or service by trade name, trademark, manufacturer, or otherwise does not necessarily constitute or imply its endorsement, recommendation, or favoring by the United States Government or any agency thereof. The views and opinions of authors expressed herein do not necessarily state or reflect those of the United States Government or any agency thereof and no official endorsement should be inferred. The information provided in documents, training curricula, and other print or electronic materials created by the Interstate Technology and Regulatory Council (ITRC) (“ITRC Products”) is intended as a general reference to help regulators and others develop a consistent approach to their evaluation, regulatory approval, and deployment of environmental technologies. The information in ITRC Products was formulated to be reliable and accurate. However, the information is provided "as is" and use of this information is at the users’ own risk. ITRC Products do not necessarily address all applicable health and safety risks and precautions with respect to particular materials, conditions, or procedures in specific applications of any technology. Consequently, ITRC recommends consulting applicable standards, laws, regulations, suppliers of materials, and material safety data sheets for information concerning safety and health risks and precautions and compliance with then-applicable laws and regulations. ITRC, ERIS and ECOS shall not be liable in the event of any conflict between information in ITRC Products and such laws, regulations, and/or other ordinances. ITRC Product content may be revised or withdrawn at any time without prior notice. ITRC, ERIS, and ECOS make no representations or warranties, express or implied, with respect to information in its Products and specifically disclaim all warranties to the fullest extent permitted by law (including, but not limited to, merchantability or fitness for a particular purpose). ITRC, ERIS, and ECOS will not accept liability for damages of any kind that result from acting upon or using this information. ITRC, ERIS, and ECOS do not endorse or recommend the use of specific technology or technology provider through ITRC Products. Reference to technologies, products, or services offered by other parties does not constitute a guarantee by ITRC, ERIS, and ECOS of the quality or value of those technologies, products, or services. Information in ITRC Products is for general reference only; it should not be construed as definitive guidance for any specific site and is not a substitute for consultation with qualified professional advisors.
ISM-1
Incremental Sampling Methodology
February 2012
Prepared by The Interstate Technology & Regulatory Council Incremental Sampling Methodology Team
Copyright 2012 Interstate Technology & Regulatory Council 50 F Street NW, Suite 350, Washington, DC 20001
Permission is granted to refer to or quote from this publication with the customary acknowledgment of the source. The suggested citation for this document is as follows: ITRC (Interstate Technology & Regulatory Council). 2012. Incremental Sampling Methodology. ISM-1. Washington, D.C.: Interstate Technology & Regulatory Council, Incremental Sampling Methodology Team. www.itrcweb.org.
ACKNOWLEDGEMENTS The members of the ITRC Incremental Sampling Methodology (ISM) Team wish to acknowledge the individuals, organizations, and agencies that contributed to this technical and regulatory guidance. As part of the broader ITRC effort, the ISM Team’s effort is funded primarily by the U.S. Department of Energy. Additional funding and support have been provided by the U.S. Department of Defense and the U.S. Environmental Protection Agency. While all team members listed below contributed to the team’s efforts, the co-leaders (Ligia Mora-Applegate and Mark Malinowski) recognize the team members identified with the symbols *, †, §, or Δ as deserving special recognition as follows: * † § Δ
notable writing contributions leadership role during document production multiyear member of the team Internet-based training instructor
The ISM Team co-leaders recognize the efforts of the following individuals: • • • • • • • • • • • • • • • • • • • •
Diane Anderson§Δ, Agriculture & Priority Pollutants Laboratory, Inc. Matthew Baltusis§, Michigan Department of Environmental Quality-RD-Superfund Alfonso Benavides, Texas A&M University Nancy Bettinger*, Massachusetts Department of Environmental Protection Kelly Black*§Δ, Neptune and Company, Inc. Robin Boyd*§Δ, AECOM Environment Roger Brewer*§, Hawaii Department of Health Mark Bruce*§†Δ, TestAmerica, Inc. Matt Butcher, ARCADIS Anna Butler§, U.S. Army Corps of Engineers (USACE) Frank Camera*§†Δ, New Jersey Department of Environmental Protection Janie Carrig§, USACE Omaha District-MM Design Center Michelle Caruso§, Tetra Tech, Inc. Michael Chacon, Pueblo de San Ildefonso Arnab Chakrabarti, Geosyntec Consultants Eric Cheng, USACE Jay Clausen§Δ, U.S. Army Cold Regions Research and Engineering Laboratory Jennifer Corack§, Navy and Marine Corps Public Health Center Ed Corl*§, NAVFAC Engineering Command Laboratory Quality and Accreditation Office Earl Crapps*§†Δ, Alaska Department of Environmental Conservation
i
•
• • • • • • • • • • • • • • • • • • • • • • • • • • • • • • • • • • • • • • • • • •
Deana Crumbling*§†Δ, U.S. Environmental Protection Agency (US EPA), Office of Superfund Remediation and Technology Innovation (OSRTI), Technology Innovation and Field Services Division Annette Dietz*§Δ, Oregon Department of Environmental Quality Jan Dunker*§ Δ, USACE John Esparza, USACE Timothy Fitzpatrick§, Florida Department of Environmental Protection (DEP) Tim Fredrick§Δ, USEPA Region 4 Jon Gabry*§, Tetra Tech, Inc. Rick Galloway*§†, Delaware Department of Natural Resources and Environmental Control Edward Gilbert§, US EPA OSRTI, Environmental Response Team John Gillette§, Air Force Center for Engineering and the Environment (AFCEE) Phillip Goodrum*§†Δ, Cardno ENTRIX Joe Guarnaccia, BASF Corporation Paul Hadley*§†Δ, California Department of Toxic Substances Control (DTSC) Jeanene Hanley§, Arizona Department of Environmental Quality (ADEQ) Bryan Harre§, Naval Facilities Engineering Service Center (NAVFAC ESC) John Hathaway*§, Pacific Northwest National Laboratory Marvin Heskett, TestAmerica, Inc. Keith Hoddinott§, U.S. Army Public Health Command Julie Hoskin§, ADEQ Paul Jurena§, Past Program Advisor, AFCEE Technical Directorate Guy Kaminski, ARCADIS Derek Kinder§, USACE Louisville District Environmental Engineering Branch Robert Kirgan§, U.S. Army Environmental Center (USAEC) Richard Lewis§, HSA Engineers & Scientists Peter Lorey§, USACE Pornteera Manakun, ERM Joseph McElhaney, ExxonMobil Kari Meier§, USACE—Environmental Engineering Anita Meyer*§, USACE Brian Nagy, TestAmerica, Inc. Neal Navarro§, USACE Osaguona Ogbebor§, CH2M HILL Dee O’Neill, Columbia Analytical Services Katherine Owens*§, Eastern Idaho Community Action Partnership Jeffery Patterson*§†, Texas Commission on Environmental Quality Mike Pfister§, California DTSC Hugh Rieck§, USACE Stephen Roberts*§†, University of Florida Randall Ryti§, Neptune and Company, Inc. Christopher Saranko§, Environmental Planning Specialists, Inc. Angela Sederquist, Program Advisor, Booz Allen Hamilton Kathleen Siebenmann, USACE George Shaw§, W.L . Gore & Associates, Inc.
ii
• • • • • • • • • • •
Lizanne Simmons, Kleinfelder, Inc. Anita Singh*§, Lockheed Martin Patricia L. Smith, Alpha Stat Consulting Michael Stroh*§† Δ, Missouri Department of Natural Resources Leah Stuchal*§, University of Florida Brandon Swope§, SPAWAR Systems Center Pacific William Sy§, US EPA Region 2, Superfund Quality Assurance (QA) Keith Tolson*§, Geosyntec Consultants Deborah Walker§, U.S. Army Engineering and Support Center Barry Weand, Past Program Advisor, Team Integrated Engineering Gary Zimmerman§, Golder Associates
All parties who contributed to this document whether named or unnamed, be they team member, independent reviewer, or ITRC staff, are thanked by the ISM Team for their effort. Some made major contributions to the project while others made minor ones; all are appreciated for their time and effort.
iii
DEDICATION This document is dedicated to our friend and colleague Alan D. Hewitt whose contributions to environmental science will endure far beyond his time. We admired him for his intellect and enthusiasm and are grateful for the knowledge and energy he brought to this team.
iv
EXECUTIVE SUMMARY Incremental sampling methodology (ISM) is a structured composite sampling and processing protocol that reduces data variability and provides a reasonably unbiased estimate of mean contaminant concentrations in a volume of soil targeted for sampling. ISM provides representative samples of specific soil volumes defined as decision units (DUs) by collecting numerous increments of soil (typically 30–100 increments) that are combined, processed, and subsampled according to specific protocols. ISM is increasingly being used in the environmental field for sampling contaminants in soil. Proponents have found that the sampling density afforded by collecting many increments, together with the disciplined processing and subsampling of the combined increments, in most cases yields more consistent and reproducible results than those obtained by more traditional (i.e., discrete) sampling approaches. In 2009 the ITRC established a technical team to evaluate ISM for sampling soils at hazardous waste sites and potentially contaminated properties. The ISM Team convened national experts in fields such as toxicology, risk assessment, statistics, and soil sampling. Key efforts of the ISM Team included performing a statistical analysis of ISM performance, identifying considerations for unique laboratory processes and procedures, evaluating the suitability of ISM to various contamination scenarios and contaminant categories, and identifying the strengths and weaknesses of ISM. A key feature of the ISM Team’s effort was emphasizing the need to integrate systematic planning for any soil sampling approach. As with any sampling approach, ISM requires the integration of quantitative soil sampling objectives with the conceptual site model. Other topics of interest to the ISM Team included the theoretical underpinnings of ISM, the planning and sampling design process for implementing ISM, and potential regulatory challenges to use of ISM (particularly the requirements for calculating upper confidence limits specified in some regulatory jurisdictions). The processes and equipment described here are the best available at the time this document was written. As technology advances and new equipment, instrumentation, and processes are developed, they may be included in future ISM implementations provided they meet the data and measurement quality objectives for the site to be characterized. Overall, members of the ISM Team have found that ISM provides reliable, reproducible sampling results and leads to better, more defensible decisions than have typically been achieved with many traditional sampling approaches. Such improvements result from the inherent attributes of ISM and the details of its implementation, including a clearer connection between sampling objectives and sampling approach. ISM works to address and overcome the sampling errors associated with soil sampling, integrates attention to detail in planning and field work, and requires attention to quality assurance/quality control measures throughout the sampling effort and not just in the laboratory. ISM also affords an economy of effort and resources. Generally, it
v
would take dozens of discrete samples from any particular area to approach the reliability in an estimate of the mean provided by a well-designed incremental sampling approach. As a result of the advantages and improvements inherent in ISM over traditional methods, ISM is finding increased use in the field, as well as acceptance and endorsement by an increasing number of state and federal regulatory organizations.
vi
TABLE OF CONTENTS ACKNOWLEDGEMENTS ............................................................................................................. i DEDICATION ............................................................................................................................... iv EXECUTIVE SUMMARY .............................................................................................................v 1. INTRODUCTION .....................................................................................................................1 1.1 1.2 1.3 1.4 1.6 1.7 1.8
Summary of ISM as an Environmental Sampling Approach............................................1 Traditional Investigation Approach Limitations...............................................................3 How ISM Addresses Traditional Investigation Approach Limitations ............................4 How ISM Compares to Compositing ................................................................................5 Frequently Asked Questions .............................................................................................7 Document Organization ....................................................................................................9 Key Terms .......................................................................................................................10
2. NATURE OF SOIL SAMPLING AND INCREMENTAL SAMPLING PRINCIPLES ........10 2.1 2.2 2.3 2.4 2.5 2.6
Introduction .....................................................................................................................10 Soil Heterogeneity and Variation in Contaminant Concentrations ................................12 Foundational Concepts of Sampling ...............................................................................17 Scale-Specific Sampling Considerations ........................................................................20 Gy Theory and the Source of Sampling Error ................................................................23 Three Sampling Approaches ...........................................................................................29
3. SYSTEMATIC PLANNING AND DECISION UNIT DESIGNATION ...............................37 3.1 3.2 3.3 3.4 3.5
Overview of Systematic Planning...................................................................................37 Nature and Intent of Decision Units and Sampling Units ..............................................46 Decision Units.................................................................................................................48 Establishing New Decision Units Based on Previous Results ........................................62 Hot Spots.........................................................................................................................63
4. STATISTICAL SAMPLING DESIGNS FOR ISM ................................................................64 4.1 4.2 4.3 4.4
Factors that Complicate Estimating the Mean Concentration ........................................67 Uncertainty in Estimates of the Decision Unit Mean .....................................................70 Evaluating the Performance of Sampling Approaches ...................................................76 Areas for Further Study ..................................................................................................87
5. FIELD IMPLEMENTATION, SAMPLE COLLECTION, AND PROCESSING..................95 5.1 5.2 5.3 5.4
Introduction .....................................................................................................................95 Sampling Tools ...............................................................................................................97 Field Collection...............................................................................................................99 Field Handling of ISM Samples ...................................................................................113
6. LABORATORY SAMPLE PROCESSING AND ANALYSIS ............................................121 6.1
Introduction ...................................................................................................................121
vii
6.2 Laboratory Processing ..................................................................................................123 6.3 Laboratory Analysis ......................................................................................................138 6.4 Quality Assurance/Quality Control ..............................................................................141 7. MAKING DECISIONS USING ISM DATA ........................................................................147 7.1 7.2 7.3
Introduction ...................................................................................................................147 Decision Mechanisms ...................................................................................................149 Assessment of Error ......................................................................................................157
8. REGULATORY CONCERNS WITH ISM ...........................................................................160 8.1 8.2 8.3 8.4 8.5 8.6
Introduction ...................................................................................................................160 Perception Issues...........................................................................................................161 Regulatory Challenges for ISM ....................................................................................161 State of Knowledge, Experience, and Training ............................................................163 Implementation Issues ..................................................................................................169 Summary .......................................................................................................................181
9. CASE STUDY SUMMARIES ..............................................................................................183 9.1 9.2 9.3 9.4
Case Study 1. PCB-Contaminated Landfill ..................................................................183 Case Study 2. Petroleum-Contaminated Soil Stockpile................................................185 Case Study 3. Former Golf Course Field Demonstration of ISM.................................186 Case Study 4. Hawaiian Homelands Development ......................................................186
10. STAKEHOLDER AND TRIBAL INPUT .............................................................................187 11. REFERENCES ......................................................................................................................189
LIST OF TABLES Table 1-1. Table 2-1. Table 2-2. Table 3-1. Table 4-1. Table 4-2. Table 4-3. Table 4-4. Table 4-5. Table 5-1. Table 6-1. Table 8-1. Table 8-2.
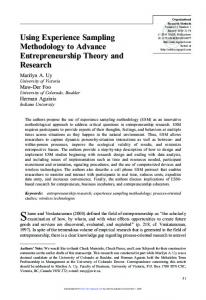
Crosswalk for frequently asked questions on ISM ........................................................7 Relationship between particle size and lead concentration for a firing range site.......15 Summary of sampling errors described by Gy and control measures .........................28 Considerations to address during systematic planning for ISM sampling...................43 Data dispersion in terms of CV and GSD ....................................................................68 Example of UCL simulations.......................................................................................77 Summary of scenarios investigated with simulations ..................................................82 Likelihood that ISM achieves coverage depending on dispersion ..............................84 Summary statistics used to combine DUs ....................................................................89 Estimated sample mass for set increment length and substrate density ....................103 Potential for loss during the air-drying step ..............................................................129 List of states with specific restrictions on compositing.................................................................... 164 Limitations, solutions, and section references for using ISM....................................177 LIST OF FIGURES
Figure 1-1. ISM flowchart .............................................................................................................2 viii
Figure 1-2. Figure 1-3. Figure 2-1. Figure 2-2. Figure 2-3. Figure 2-4.
Sampling designs ........................................................................................................6 Key ISM process terms .............................................................................................10 Heterogeneous nature of contaminants in soils may lead to decision errors ............12 Grain sizes ranging from 0.016 mm to 2 mm ...........................................................14 Electron microscope photograph of the structure of smectite clay particles ............14 Illustration of smectite clay plates and interstitial cation binding with dibenzo-p-dioxin .......................................................................................................15 Figure 2-5. A single square foot area of surface soil contains 36 possible 2-inch-diameter core sample locations ................................................................................................16 Figure 2-6. Observed short-scale heterogeneity with colocated uranium sample results ...........17 Figure 2-7. Process of extrapolating analytical sample results to soil concentrations ................18 Figure 2-8. Variability among results of laboratory subsample duplicates measures within-sample heterogeneity .....................................................................................21 Figure 2-9. Smaller analytical masses contribute to high data variability ..................................23 Figure 2-10. Illustration of the effects of sample mass on representativeness of the population .................................................................................................................24 Figure 2-11. Depiction of grouping and segregation of particles ..................................................25 Figure 2-12. Illustration of the effects of sampling device design on particle sizes in a sample .......................................................................................................................26 Figure 2-13. Vertical view of a sampling device that minimizes EE ............................................27 Figure 2-14. Increment DE and EE from sampling device selection ............................................27 Figure 2-15. Examples of distributions generated by plotting concentration data vs. frequency (i.e., probability) of observation ..............................................................32 Figure 3-1. Pictorial CSM ...........................................................................................................40 Figure 3-2. Decision units and sampling units ............................................................................47 Figure 3-3. Examples of potential exposure area DUs ................................................................50 Figure 3-4. Exposure area DUs designated for a residential house lot........................................53 Figure 3-5. Source area DU in a suspected release area ..............................................................55 Figure 3-6. Designation of perimeter DUs around a source area DU .........................................55 Figure 3-7. One-meter vertical resolution DUs selected to help isolate heavily contaminated soil from less-contaminated soil and assist in evaluation of remedial alternatives .................................................................................................58 Figure 3-8. A hypothetical investigation of series of stacked source area DUs using borings ......................................................................................................................59 Figure 3-9. An example of a subsurface DU for contaminated soil overlain by clean soil that is not accessible by excavation ..........................................................................60 Figure 3-10. Example of stockpile DUs ........................................................................................61 Figure 3-11. Floor and two sidewall DUs for an excavation site ..................................................62 Figure 4-1. ISM decision tree ......................................................................................................66 Figure 4-2. Examples of the probability and magnitude of underestimation of the mean from a single ISM sample .........................................................................................71 Figure 4-3. Dispersion of means from ISM applied to a lognormal distribution with CVs ranging 0.5–3.0 .........................................................................................................72 Figure 4-4. Histogram of calculated Chebyshev UCL values using 5000 trials of a lognormal distribution (mean = 100, SD = 200), 30 increments, and 3 replicates ...................................................................................................................78
ix
Figure 4-5. Range of overestimation and underestimation of 95% UCLs using Chebyshev and Student’s-t calculation methods for ISM simulations with lognormal distributions, 30 increments and 2–7 replicates ........................................................79 Figure 4-6. Four possible relationships between bias and precision ...........................................80 Figure 4-7. Systematic random sampling/systematic grid sampling with a random start (Serpentine) ...............................................................................................................85 Figure 4-8. Random sampling within grids .................................................................................85 Figure 4-9. Simple random sampling within the entire DU ........................................................85 Figure 5-1. Field sampling implementation flowchart ................................................................96 Figure 5-2a. Examples of coring devices for nonvolatile soil increment collection .....................98 Figure 5-2b. Example of a drill core bit sampling tool for nonvolatile soil increment collection ...................................................................................................................99 Figure 5-3. Estimated sample mass based on number of increments for set increment and substrate density ......................................................................................................102 Figure 5-4. Example DUs from industrial, residential, and agricultural sites ...........................104 Figure 5-5. Illustrations of systematic random incremental sampling pattern used for collecting samples in circular and square areas ..............................................105–106 Figure 5-6. Schematic of a procedure to collect an ISM profile sample where two depths have been selected ..................................................................................................107 Figure 5-7. Example of removing a wedge from the entire length of a soil core ......................108 Figure 5-8. Examples of “core slice” sample ............................................................................109 Figure 5-9. Examples of rectangular and flat-bottom sampling tools .......................................114 Figure 5-10. Example of subsample being collected in the field ................................................114 Figure 5-11. Bottles containing methanol and 44 five-gram plugs of soil ..................................116 Figure 5-12. Examples of coring devices for VOC soil increment collection ............................116 Figure 5-13. Example of sample increments being collected and added to a bottle containing methanol for preserving VOC samples .................................................118 Figure 5-14. Example of methanol aliquots from individual 5 g field-preserved increments being combined in the laboratory ...........................................................................119 Figure 6-1. Sample processing and analysis flow chart ....................................................125–126 Figure 6-2. Example of wet-sieving soil on an as-received basis .............................................135 Figure 6-3. Example of 2-D Japanese slabcake incremental subsampling on dried and sieved soil ...............................................................................................................138 Figure 6-4. Example of 2-D Japanese slabcake incremental subsampling on moist sieved, “as-received” soil ....................................................................................................139 Figure 7-1. Dot plot comparison of background (reference area) and site ISM results ............155 Figure 8-1. Distribution of survey respondents (n = 263). ........................................................162 Figure 8-2. Survey response of ISM sampling in land use type by program ............................165 Figure 8-3. Survey responses identifying the objectives of ISM sampling ...............................166 Figure 8-4. Survey responses of the ISM media applications ...................................................166 Figure 8-5. Survey responses of states where the organization has participated in ISM ..........167 Figure 8-6. Survey responses of ISM sampling participation per land use type .......................167 Figure 8-7. Survey responses for the statement “ISM is ineffective because it cannot identify specific areas of high concentration” ........................................................168
x
Figure 8-8. Survey responses for the statement “incremental sampling cannot be used for risk assessment because it does not address variability” ........................................169 Figure 8-9. Survey responses for the statement “contaminant concentration depends on the amount of soil sample .......................................................................................169 Figure 8-10. Survey responses for the statement “ISM is generally more expensive than conventional discrete sampling” .............................................................................169 Figure 8-11. Survey responses for the statement “Incremental samples commonly require additional laboratory sample preparation” ..............................................................170 A PPE NDI C E S Appendix A. Appendix B. Appendix C. Appendix D. Appendix E. Appendix F. Appendix G.
Statistical Simulation Survey Results Case Studies ISM Team Contacts Glossary Acronyms Hyperlinks
NOTE: “Hyperlinks” This guidance was developed as Web-based document. The blocks of information presented online as “Hyperlinks” are included in Appendix G.
xi
INCREMENTAL SAMPLING METHODOLOGY 1.
INTRODUCTION
Incremental sampling methodology (ISM) is a structured composite sampling and processing protocol having specific elements designed to reduce data variability and increase sample representativeness for a specified volume of soil under investigation. Variability in measured contaminant concentrations between discrete soil samples is due primarily to the particulate nature of soil and heterogeneity in the distribution of contaminants. The elements of ISM that control data variability are incorporated into (a) the field collection of soil samples and (b) laboratory processing and The elements of ISM that subsampling procedures. ISM is designed to obtain a single control data variability are aliquot for analysis that has all constituents in the same incorporated into (a) the field of soil samples and proportion as an explicitly defined volume of soil. Properly collection (b) laboratory processing and executed, the methodology provides reasonably unbiased, subsampling procedures. reproducible estimates of the mean concentration of analytes in the specified volume of soil. In 2009, the ITRC convened the ISM Team to prepare this guidance document, which focuses on soil sampling. ISM addresses all the sources of sampling error in a systematic fashion (Gy 1998, Smith 2006). Other approaches to soil sampling have not emphasized reducing sampling error as much as ISM. Because this methodology requires change from traditional approaches, the ISM Team found it necessary to go into detail about the theory as well as the application of incremental sampling. The team found this to be a valuable exercise and it should be valuable to the reader as well. Because a good deal of new terminology is introduced by ISM, the reader is directed to the glossary in Appendix E. Section 1.8 also illustrates some key terms used in this document. The ISM Team recommends that, as with any well-conceived sampling approach or plan, all members of the investigation project team (e.g., consultants, regulators, geologist, analytical chemists, risk assessors and toxicologists) be involved in the entire ISM development process. 1.1
Summary of ISM as an Environmental Sampling Approach
Like all sampling approaches, ISM should be applied within a systematic planning framework. Figure 1-1 shows a general ISM flow process. One of the first steps in such a framework is to have the investigation project team establish a working conceptual site model (CSM). Once the CSM has been agreed to, the project team defines the data quality objectives (DQOs) and determines the appropriate decision unit (DU) size(s) and location(s). DUs are based on projectspecific needs and site-specific DQOs; both considerations specify and constrain the appropriate end use of the data. The size of a DU is site-specific and represents the smallest volume of soil about which a decision is to be made (USEPA 1999, Ramsey and Hewitt 2005, HDOH 2008a, ADEC 2009). In some cases a DU comprise smaller units known as sampling units (SUs), as discussed in Section 3. The requirement to explicitly and appropriately define the DU that each incremental sample represents is a key component of ISM and is discussed in detail in Section 3.
IRTC – Incremental Sampling Methodology
February 2012
* The statistical performance of the 95% UCL calculation depends on the properties of the data set and the sampling design. Note that ProUCL or FLUCL does not currently include the statistical algorithms for handling ISM data (see Section 4.0 and Appendix A). ** See Section 7.
Figure 1-1. ISM flowchart. ISM planning includes the development of an ISM protocol for the number of increments and replicates to be collected for each ISM sample. An incremental sample is created by collecting many (usually 30–100) equal-volume increments in an unbiased manner from throughout the
2
IRTC – Incremental Sampling Methodology
February 2012
entire DU. The combined increments (frequently totaling a kilogram or more) are typically processed at the laboratory and subsampled to provide an analytical aliquot of only a few grams that is used for analysis. The final analytical aliquot is the target sample. ISM is designed to provide an unbiased, statistically valid ISM addresses major sources of estimate of the mean value of an analyte within the DU. sampling error and increasing Through adequate spatial coverage of the DU as well as sample representativeness. disciplined handling, processing, and subsampling of the single sample formed from the increments collected, ISM works to overcome major sources of error in both sampling and subsampling of soils that have often been apparent with current sampling practices. By design, ISM provides complete spatial coverage within the DU; however, ISM does not provide information on the spatial distribution of contaminants within the DU. Should this spatial variability be important to the decisions being made, a smaller DU should be used. ISM may not be appropriate in certain situations (see Section 8 for further information on the limitations on ISM). 1.2
Traditional Investigation Approach Limitations
Soil sampling is typically done to characterize a site. Historically, the majority of soil samples collected has been discrete samples. Collection of discrete samples is sometimes preferred or mandated by regulatory agencies (see Section 8). Over the years, consultants, environmental scientists, and regulators have become aware of a number of recurring challenges, problems, and deficiencies associated with collecting soil samples as discrete, composite, or any other sampling method, including the following: •
Lack of clear environmental objectives at the initiation of the investigation—Often the primary objective is to “find contamination” with little clarity as to how the data will be used to determine whether identified contamination poses unacceptable risks to human health and the environment and often leading to lengthy delays in completion of project and expenditure of funds available for site investigation before adequate characterization is completed.
•
Poor spatial coverage of areas targeted for investigation and inadequate sample density—Generally, a minimum of 20–30 discrete samples is needed for an adequate characterization of a targeted area and volume of soil; however, only a small number (e.g., 9.53 18.85 10 0.20 Between 3/8 inch and 4-mesh 9.53–4.76 4.53 50 0.24 Between 4- and 10-mesh 4.76–2.00 3.65 108 0.43 Between 10- and 50-mesh 2.00–0.297 11.25 165 2.00 Between 50- and 200-mesh 0.297–0.074 27.8 836 25.06 Less than 200-mesh