Dec 23, 2016 - Measurement of the size of g1, g2 and g3 and the scale bar is done with a ruler. b. The values are then .... REIMER, Ludwig. Transmission ...
Karen Louise de Sousa Pesse
Supervision: Vitaliy Bliznuk
23-12-2016
TEM Practicum Exercise – indexing selected area electron diffraction pattern (#5)
1 Introduction Historically, Transmission Electron Microscopes were developed mainly due to the limited image resolution of light microscopes, which are restricted to the visible light wavelengths. Today, the TE microscopes are undoubtedly the most efficient way of characterizing a material, especially for its electron diffraction measure ment which can provide information on the crystal structure, lattice repeat distance and specimen shape, among other things.
The TEM forms the images in two different modes: o Imaging Mode o Diffraction Mode or Selected Area Diffraction
1.1 Electron Diffraction Modes The selected area electron diffraction (SAED) is a crystallographic experimental technique carried by the TEM in which the user can select an area of the specimen in which the diffraction pattern is desired. The selected area aperture – a thin strip of metal with different sized holes that blocks the beam - can be inserted below the sample holder and into the beam path.
For thin crystalline samples, a diffraction pattern can be an image of a pattern of dots in the case of a single crystal or a serie s of rings in the case of a polycrystalline material. Tor the single crystal, the diffraction pattern is dependent on the orientation of the specimen and the structure of the sample being illuminated by the electron beam.
The goal of this exercise is to index the images formed by the diffraction mode. Using the SAED pattern, one will measure the length of the reciprocal lattice vector g and the angle between observed reflections. Afterwards, d will be calculated to find the corresponding (h,k,l) values. Finally, the crystal zone axis is determined.
Karen Louise de Sousa Pesse
1
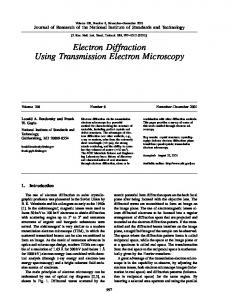
2 Indexing a Selected Area Electron Diffraction Pattern SAEDP h3, k3, l3 h1, k1, l1
g1
g3 h2, k2, l2
φ1 φ2
g2
Figure 1: Selected area electron diffraction pattern (SAEDP) taken from aluminum alloy.
i.
In order to analyse a SAEDP, firstly a parallelogram with the smallest g 1 , g 2 and g 3 is chosen on the spot electron diffraction pattern. a. Measurement of the size of g 1 , g 2 and g 3 and the scale bar is done with a ruler. b. The values are then compared with the actual size on the scale bar . c. The length |g i | in nm - 1 is determined using the scale bar ratio on the diffraction pattern; -1
Table 1: gi was calculated from the relation of scale bar on a ration 6cm 15 nm .
ii.
Index i
⃗⃗⃗⃗⃗⃗⃗⃗ 𝒈𝒉𝒌𝒍 𝒏𝒎−𝟏
⃗⃗⃗⃗⃗⃗⃗⃗ 𝒈𝒉𝒌𝒍 𝐜𝐦
1
4.25
1.7
2
5.00
2.0
3
4.25
1.7
Afterwards, the inter planar distance d i is determined by the equation 𝑑𝑖 =
1 𝑔 ⃗⃗⃗⃗⃗⃗⃗⃗ ℎ𝑘𝑙
Karen Louise de Sousa Pesse
2
These values are then compared with the given table in the exercise: Table 2: Determination of inter planar distances, d values, family planes and planes.
Index i
⃗⃗⃗⃗⃗⃗⃗⃗ 𝒈ℎ𝑘𝑙 𝒏𝒎−𝟏
d hkl nm
Family plane
Plane
{hkl}
(hkl)
1
4.26
0.234
{111}
(111)
2
4.26
0.234
{111}
(1̅1̅1)
3
4.92
0.203
{002}
(002)
In order to find the plane (hkl), the following formula shall be applied: ℎ1 + ℎ2 = ℎ3 𝑘1 + 𝑘2 = 𝑘3 𝑙1 + 𝑙2 = 𝑙3 Thus in {hkl}{111}, {111} and {002} we have: 1−1= 0 1−1= 0 3
1+1= 2 And the plane will then be the column of numbers with the appropriate signal chosen . iii.
In order to measure the angles, there are two possibilities: a. The family planes are inserted in the formula
b. Draw an angle (using the protractor template)
Figure 2: Angle masurement with protractor template.
Karen Louise de Sousa Pesse
The values obtained were the following:
1 = cos−1 2 = cos−1
(ℎ1 ℎ3 +𝑘1 𝑘3 +𝑙1 𝑙3 ) √(ℎ12 +𝑘12 +𝑙12 )(ℎ32 +𝑘32 +𝑙32 )
= cos −1
(0+0+2)
(ℎ2 ℎ3 + 𝑘2 𝑘3 + 𝑙2 𝑙3 ) √(ℎ22 + 𝑘22 + 𝑙22 )(ℎ32 + 𝑘32 + 𝑙32 )
√12
= 54.7°
= cos−1
(0 + 0 + 2) √12
= 54.7°
Table 3: Interplanar angles for cubic system
𝝋𝟏
𝝋𝟐
Measurement
52°
56°
Calculation
54.7°
54.7°
The values correspond to each other and can be considered satisfactory. On the second task, one must determine the crystal zone axis for the indexed diffraction spots (i.e. crystal planes in a real space). This can be obtained with the following formula:
4 < 𝑢𝑣𝑤 > = {111}𝑥{002} = 𝑖 𝑗 𝑘 𝑖𝑗 [1 1 1] 11 = 2𝑖 − 2𝑗 + 0𝑘 = < 22̅0 > 0 0 2 00 General Family of Directions If we calculate the direction parallel to the electron beam specifically for one set of planes: < 𝑢𝑣𝑤 > = (1̅1̅1)𝑥(002) = 2̅20 𝑖 𝑗 𝑘 𝑖𝑗 [1̅ 1̅ 1] 1̅1̅ = −2𝑖 + 2𝑗 + 0𝑘 = 2̅20 = 1̅10 0 0 2 00
Figure 3: The electron beam is parallel to the zone axis direction. Source: Google
This is a particular solution for particular indices of planes, thus brackets should be square. The zone axis is a direction in the crystal which is parallel to the electron beam . Thus this axis is 1̅10. Indices must be reduced to least numbers.
Karen Louise de Sousa Pesse
3 References WILLIAMS, David B.; CARTER, C. Barry. The transmission electron microscope. In: Transmission electron microscopy. Springer Us, 1996. p. 3-17. REIMER, Ludwig. Transmission electron microscopy: physics of image formation and microanalysis. Springer, 2013. P 393
5
Karen Louise de Sousa Pesse