The current issue and full text archive of this journal is available at www.emeraldinsight.com/1469-1930.htm
Indicators: on visualizing, classifying and dramatizing
Indicators
Bino Catasu´s School of Business, Stockholm University, Stockholm, Sweden, and
187
Jan-Erik Gro¨jer Department of Business Studies, Uppsala University, Uppsala, Sweden Abstract Purpose – This study aims to follow the development of human intellectual capital indicators over a six-year period and to bring forward the production, transmission and reception of indicators in order to interpret the ambitions and technological and programmatic properties that characterize the development of the indicators. The case builds around an organization that collects human resource data from various organizations and redistributes indicators for benchmarking purposes. Design/methodology/approach – The paper is based on a case, complemented with a survey. The design of the study is labeled as a case story, since it does not emphasize the organization itself, but rather the empirical material is analyzed to illustrate the production, transmission and reception of human capital measurements. The study thus follows the evolution of indicators in an organization specializing in human intellectual capital indicators. Findings – The main conclusion of the study is that indicators may legitimize, serve as a heuristic tool for learning or mobilize the organization. The paper also suggests that human intellectual capital indicators may be produced, transmitted and received differently in relation to their technological and programmatic logics. Research limitations/implications – The study suggests that there is a need to develop a theory of indicators. Originality/value – By emphasizing that not all that gets measured gets managed the paper’s classification makes it possible to understand how indicators may contribute to the organization in different ways. Keywords Measuring instruments, Intellectual capital, Human capital, Classification Paper type Case study
The age of measurability – indicating the world William Thompson (Lord Kelvin), the inventor of the voltmeter and other practical measuring instruments, stated, “If you cannot measure and cannot express corresponding numbers you will have knowledge of a meager and unsatisfactory kind.” Today, Lord Kelvin would be pleased by the numerous measurements being used in this age of measurability. In fact, a specific set of measurements has won terrain on a societal level. These measurements – here labeled indicators - aim to present more than just the numbers per se. On a societal level, we find many indicators, including Big Mac Index, Consumer Price Index, Dow Jones Index, $/e-ratio, GDP/person, Human Development Index and Pregnancy Rate per 1,000 Women. Indicators, then, help us to create an image of the state of the world as well as the state of the organization. Moreover, indicators play an important role in how we construct knowledge of an ample and satisfactory kind. In the MTV world of fast clips and trailers we tend to lean on indicators rather than the full-length narrative.
Journal of Intellectual Capital Vol. 7 No. 2, 2006 pp. 187-203 q Emerald Group Publishing Limited 1469-1930 DOI 10.1108/14691930610661854
JIC 7,2
188
In an organizational setting the use of indicators is not only restricted to financial indicators such as “return of investment”, “gross margin” and “EBITDA” but also to almost every aspect of organizational life. The efforts to include non-financial, intangible, or other aspects to the palette of possible indicators have increased significantly over the past several decades. However, there are different underpinning ideas of how and why these indicators are produced: . The balanced scorecard (BSC) project (Kaplan and Norton, 1992, 1996a) emphasizes the development of an indicator system that denotes a causal relationship between the indicators. BSC is a managerial tool that promises strategy in a bottle (Kaplan and Norton, 1996b, p. 77). . The intellectual capital (IC) model, represented by the efforts of the insurance company Skandia (e.g. Edvinsson and Sullivan, 1996; Edvinsson, 1997; Nilsson and Olve, 2001; Peppard and Rylander, 2001), prefers a checklist approach to explain the market value of an organization. Paradoxically, the main argument to produce non-financial indicators is in fact an indicator; it is the market-to-book-ratio that is brought forward to emphasize the importance of an increased volume of measurements. . The Danish Intellectual Capital Reporting (DICR) project (Mouritsen, 1998; Ministry of Science Technology and Innovation, 2002) uses the indicators as reference points for the knowledge narrative of the value creation process. The indicators are designed to provide the users of the statement information about how intellectual resources create future value. In the DICR project indicators are produced to communicate the knowledge-based strategy externally and the production itself serves as an internal management tool (Mouritsen et al., 2001, 2004). . In an effort to produce guidelines for measuring and reporting intangibles the MERITUM group suggests an indicator system that has a financial reporting approach with indicators representing activities and resources for the organization (MERITUM, 2001). . Others (e.g. in the total quality management tradition) see the production of indicators as residuals from a specific “view of the world”. Different approaches to the production of indicators ascertain how the indicators create the organizational world. Consequently, indicators do not play the same role in the different traditions of measuring intellectual capital. Although there are different outlines for the production of indicators, there seems to be general agreement that indicators are numerical information that have been selected for their perceived ability to give information beyond the number per se. Rather, the disagreement evolves around whether an indicator is a representation or a construction of the phenomenon in question (Mouck, 2004). Writing about sustainable development, Hart (1997) describes an indicator as something that helps you to understand where you are and the way you are going and how far you are from where you want to be. Some oppose such a laissez-faire view of the construction of indicators. Schaltegger et al. (1996) conclude that the four desired qualitative characteristics of financial indicators apply to sustainability performance indicators. That is, that they need to be understandable, relevant, reliable and comparable. The idea that indicators are part of
a realistic ontology and the sustainability issue meshes with the political and scientific parts of sustainable development. Or as Spangenberg (2002, p. 105) characterizes an indicator: “[Indicators should be] truly representative of the phenomenon they are intended to characterize.” The realistic view is, in addition to being frequent in the sustainability debate, a dominate force in the intellectual capital discourse (see, e.g. MERITUM, 2001; Low, 2003; Grasenick and Low, 2004). This position suggests that a measurement corresponds to the underlying economic reality that it purports to represent (Shapiro, 1997). Conversely, a constructionist view suggests that a measurement (or any numeral) constructs the organization and directs attention to what is measured (see, e.g. Hines, 1988). The measurement acts as a developing bath of the organization, where it relies on agreement rather than on correspondence. The different ontological claims do not, however, depart from the idea that an indicator springs from management’s intention to get the organization and its stakeholders to attend actively to its strategy. In fact, both sides of the debate direct their attention to the production of the indicator. The consequence is that the fate of the indicator, i.e. the transmission and reception of the number are left behind. To make understandable the role of indicators in the organization we need to open the black box of the measurement and study both the ideology behind the production of the measurements and the transmission and reception (Thompson, 1981; Thompson, 1990) of the indicators. When framing certain measurements in an indicator setting, the implicit idea has been that the numbers would lead to managing. This only makes sense if management goes beyond measurement; in other case, it is an axiom. For our purpose, then, we see management as the active involvement in the production process (Fama and Jensen, 1983) and separated from the process of measuring. Management does not reside inherently in the indicators: all that is managed is not necessarily measured. Management literature has taught us that management involves such things as commands (Anthony, 1965), cultures (Hofstede and Neuijen, 1990), norms (Brunsson and Olsen, 1993) and “management-by-walking-around” (Roueche et al., 1989). However, not all that is measured is transformed into indicators. One reason is by pure definition. Here, the term measuring denotes the result of a process of scaling and collecting data for a given phenomenon. Indicators, however, are a selected set of measurements. The selection process itself is a part of the transmission. Transmission also includes the means by which the number is transported to the receiver and in what context the indicator is embedded, i.e. how and where the indicator is presented. The reception of the indicators has long been overlooked and the relationship between measurement and action has been seen as rather unproblematic. Perhaps the firmest statement of the relationship between measurement and management can be found in the organizational adages, “what gets measured gets managed” (Kaplan and Norton, 1996a, p. 2), “what you measure is what you get” (Kaplan and Norton, 1992, p. 71) and “if you can’t measure it – you can’t manage it” (Ford and Heaton, 2001, p. 44; Roberts and Bea, 2001, p. 74). These adages point towards not only a strong correlation between measuring and managing but also to a causal relationship. If valid, measurements have a strong possibility to affect management. Still, in this age of measurability not everything that is measured is acted upon. It seems that some measurements have a greater effect than others. For managers, the different ideological platforms (production sense), the selection of indicators (transmission) and the possible fate of the indicator (reception) need to be considered to achieve an efficient
Indicators
189
JIC 7,2
management control system (MCS) for the intangible arena. This study aims to contribute both to the understanding of the production of measurements and to the transmission and reception of indicators.
190
Design of the study The paper is based on a case, complemented with a survey. Here, the design of the study is labeled as a case story. By aligning to the research tradition of accounting in action (Lukka, 1998; Jo¨nsson, 1999), this paper follows a case of production, transmission and reception of indicators. The case story is characterized by being a mixture of facts and experiences and with a thematic time flow (van der Blonk, 2003); however, our case story differs from a traditional case study by not emphasizing the context. The empirical material is analyzed to illustrate the production, transmission and reception of human capital measurements. To be clear, the paper uses the concept of human intellectual capital in order to favor the view of human resources as an essential input in the value creation process. This is also in line with the views of the organization that acts as a case for this paper. The case story builds on the efforts made by the Swedish organization Skandinaviska Nyckeltalsinstitutet (The Scandinavian Key Ratio Institute, SNI). SNI’s main mission is to “help organizations to become more efficient by improving the description, management control and analysis of the key resource: personnel” (available at: www.nyckeltalsinstitutet.se/merom.html (accessed Monday, 1 November 2004)). Such a mission fits well in the Scandinavian tradition of putting the personnel at the center of attention (Ax and Bjørnenak, 2000) and measuring and reporting on human capitals (Gro¨jer and Johanson, 1991; Johanson and Nilson, 1996; Ahonen, 1998). The business model of SNI is based upon collecting human intellectual capital measurements and redistributes human capital indicators to the subscribers. SNI has been active since 1996 and has had between 50 and 130 organizations per year participating in this process. The number of indicators distributed has varied between 40 and 50. The authors have played a major part in the development processes at SNI. The methodology relates to the action research tradition (discussed by, e.g. Gummesson (1991). Further, twice a year the authors have attended seminars discussing the indicators with SNI’s subscribers. This interaction has increased our possibilities to understand how the subscribers perceive and use the indicators. Still, the authors have not been involved in the actions (or non-actions) inside the organizations. The case story includes the activities of SNI during the period 1996-2003. Although the seven-year period gives the study a longitudinal perspective, we prefer not to emphasize the time aspects as any contingent factor in this paper. Rather, the paper discerns the material into different modes of transmission and reception of human intellectual capital indicators. The paper attends to the question of how the reception and transmission changes as new ambitions of indicators surface. The empirical corpus makes it possible to highlight the interplay between the production, transmission and reception of indicators. Furthermore, there is something to learn about indicators from the plain fact that SNI has survived on a competitive market with mainly one product, namely to redistribute indicators.
Visualizing human resources – ambition to legitimize As the first ambition, SNI set out to develop indicators that would make human capital visible to the organization. As far as the human resource (HR) department was concerned, the organization paid too little attention to their personnel. From SNI’s point of view, the solutions were built on the idea to mimic financial indicators by supplying common definitions of human capital indicators. The variation of human capital indicators was remarkable. In fact, there was a wide variety of definitions for “the same” indicator even between departments inside the same organization, making any kind of comparison almost impossible. As a response, SNI offered potential subscribers to send in data (e.g. number of employees, total recruitments, total salary costs and number of days in training) and to, in return, get indicators using preset definitions (e.g. of staff turnover and employee cost per hour). To summarize, SNI offered standardization of a non-standardized measurement. The indicators were presented with benchmarks to other organizations. SNI offered an empirical context by giving the subscribers information about the other subscribers’ numerical values. The emphasis was on visualizing through a commonality, which creates an arena of possible benchmarking activities as well as establishing a legitimacy for the HR department vis-a`-vis the other departments. The transmission of the indicators was set in a relative manner and the presentation answered the following question: How much is our personnel trained in comparison with other organizations? SNI aimed at playing the role of a third party that could, without the weary of office politics, offer standardization and comparison of the human intellectual capital indicators. SNI did not present the indicators as standardized success factors (as suggested by, among others, Grasenick and Low, 2004, pp. 271-274), but rather supplied a limited number of commonly defined and benchmarked indicators. For SNI, the idea was that the palette of definitions had the possibility of creating the amount of legitimacy craved by the HR-department. By acting as an “independent” institute, the SNI provided possible impartial indicators and thus would give the numbers the credibility and the legitimacy that were sought for by the HR department. This is consistent with Suchman’s (1995, p. 580) notion of procedural legitimacy: “organizations also can garner moral legitimacy by embracing socially accepted techniques and procedures.” In the SNI case the initial logic was that if something is visualized for the first time from an organizational point of view, it gets special attention. Attention, according to Simons (1995, p. 16), “refers to the allocation of information processing capacity within the organization to a defined issue or agenda.” By systematically visualizing the human capital issue, it becomes worthwhile to consider it as a bullet point on the organizational agenda. However, there are issues and phenomena in the organization that are measured but do not affect management of the production process. In fact, measuring may distance management at some point from operations (Johnson, 1992) and thus act as a hindrance. A great number of indicators tend to make the business logic ambiguous. The subscribers noted this and more indicators seemed, paradoxically, to lead to the demand of even more indicators and not to management. In 1999, it became clear that SNI’s ambition to visualize the human capital in legitimate and comparable indicators did not reach the aim of creating attention to the human resource issue. SNI had argued that by offering the benchmarking argument as a mode of transmission and with the ambition to supply legitimate measures, the human capital issue would win terrain within the organization. However, some of the
Indicators
191
JIC 7,2
192
subscribers started to question the usefulness of the human capital indicators. As far as the subscribers were concerned, the indicators did not mobilize attention and create action to the extent expected. Not only was there difficulty in measuring and reporting several of the indicators, but there was also the general question concerning the problem of “what are we measuring?” Classifying the indicators – ambition to learn During the seminars with the HR managers, some stated that they needed something that kept the “scattered indicators together”. In the visualizing ambition the indicators were a participating unit without any relationship to each other apart from being a part of a crowd. Preferably, the indictors ought to be linked in a cause-effect relation “to prove the usefulness of the human resource management function”, as one of the HR managers put it. As a response to this assertion, SNI presented a generic model with the ambition of ordering the crowd of indicators. What SNI offered was a model for accomplishing reality rather than discovering it, i.e. a model for sensemaking (Weick, 1979). Models linking one indicator to another, such as Kaplan and Norton’s (1996) BSC, are well-known in the Swedish organizational discourse. SNI took the inverse approach to that of the BSC by starting with the indicators and ending up with a business/sensemaking model. The SNI model suggests that every organization has a personnel structure (e.g. age, gender and educational level) that affects its results. To be able to manage the organization successfully it also needs to handle the competence supply, such as development, recruitment, mergers and networks. Finally, personnel relations, i.e. the relationship between the organization and personnel, are suggested to be important for obtaining good results. Examples of indicators relating to personnel relations are everything from wages per employee to sick leave. The second stage of the development of indicators, then, went on to make an order out of the defined indicators. The idea behind every classification is one of simplification to act as a heuristic device (Gro¨jer, 2001). The mobilizing capacity lies in the idea of simplification. The universe of possible measurements was delimited to the selected indicators and the classes of the SNI model. By classifying the indicators in different aspects of organizing, the SNI model suggests that there is in fact a relationship between the indicators and successful performance. Consequently, the SNI model is a proposed theory for the organization in general and for the HR-department in particular. The first efforts made by SNI to visualize human intellectual capital indicators did not have this grand narrative approach but was rather a tool for definitions of ingredients for a narrative. In this phase the indicators became embedded in a context and the transmission of the human intellectual capital indicators was entrenched in a pre-translated model. For SNI, the old goal was still prevailing and the generic model was advanced to amalgamate the performance of the organization with the state and use of human resources. What most differentiates the SNI from the BSC model is that the former only sets out to determine what causalities account for the management of human capital. The generic model presented by SNI detaches the HR-department from any overall strategy of the organization. The aim of the model is to work out the human resource situation. Nevertheless, SNI did not develop the generic model as a means to implement strategy. Rather, the intention of the model was to help the subscribers learn about the relationship between human intellectual capital and performance. As a result, the
model can be interpreted as a human intellectual capital reporting model in a causal form, i.e. as a learning model (for a discussion of causal forms, see Luft and Shields (2003)). The model could also be used to legitimize further the view, “personnel as the most important resource in the organization.” Although the generic model seemed to meet customer expectations as a learning tool and seemed to work in some organizations, other subscribers still demanded more. Apparently, the ordering of indicators attracted only limited attention outside the HR-department, with less mobilizing and acting than expected. Concerning the generic model, one human resource manger stated, “nothing happens in the organization.” The reports were stuck in a binder in the bookshelf. Accordingly, the reports were unable to mobilize the organization to attend to the human capital. There are several possible explanations for this failure. One is that the assumed causal form between the indicators could not be established in a practical, manageable way. Another is that there exists competition between business models present in the organization. A third explanation is that HR managers had the ambition to gain attention, resources and a sense of direction from the SNI model. For them, learning is too far away from action. Dramatizing the indicators – ambition to mobilize SNI now began developing yet another indicator that, from the very beginning, had the ambition to mobilize the organization. The idea was to piece together an indicator that did not involve more efforts from the organization (in order to avoid measurement weariness). At SNI, it had become apparent that the main ambition should be to offer indicators that create attention about the human capital issues. More specifically, the HR managers stated that the problem was that the indicators stayed within the HR department. Visualizing and ordering human intellectual capital indicators were – at least for some of the subscribers – insufficient to start communicating with the other departments. Consequently, SNI developed an indicator that had the reception of the indicator as the guiding star. In the year 2000, SNI launched a human intellectual capital index called the “working condition index” (WCI). Mobilization denotes bringing an organization from passiveness to activeness for a specific issue or phenomenon. Vaivio (2004) found dramatizing indicators, or what he calls “provocative non-financial measurements”. According to Vaivio (2004, p. 58) “. . .non-financial measurements are provocative because it extends the management’s visibility beyond economic aggregates into the minutiae of professional practices at the local level”. Furthermore, Vaivio (2004) notes, “. . . since non-financial measures cannot be objective measures of local performance, the measures were disputed.” Vaivio found the indicators to be provocative by their sheer presence. According to Vaivio, the framing of the phenomena was enough to ignite the organization, which differs from the SNI experience where visualization of human capital did not suffice. SNI’s development of the WCI was approached through the view of accounting as a social construction, a position that was taken at face value. From an ontological perspective, WCI was produced out of the idea that it is possible to construct a boundary to the organization, influencing what is and what is not of significance in discussing organizations and what perspectives accounting narratives have (Hines, 1991). Moreover, WCI is grounded on the assumption that knowledge is inherently social and what is known is the result of interaction between actors. Thus, by
Indicators
193
JIC 7,2
194
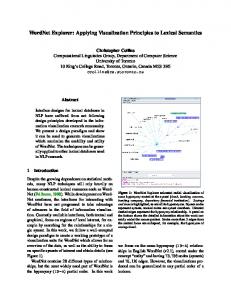
Table I. From measurements to WCI
introducing a new actor (i.e. the index) in the organizational discourse, it is possible to attain agreement and knowledge about the organization’s working conditions. The development of the WCI does not rest on any naı¨ve view of true and fair representation. Rather, the indicators are true when they are believed to be true (Latour, 1987; Baxter and Chua, 2003). The development of the WCI embraced the constructionist view of accounting and assigned the sole ambition of the WCI to mobilize the organization. The WCI consists of nine indicators already available in the subscribing organization. These indicators were merged into one single indicator (or rather an index). The ambition was to create one indicator that rests on a political process as opposed to ambitions of creating legitimacy or strategic interconnections. In the turn of the millennium working conditions were important political bullet points on the agenda in Sweden. The cost for sick leave was a hard burden on the state budget (and for organizations) and such issues as training, equality, job security and pay are always high on the list of important items in Sweden. Consequently, the market for an indicator relating to working conditions was good. The indicators that SNI chose and their corresponding label of working conditions are listed in Table I. Any one measurement cannot be a full expression of a complex working condition. As an illustration, it is reasonable that no person accepts the indicator “proportion female managers in relation to the proportion of females employed” as a true and fair representation of the working condition “equality between sexes”. From a SNI perspective, the success of WCI relied on the premise that the subscribers would agree that these proxies are acceptable as communicating the working conditions. In this respect, some of the indicators ran into more problems than others. To frame competence development SNI advocated “time for retraining in relation to total worked hours”. The heaviest criticism came, notably, from those subscribers working within the knowledge intensive firms. As far as they were concerned, competence development primarily came from working with clients and customers. It is also worthwhile to note that after having used the indicators to construct the working conditions, the users may view the indicators as a representation of the specific working condition, i.e. construction becomes representation. This is, according to Suzuki (2003), a consequence of education, Measurement
Working condition
Proportion permanently employed in relation to the total number of employed Labor cost per worked hour (Swedish kronor per hour) Proportion of female managers in relation to the proportion of females employed Time for retraining in relation to total worked hours Overtime in relation to total worked hours Sick-leave less than 15 days in relation to total worked hours Number of employees per manager with employee responsibility Sick-leave more than 14 days in relation to total worked hours Number of persons terminating employment in relation to number of permanently employed
Job security Work compensation Equality between sexes Competence development Workload Work environment Personnel responsibility Rehabilitation need Turbulence S
Working Condition Index
professionalism and publication of accounts. The use of the indicators increased the acceptance level of WCI as an expression of working conditions. With the ambition of creating one mobilizing indicator out of the nine previously accepted indicators, each one was valued on a 20-point scale with equidistant scale steps, except for the open-ended values for some of the measures. The maximum number of points, i.e. the best possible score, was 180 (9 £ 20) (see Appendix). The scaling was empirically based in the sense that the scale steps were constructed to create as big a variance as possible. SNI did not weigh any measurement more than any other measurement when the index was calculated. The major argument against weighing is lack of theory on how to weigh (Stro¨m, 2004). Further, a complex weighing process might draw attention to the weighing process itself and hence hinder mobilization. To increase the dramatizing effect SNI scaled the measurements based on an employee perspective (rather than a management perspective) on working conditions. As an example, the higher the wage compensation, the higher the WCI scores. The development was initiated, processed and presented without any involvement of SNI’s subscribers[1]. Organizational phenomena, such as the WCI, can be understood in many ways. SNI’s idea was to present a drama (Sko¨ldberg, 2001) based on the assumption that a certain “genre of accounts” increases the chances of mobilizing the organization. In a Swedish context the label of the indicator – the WCI – fits in nicely with the political and ethical discourse and where the idea of labeling as a means of mobilization is central (Czarniawska-Joerges, 1988; Catasu´s, 2001). Thus, the argument is that an organizational narrative does not have to be set in words. Rather, indicators can be viewed as the shortest (and maybe most pervasive) possible narrative. The WCI was constructed with the idea that numbers can create a mobilizing story, which aligns to the storytelling tradition described by Boje (1991, p. 8): “[S]tories are the blood vessels through which changes pulsate in the heart of organizational life”. The first two phases of the development of indicators had made it clear that there is a competitive market for stories and, in order to mobilize the organization, the WCI had to have some competitive edge. Consequently, a new approach of constructing an indicator was initiated, one by which the indicator should be established on the idea of dramatization. Drama is characterized as the interplay between decisions in which situations and characters develop over time. A drama appears as a succession of episodes with each episode having its specific climax but which also forms a broader narrative. To dramatize, in an indicator setting, is to frame a measurement that has its own dramatic features and that is part of a broader story of the company. The logic of reading the indicators can therefore not be “outside’’ the document but it has to be made as part of it (Mouritsen et al., 2001, p. 360). At SNI, four assumptions directed the development of the WCI: (1) The dramatization should be built on the idea of a perspective. The WCI expresses an ambition to direct attention toward working conditions from the employee’s standpoint rather than from a supposedly neutral managerial or an outspoken owner viewpoint. The reasons are threefold: First, the Swedish discourse on personnel points to a decrease of supply of qualified employees in the nearest future because of, among other things, increasing sickness numbers, changing patterns in immigration and early retirements (SCB, 2003). By addressing the working conditions from an employee perspective, i.e. from the thinning supply side, the WCI gains in drama. Second, the value roots of the
Indicators
195
JIC 7,2
196
WCI can be found in social and human resource accounting (Macintosh, 1989), which points back to a known but not fashionable discourse of “accounting from a different perspective”. Third, choosing an employee perspective changes the perspective to “it is about me” point-of-view. Recognition is an essential ingredient in any drama (Jose and Brewer, 1984). (2) The dramatization should be accepted as expressions of working conditions. The concept of working condition refers to numerous aspects of organizational life. The key to making the indicator trustworthy is that each indicator has to be accepted as having some representative quality. Moreover, the index consisting of a number of measurements needs to be recognized as a relevant expression of an organization’s working condition. To succeed with this strategy the WCI has to enroll allies of the index, persuading the organization to accept the WCI as a legitimate and useful expression of working conditions (Callon, 1986). The “obligatory points of passage” in the discourse of working conditions are concepts that include job security, work compensation and equality between sexes. From an employee perspective, SNI labeled the nine measurements with well-reputed allies of the working conditions of an organization. (3) Data for the dramatization should be easily obtainable, calculated and understood. The process of selecting measurements was confined to the measurements already in place. The argument was primarily related to the cost of retrieving information, though it is also related to the measuring of fatigue present in many organizations. Furthermore, the calculation of the index was made transparent in order to create attention to the index and not on the measurement per se. The idea underpinning the measurement of the WCI is that the data and the analysis should be an issue of drama and not primarily a technical issue. (4) The dramatization should be transmitted in a way that is understandable. The presentation of the WCI should make it easy to translate the result of the indicator into action. This last point was a key issue to the subscribers of SNI because the problem of interpreting the human intellectual capital indicators seemingly raised debates on how to decipher the number rather than lead to action. Thus, drawing on the old maxim that “more is better” the WCI was easily interpreted. Furthermore, by using a thermometer as a communicative device, the presentation aligned to the idea that dramatization needs a different frame than the traditional indicators. Reception in practice In a study on the reception of WCI, Berger and Bravemark (2003) examined how WCI related to mobilization. The authors designed a short questionnaire with questions relating to the WCI as a mobilizing indicator. The questionnaire was mailed to the contact persons of 52 organizations that, at that moment, were all the subscribers to the SNI. Because three of the organizations at the time of the investigation had not received a WCI score, they were excluded from the study. A total of 20 organizations returned the questionnaire, yielding a response rate of 41 per cent. The response rate was surprisingly low, despite that a reminder was sent out. Furthermore, it could be expected that the subscribing organizations should express interest in the results of the questionnaire. In an analysis of the method, Berger and Bravemark (2003) reported that the only systematic difference of the non-repliers was that more organizations from the
public sector (9 of 15 or 60 per cent) returned the questionnaire than from the private sector (11 of 34 or 32 per cent). A possible explanation to account for the low response rate is that the questionnaire was distributed at the end of November, which is a busy period for most organizations. The relative low response rate implies that the analysis of the results have to be considered as preliminary. A second main caveat is that the respondents may be more positive than other organizational members because of the commitment to the SNI service. Still, some of the results are both noteworthy and robust. Table II shows how the organizations have been informed about the WCI score in relation to the WCI score they received. Organizations with the lowest and highest WCI score informed the labor union and top and middle management to a greater extent than organizations with a score somewhere in the middle. A HR-manager gave witness to that effect as well. After receiving the second lowest score, he said, “It will be great to come home and show the management team these numbers. I wonder what they will say when they find out that we offer one of the worst working conditions.” Even if the WCI indicator in itself may be a dramatization, it seems necessary that the score also serves as an actor in the dramatization. Given that the response rate is low and that the survey was conducted after just one year with the WCI, it is not possible to draw any firm conclusions. Still, at least one observation can be made. There seems to be a possible third route to mobilization, namely that of dramatization. The dramatization through the naming of the indictor (“Working Condition Index”) may be enough to, ex ante, catch attention. However, ex post after the measuring, calculating and reporting processes it seems that the score has to carry some dramatic element. Conclusion The SNI project prompts us to propose some nuances of the understanding of indicators and the ambitions that indicators may have in legitimizing, learning and mobilizing the organization. In Rose and Miller’s (1992) terms, indicators are expressions of technological and programmatic properties. In our context, the programmatic property is the way an indicator is related to certain argumentation logic. The technological properties of indicators are the practical means by which the indicators are made alive and become capable (Rose and Miller, 1992, p. 183) (Table III). With the legitimizing ambition to indicators, the programmatic property is one of logic of comparison. This logic is that of becoming transparent and measuring up to other organizations, and consequently, creating modes of accountability, i.e. “giving and demanding reasons for conduct” (Roberts and Scapens, 1985, p. 447; Ahrens, 1996, p. 139). The legitimizing ambition can be compared with such grand projects as the French “Bilan Social” (Dierkes and Preston, 1977) and the Global Reporting Initiative (Bavaria, 1999). However, the same logic can also rule at the shopfloor. The measurements are, in relation to their technological properties, selected in accordance with other organizations. According to our case story, however, the mobilizing capacity of legitimate numbers rapidly diminishes after the first couple of presentations. With the ambition of learning, the idea is to reveal a business or production logic. It is a matter of formulating the production function by means of the indicators and a way of presenting how the causal relationships are constituted. The technological endeavor is to form any type of relations between the indicators (see, e.g. the BSC project). The classifications and models build up the context in which the indicators
Indicators
197
Table II. Information to different parties about the WCI scores 92 y
93 y y y
97 y y
Note: “y” denotes that information is given
88 y y y
99 y y y
101 y
101 y y y
106
111
115 y
115 y
116
y
119
120 y
126
126
126 y y y
198
WCI score Top management Management Labor union
129 y y y
y
129 y
141 y y y
JIC 7,2
make sense, and by ordering them in classes, there is a change in focus. The efforts of classifying and creating relations between the indicators help to create a theory of performance. The experience from the SNI story is that classifying is an analytical tool that seldom finds its way from the bookshelf to become an actor in getting the organization to move from passiveness to activeness. Finally, if the ambition is mobilizing, one option is to dramatize the indicator. Our findings are that the indicator should be able to express something new out of the old (i.e. keeping the legitimate numbers). This expression can benefit from being a part of a broader political agenda. Consequently, dramatizing is accepted if the indicators have strong ideological allies. In a technological sense, dramatizing is achieved through rewriting the organization’s story in line with the political logic. This was done in the SNI case through combining a set of indicators to a new re-named index. Nevertheless, all single indicators can be rewritten, for example, by just changing labels[2]. During the past several decades, we have witnessed several bold attempts to formulate models about the modern organization. Almost all of these models include a set of indicators. Yet, the construction of indicators is handled in a rash manner. The lessons learned from the SNI case story entails that the transmission and reception of the indicators are paramount to what ambition it can fulfill. In addition, the findings of this study suggests that without a theory of indicators that includes both the technological means of communication and an ambition to communicate with the receiver, the organizational models may become obsolete. Indicators can be treated beyond a production discourse and include the aesthetics and poetics that are part of any capable act of communication. The intellectual capital discourse, however, may lack the legitimacy to go beyond the dominating idea of objectivity. Typically, in a critical essay on “knowledge management”, McAdam and McCreedy (1999, p. 97) question the possibilities of intellectual capital measurements: “Unfortunately this approach can result in attempts to fit objective measures to subjective elements.” The legitimacy the intellectual capital discourse may gain does not come from its short history. Rather, it comes from the credibility of accounting. However, the fixation about a true and fair view seems to be the other side of the coin. In addition, most efforts to theorize on the role of indicators rest on the adage “what gets measured gets managed”. The rationale is that numbers will make homo economicus act. Such a causal relationship makes less sense today (Otley, 2003), which may perhaps be due to the increased numbers of measurements. Indicators have long been a mere residual emanating from organizing models. Therefore, we suggest a research agenda where indicators are at the focus and where both indicator systems and systems of indicators (compare Roberts and Scapens, 1985) are investigated. The first concept denotes the formal rules and resources in the practice of producing, transmitting and receiving indicators; the latter concept denotes how the system functions in practice. With respect to indicator systems, we have tried Ambition
Programmatic property
Technological property
Legitimizing Learning Mobilizing
Benchmarking logic Business model logic Political logic
Visualizing Classifying Dramatizing
Indicators
199
Table III. The properties of indicators
JIC 7,2
to initiate a discussion on a theory of indicators. This study has approached the systems of accounting by following the development of indicators and, by being both part of the process and researching what happened, adding to the understanding of the evolution of indicators. Still, in an organizational setting where indicators (both financial and non-financial) play an increasing importance more research is called for.
200
Notes 1. The participating organizations reported their data for the first time in early spring 2002. In April, each organization received a traditional report with 42 indicators, reported with information about the generic model plus the WCI, all with benchmarking data. The highest score among the participating organizations was 137 points and the lowest 88 (see Appendix). 2. An indicator like “absenteeism” can easily be transformed into one of “presence” or by amalgamating two different indicators into one of, e.g., sickness-presence. Compare Wittgenstein’s idea of language games; for an application in the accounting framework, see Hedlin (1996). References Ahonen, G. (1998), “Improving human resource disclosure and reporting”, in Ahonen, G. and Matilainen, R. (Eds), Politik, ha¨lsa och ekonomi. Ekonomi och samha¨lle, Svenska handelsho¨gskolan, Helsingfors, pp. 3-20. Ahrens, T. (1996), “Styles of accountability”, Accounting, Organizations and Society, Vol. 21 Nos 2-3, pp. 139-73. Anthony, R.N. (1965), Planning and Control Systems: A Framework for Analysis, Harvard Business School, Boston, MA. Berger, A.C. and Brevemark, E. (2003), “Arbets villkorindex – leder det till mobilisering i organisakioner?” (“Working condition index – does it led to mobilisation in organisations?”), Master’s thesis, Uppsala University, Uppsala. Ax, C. and Bjørnenak, T. (2000), “The bundling and diffusion of management accounting innovations – the case of the balanced scorecard in Scandinavia”, paper presented to the 23rd Annual Congress of European Accounting Association, Munich, 29-31 March. Bavaria, J. (1999), “Fiduciary obligation and the importance of an environmental accounting standard”, Corporate Environmental Strategy, Vol. 6 No. 1, pp. 46-54. Baxter, J. and Chua, W.F. (2003), “Alternative management accounting research – whence and whither?”, Accounting, Organizations and Society, Vol. 28 Nos 2-3, pp. 97-126. Boje, D.M. (1991), “Consulting and change in the storytelling organisation”, Journal of Organizational Change Management, Vol. 4 No. 3, p. 7. Brunsson, N. and Olsen, J.P. (1993), The Reforming Organization, Routledge, London. Callon, M. (1986), “Some elements of a sociology of translation: domestication of the Scallops of St Brieuc Bay, power, action and belief. A new sociology of knowledge?”, Sociological Review, Monograph No. 32, Routledge, London. ´ Catasus, B. (2001), Borders of Management: Five Studies of Accounting, Organizing and the Environment, Stockholm University, Stockholm. Czarniawska-Joerges, B. (1988), Att handla med ord om organisatoriskt prat, organisatorisk styrning och fo¨retagsledningskonsultering, Carlsson, Stockholm. Dierkes, M. and Preston, L.E. (1977), “Corporate social accounting reporting for the physical environment: a critical review and implementation proposal”, Accounting, Organizations and Society, Vol. 2 No. 1, pp. 3-22.
Edvinsson, L. (1997), “Developing intellectual capital at Skandia”, Long Range Planning, Vol. 30 No. 3, pp. 320-1. Edvinsson, L. and Sullivan, P. (1996), “Developing a model for managing intellectual capital”, European Management Journal, Vol. 14 No. 4, pp. 356-64. Fama, E.F. and Jensen, M.C. (1983), “Separation of ownership and control”, Journal of Law and Economics, Vol. XXVI, June, pp. 301-26. Ford, R.C. and Heaton, C.P. (2001), “Lessons from hospitality that can serve anyone”, Organizational Dynamics, Vol. 30 No. 1, pp. 30-47. Grasenick, K. and Low, J. (2004), “Shaken, not stirred: defining and connecting indicators for the measurement and valuation of intangibles”, Journal of Intellectual Capital, Vol. 5 No. 2, pp. 268-81. Gro¨jer, J.-E. (2001), “Intangibles and accounting classifications: in search of a classification strategy”, Accounting, Organizations and Society, Vol. 26 Nos 7-8, pp. 695-713. Gro¨jer, J.-E. and Johanson, U. (1991), Human Resource Costing and Accounting, Joint Industrial Safety Council, Stockholm. Gummesson, E. (1991), Qualitative Methods in Management Research, Sage, Newbury Park, CA. Hart, S.L. (1997), “Beyond greening: strategies for a sustainable world”, Harvard Business Review, Vol. 75, pp. 66-76. Hines, R.D. (1988), “Financial accounting: in communicating reality, we construct reality”, Accounting, Organizations and Society, Vol. 13 No. 3, pp. 251-61. Hines, R.D. (1991), “The FASB’s conceptual framework, financial accounting and the maintenance of the social world”, Accounting, Organizations and Society, Vol. 16 No. 4, pp. 313-31. Hofstede, G. and Neuijen, B. (1990), “Measuring organizational cultures: a qualitative and quantitative study across 20 cases”, Administrative Science Quarterly, Vol. 35 No. 2, pp. 286-316. Johanson, U. and Nilson, M. (1996), “The usefulness of human resource costing and accounting”, Journal of Human Resource Costing and Accounting, Vol. 1 No. 1, pp. 117-38. Johnson, H.T. (1992), Relevance Regained: From Top-down Control to Bottom-up Empowerment, Free Press, New York, NY. Jo¨nsson, S. (1999), Action Research in Management Accounting Studies, Gothenburg Research Institute, Gothenburg. Jose, P.E. and Brewer, W.F. (1984), “Development of story liking: character identification, suspense, and outcome resolution”, Developmental Psychology, Vol. 20 No. 5, pp. 911-24. Kaplan, R.S. and Norton, D.P. (1992), “The balanced scorecard – measures that drive performance”, Harvard Business Review, Vol. 70 No. 1, pp. 71-9. Kaplan, R.S. and Norton, D.P. (1996a), The Balanced Scorecard, Harvard Business School Press, Boston, MA. Kaplan, R.S. and Norton, D.P. (1996b), “Using the balanced scorecard as a strategic management system”, Harvard Business Review, Vol. 74 No. 2, pp. 75-85. Latour, B. (1987), Science in Action: How to Follow Scientists and Engineers through Society, Open University Press, Buckingham. Low, J. (2003), Invisible Advantage: How Intangibles Are Driving Business Performance, Perseus Publishing, Cambridge, MA. Luft, J. and Shields, M.D. (2003), “Mapping management accounting: graphics and guidelines for theory-consistent empirical research”, Accounting, Organizations and Society, Vol. 28 Nos 2-3, pp. 169-249.
Indicators
201
JIC 7,2
202
Lukka, K. (1998), “Total accounting in action: reflections on Sten Jonsson’s accounting for improvement”, Accounting, Organizations and Society, Vol. 23 No. 3, pp. 333-42. McAdam, R. and McCreedy, S. (1999), “A critical review of knowledge management models”, The Learning Organization, Vol. 6 No. 3, pp. 91-101. Macintosh, N. (1989), The Social Software of Accounting and Information Systems, John Wiley & Sons, Chichester. MERITUM (2001), Guidelines for Managing and Reporting on Intangibles (Intellectual Capital Report), MERITUM, Madrid. Ministry of Science Technology and Innovation (2002), Intellectual Capital Statements in Practice – Inspiration and Good Advice, Ministry of Science Technology and Innovation, Copenhagen. Mouck, T. (2004), “Institutional reality, financial reporting and the rules of the game”, Accounting, Organizations and Society, Vol. 29 Nos 5-6, pp. 525-41. Mouritsen, J. (1998), “Driving growth: economic value added versus intellectual capital”, Management Accounting Research, Vol. 9 No. 4, pp. 461-82. Mouritsen, J., Bukh, P.N. and Marr, B. (2004), “Reporting on intellectual capital: why, what and how?”, Measuring Business Excellence, Vol. 8 No. 1, pp. 46-54. Mouritsen, J., Larsen, H.T., Bukh, P.N. and Johansen, M.R. (2001), “Reading an intellectual capital statement: describing and prescribing knowledge management strategies”, Journal of Intellectual Capital, Vol. 2 No. 4, pp. 359-83. Nilsson, F. and Olve, N.-G. (2001), “Control systems in multibusiness companies: from performance management to strategic management”, European Management Journal, Vol. 19 No. 4, pp. 344-58. Otley, D. (2003), “Management control and performance management: whence and whither?”, The British Accounting Review, Vol. 35 No. 4, pp. 309-26. Peppard, J. and Rylander, A. (2001), “Using an intellectual capital perspective to design and implement a growth strategy: the case of APiON”, European Management Journal, Vol. 19 No. 5, pp. 510-25. Roberts, J. and Scapens, R. (1985), “Accounting systems and systems of accountability – understanding accounting practices in their organisational contexts”, Accounting, Organizations and Society, Vol. 10 No. 4, pp. 443-56. Roberts, K.H. and Bea, R. (2001), “Must accidents happen? Lessons from high-reliability organizations”, Academy of Management Executive, Vol. 15 No. 3, pp. 70-9. Rose, N. and Miller, P. (1992), “Political power beyond the state: problematics of government”, British Journal of Sociology, Vol. 43 No. 2, pp. 173-205. Roueche, J.E., Baker, G.A. and Rose, R.R. (1989), Shared Vision: Transformational Leadership in American Community Colleges, Community College Press, American Association of Community Colleges, Washington, DC. SCB (2003), Statistical Yearbook of Sweden, Elanders Novum AB, Stockholm. Schaltegger, S., Muller, K. and Hindrichsen, H. (1996), Corporate Environmental Accounting, Wiley, Chichester. Shapiro, B.P. (1997), “Objectivity, relativism, and truth in external financial reporting: what’s really at stake in the disputes?”, Accounting, Organizations and Society, Vol. 22 No. 2, pp. 165-85. Simons, R. (1995), Levers of Control: How Managers Use Innovative Control Systems to Drive Strategic Renewal, Harvard Business School Press, Boston, MA.
Sko¨ldberg, K. (2001), The Poetic Logic of Administration: Styles and Changes of Style in the Art of Organizing, Routledge, London. Spangenberg, J.H. (2002), “Institutional sustainability indicators: an analysis of the institutions in Agenda 21 and a draft set of indicators for monitoring their effectivity”, Sustainable Development, Vol. 10 No. 2, pp. 103-15. Stro¨m, N. (2004), “Initial public offerings disclosure strategy”, Accounting Association 27th Annual Congress, Prague. Suchman, M.C. (1995), “Managing legitimacy: strategic and institutional approaches”, Academy of Management Review, Vol. 20 No. 3, pp. 571-610. Suzuki, T. (2003), “The accounting figuration of business statistics as a foundation for the spread of economic ideas”, Accounting, Organizations and Society, Vol. 28 No. 1, pp. 65-95. Thompson, J.B. (1981), Critical Hermeneutics: A Study in the Thought of Paul Ricoeur and Ju¨rgen Habermas, Cambridge UP, Cambridge. Thompson, J.B. (1990), Ideology and Modern Culture: Critical Social Theory in the Era of Mass Communication, Polity Press, Cambridge. Vaivio, J. (2004), “Mobilizing local knowledge with ‘provocative’ non-financial measures”, European Accounting Review, Vol. 13 No. 1, pp. 39-71. van der Blonk, H. (2003), “Writing case studies in information systems research”, Journal of Information Technology, Vol. 18 No. 2, p. 45. Weick, K.E. (1979), The Social Psychology of Organizing, McGraw-Hill, New York, NY.
Indicators
203
Further reading Hedlin, P. (1996), Accounting Investigations, Stockholms Universitet, Stockholm. Porter, T.M. (1995), Trust in Numbers: The Pursuit of Objectivity in Science and Public Life, Princeton University Press, Princeton, NJ. Appendix Indicator value for organization (high) Job security (%) Work compensation (SEK/hour) Equality between sexes/genders Competence development (%) Workload (%) Work environment (%) Personnel responsibility (employed) Rehabilitation needy (%) Turbulence (%) Sum (points)
93.9 287 0.04 6.1 2.0 2.3 8.1 1.1 10.9
Score 17 6 20 13 16 16 16 18 15 137
Indicator value for organization (low) 100 226 0.20 4.7 6.9 4.3 16.9 9.9 29.7
Corresponding author Bino Catasu´s can be contacted at:
[email protected]
To purchase reprints of this article please e-mail:
[email protected] Or visit our web site for further details: www.emeraldinsight.com/reprints
Score 20 3 17 10 7 12 12 1 6 88
Table AI. Highest and lowest scores on the WCI