Author version, post-acceptance
1
Indirect land use change: review of existing models and strategies for mitigation Birka Wicke*1 Pita Verweij1, Hans van Meijl , Detlef P van Vuuren3 & Andre PC Faaij1 This study reviews the current status, uncertainties and shortcomings of existing models of land use change (LUC) and associated greenhouse gas emissions as a result of biofuel production. The study also identifies options for improving the models and conducting further analysis. Moreover, because the extent of indirect LUC related to biofuels largely depends on other land uses – particularly agriculture - , this study explores strategies for mitigating overall LUC and its effects. Despite recent improvements and refinements of the models, this review finds large uncertainties, primarily related to the underlying data and assumptions of the market equilibrium models. There is thus still considerable scope for further scientific improvements of the modeling efforts. In addition, analyzing how overall LUC and its effects can be minimized is an important topic for further research and can deliver more concrete input for developing proper policy strategies. Future studies should investigate the impact of sustainability criteria and the effects of strategies for mitigating LUC, such as increasing agricultural efficiency, optimizing bioenergy production chains, using currently unused residues and by-products, and producing feedstocks on degraded and marginal land. 1
Utrecht University, Copernicus Institute, Group Science, Technology & Society, Utrecht, Budapestlaan 6, 3584 CD Utrecht, The Netherlands Agricultural Economics Research Institute of Wageningen University & Research Centre (LEI-WUR), Alexanderveld 5, 2502 LS Den Haag, The Netherlands 3 Netherlands Environmental Assessment Agency (PBL), A Van Leeuwenhoeklaan 9, 3721 MA Bilthoven, The Netherlands 2
*Author for correspondence: Tel.: +31 30 253 7600; Fax: +31 30 253 7601; E-mail:
[email protected]
Bioenergy is considered an important option in making future global energy supply more sustainable [1]. However, the sustainability of bioenergy has been a subject of debate in recent years because of concerns related to the environmental, ecological and social impacts of its production. Many of these impacts are * related to land use change (LUC) induced by feedstock cultivation, such as deforestation and the associated loss of biodiversity, increased greenhouse gas (GHG) emissions, and competition with food production and elevated food prices. LUC can be direct or indirect. Direct LUC (DLUC) refers to situations in which land use is changed from any previous use to bioenergy feedstock production itself. Indirect LUC (ILUC) is the change in land use outside a feedstock’s production area that is induced by changing the use or production quantity of that feedstock [2]. ILUC can occur: • When a direct displacement of pastureland, cropland or crop use results in livestock or crops being produced elsewhere to continue to meet demand; • When the diversion of the crop to other uses triggers higher crop prices, which results in more land being taken into agricultural production elsewhere [2,3]. Both of these mechanisms are considered in the economic equilibrium models. In addition, other mechanisms such as infrastructure development in support of bioenergy production and human migration *
Key term: Land use change (LUC) is the conversion of one type of land use to another. This change often affects the land cover and carbon sequestration potential in biomass and soil.
into and out of an area in response to large-scale bioenergy production can also trigger ILUC. The possible negative effects of ILUC from bioenergy production appeared on the political agenda in 2008 after the publication of a scientific study by Searchinger et al. [3], who estimated that DLUC and ILUC (hereinafter referred to as LUC) induced by corn ethanol production could cause a doubling of GHG emissions compared with fossil fuels. (Similar to Searchinger and colleagues, many other studies group ILUC with DLUC, so that only total LUC is modeled. Therefore, in the reminder of this report, LUC is used to refer to direct and indirect LUC combined, while (I)LUC applies to both ILUC and LUC). Although other studies have reported lower LUC-related emissions for corn ethanol, the Searchinger et al. [3] study has shown that the impact of LUC-related emissions on the total GHG balance (and reduction potential) of biofuels compared with fossil fuels can be significant. DLUC and ILUC can therefore be decisive for whether a feedstock can be considered according to specific regulations or standards. Meanwhile, debate continues regarding the extent of ILUC as a result of the stimulation of bioenergy production and whether and how to include ILUC in a certification system or regulatory context [4–8]. The discussions mainly stem from the difficulties in monitoring ILUC and the large range of outcomes from models that determine the extent of ILUC [5,6,9–11], even after attempts to harmonize these models [12]. In view of the current discussions surrounding ILUC and its potential inclusion in a regulatory framework in
Please cite as: Wicke, Verweij, van Meijl, van Vuuren and Faaij. Indirect land use change: review of existing models and strategies for mitigation. Biofuels (2012) 3(1), 87-100.
Author version, post-acceptance
the European Union, the main objectives of the present study are to: • Provide an overview of the current status of (I)LUC modeling and the calculated GHG emissions; • Describe uncertainties and shortcomings of the existing modeling efforts; • Suggest possible improvements and further analysis work; and • Explore strategies for mitigating overall LUC and its effects. The final objective is addressed because the literature emphasized that ILUC of biofuels largely depends on agricultural crop production and livestock management, the developments in their efficiencies and the rate of deployment of (second-generation) biofuels. Therefore, any future approach for minimizing LUC of bioenergy production needs to integrate all land uses, particularly agriculture.
Current status of modeling LUC-related GHG emissions Existing methods for determining (I)LUC and the related GHG emissions can be divided into two main groups, † employing either market equilibrium models or allocation models (which loosely account for all nonmarket equilibrium models). Market equilibrium models are used to calculate the amount and approximate location (generally by world regions and type of land converted) of LUC as a result of a change in bioenergy demand (e.g. by a biofuels mandate). The impacts of LUC in terms of GHG emissions are then determined by applying data on historic LUC and carbon stock changes for this LUC. Carbon stock changes are determined by applying either biophysical data on carbon stock changes as a result of LUC [13–17] or biophysical models [18–20]. Two types of market equilibrium models are used, computable general equilibrium (CGE) models or partial equilibrium (PE) models [21]. PE models treat markets for a selected set of traded goods, e.g. agricultural or energy goods. On the other hand, CGE or economy-wide models provide a complete representation of national economies, including the generation of factor income and expenditures, which requires the explicit specification of factor markets for land, labor and capital. Typically, PE models include more explicit technology information than CGE models. Additionally, a distinction is made between dynamic and static †
Key term: Market equilibrium models attempt to capture the response (behavior) of economic agents to changes in prices (costs), and prices adjust so as to clear markets. The objective of these models is the determination of equilibrium prices and quantities on (interrelated) sets of markets caused by changes in policy, technology or other external factors.
2
equilibrium models. Dynamic models allow the analysis of lagged transmissions and adjustment processes over time. Alternatively, the comparative static approach studies the differences between equilibria resulting from different assumptions on exogenous data or policy variables. The time path between equilibria is ignored in comparative static models. To analyze the impact of biofuels, the functioning of the land market in an equilibrium model is particularly crucial. Until the recent increase in interest in LUC and associated GHG emissions, land was mostly treated exogenously in CGE models. Tyner et al. [15] use agroecological zones in combination with an exogenous land supply, following the methodology outlined in Lee et al. [22]. Van Meijl et al. [23] and Eickhout et al. [24] introduce a land supply curve to represent the process of land conversion and land abandonment endogenously. This approach allows for a more detailed representation of productivity in the CGE model. Allocation models loosely account for all other types of model that have been developed to investigate LUC(or, in some cases, only ILUC-)related emissions. These models generally allocate (I)LUC to feedstockconversion routes based on historical data on LUC and yields as well as assumptions on, for example, byproduct use and the resulting displacement of other products. Examples of allocation models are the deterministic model of Fritsche et al. [25] and the causal-descriptive model of Bauen et al. [26] as well as the assessments by Tipper et al. [2], Lywood [27], Nassar et al. [28], and Overmars et al. [29]. The main advantage of using market equilibrium models to determine LUC is that they capture the intersectoral and factor market linkages of the economy and thereby endogenously model land use intensification and LUC [24]. However, these models also have important disadvantages, mainly related to their complexity, uncertainties, resource intensity and the lack of transparency to non-modelers [30]. For instance, general equilibrium models need to include a large set of parameters that can often not be specifically estimated for biofuels and are therefore derived from other estimates. Nonmarket equilibrium models are more transparent and easier to implement than the market equilibrium models. However, the simplified methodology may lead to the loss of important details with respect to the complex market feedbacks and endogenous intensification [30]. Figure 1 provides an overview of LUC-related GHG emissions as determined by different studies. The figure indicates that large ranges in LUC-related GHG emissions are found within and across the different types of models and for the different feedstockconversion routes. Two feedstock-conversion routes have been studied in more detail than the others, that is, corn ethanol and sugarcane ethanol, and a lot of progress in developing and refining the analysis of these
Please cite as: Wicke, Verweij, van Meijl, van Vuuren and Faaij. Indirect land use change: review of existing models and strategies for mitigation. Biofuels (2012) 3(1), 87-100.
Author version, post-acceptance
crops has been made in the course of 2009, 2010 and 2011. With respect to corn ethanol production, the initial LUC effect of US corn ethanol was given as 104 g CO2-equivalent (CO2e ) per megajoule (MJ) (for reference purposes, the emission factor of gasoline is 92 g CO2e/MJ) [3]. However, the development and improvements of the Global Trade Analysis Project (GTAP) bioenergy model from Purdue University have resulted in a large reduction in the estimates of LUCrelated GHG emissions (first to 32 g CO2e/MJ used in ‡ California’s Low Carbon Fuel Standard [13] and more recently to 15 g CO2e/MJ [14,15]. If California’s Low Carbon Fuel Standard LUC emission factor of corn ethanol was to be adjusted accordingly, most corn ethanol production would be able to meet the required emission reduction percentage of 10% compared with fossil fuels by 2020 while this is not the case with the current factor of 32 g CO2e/MJ [13]. The main improvements in the modeling relate to increased spatial resolution, updates in the global economic database used in GTAP (from 2001 to 2006), including pastureland as an option for conversion to bioenergy production, treatment of animal feed co-products, crop yields (both for agricultural crops and bioenergy crops) on existing agricultural land and newly converted land, and the fraction of carbon that is stored for a longer period in wood products [15]. Several of these improvements are related to strategies for mitigating (I)LUC and its effects, such as the type of land being allowed to be converted to bioenergy feedstock production and increasing crop yields and help explain the reduction in LUC-related GHG emissions. Also AlRiffai et al. [16] and, most recently, Laborde [17] have found significantly lower values for corn ethanol than originally proposed. Laborde [17] indicates even lower LUC-related emissions than calculated from the GTAP model, namely 7 g CO2e/MJ. The model improvements and the changes in results emphasize how sensitive the market equilibrium models are to underlying assumptions and datasets (see also the description of uncertainties in Section 3). Also the LUC-induced GHG emissions of sugarcane ethanol have been revised. With more improved land use and LUC data, Al-Riffai et al. [16] and the US Environmental Protection Agency (EPA) [18] have found LUC-related emissions of sugarcane ethanol that are much lower than the early assessments (Figure 1). For example, in the assessment of ILUC for the Renewable § Fuel Standard 2 (RSF2) , EPA [18] includes the FAPRI‡
Key term: The Low Carbon Fuel Standard (LCFS) in California is the first standard to also include indirect LUC-related GHG emissions. The LUC-related emissions account for both direct and indirect LUC and are calculated for corn ethanol, sugarcane ethanol and soy biodiesel by the GTAP model. § Key term: The Renewable Fuel Standard 2 (RFS2) of the United States federal government is the first national regulation worldwide to include indirect LUC-related GHG emissions. Emissions are calculated for ethanol from corn, corn residues,
3
CARD Brazil Model, which is based on the improvements in the Brazilian land use data provided by the Brazilian Land Use Model (BLUM) [31]. BLUM combines remote sensing data, field data, and micro-regional modeling to determine changes in the elasticities of multiple crops across several land types and for a series of larger regions. BLUM shows that the major LUC has been pasture intensification, use of degraded pastureland for biofuels derived from soya and sugarcane, and, to a lower extent, expansion into the southeast Cerrado and other regions [31]. Including this more detailed picture of the dynamics of land use within Brazil resulted in LUC-related emissions that were approximately 30% lower than the original values suggested by EPA analysis [31]. The large variation in LUC-related GHG emissions can mainly be explained by a strong dependence of the LUC effect mainly on the bioenergy crop and conversion technology used, the specification of the land market, endogenous possibilities for land intensification, the location of bioenergy production and consumption, and existing policies and scenarios investigated [9]. In an attempt to harmonize the models, Edwards et al. [12] used three PE models and three CGE models with, as far as possible, the same specifications regarding the marginal demand of ethanol or biodiesel demand in the EU or the USA to determine LUC-related emissions. The comparison still showed large variation in the extent of LUC but also in the location of LUC. Edwards et al. [12] found that this variation across models could not be explained by the type of market equilibrium model (PE models vs CGE models) because one type of model does not lead to consistently lower or higher estimates than the other type. Instead, the reasons for the variations are the various differing underlying assumptions and datasets (related to e.g., price-yield elasticities, yields on newly converted land, shifts in production from one region to another, changes in food consumption or substitutability of crops and their products), spatial resolution, type of land converted to bioenergy feedstock production, and co-product allocation method [12]. The results of the allocation models emphasize similar factors to be of high importance in defining the extent of ILUC; that is, yield increases, pasture rather than forest displacement, and pasture intensification [26]. While several different studies have modeled (I)LUC, few studies have been conducted to actually find evidence of ILUC in historical data. And also these studies have found mixed results on the effect of ILUC. For example, Kim and Dale [6] find no significant correlation of US biofuel production and LUC in corn and
sugarcane and switchgrass, and biodiesel from soybeans by a combination of partial equilibrium models (FASOM and FAPRI), biophysical models (DAYCENT, GREET and MOVES) and biophysical data (MODIS).
Please cite as: Wicke, Verweij, van Meijl, van Vuuren and Faaij. Indirect land use change: review of existing models and strategies for mitigation. Biofuels (2012) 3(1), 87-100.
Author version, post-acceptance
A: Biodiesel
4
LUC-related GHG emissions (g CO2e/MJ) -100
-50
0
50
B: Ethanol
LUC-related GHG emissions (g CO2e/MJ) -100
100
-50
0
50
100
-50
0
50
100
Corn
Rapeseed Al-Riffai et al. [16]
Searchinger et al. [3]
Laborde [17]
CARB [13]
Lywood et al. [25]
EPA [18]
Tipper et al. [2] – marginal
Hertel et al. [14]
Tipper et al. [2] – average
Tyner et al. [15] – Group 1 Tyner et al. [15] – Group 2
Soy
Tyner et al. [15] – Group 3
CARB [13]
Al-Riffai et al. [16]
EPA [18]
Laborde [17]
Al-Riffai et al. [16]
Lywood et al. [25]
Laborde [17]
Tipper et al. [2] – marginal
Lywood et al. [25]
303
Tipper et al. [2] – average
Tipper et al. [2] – marginal Sugarcane
Tipper et al. [2] – average
CARB [13] EPA [18]
Palm oil
Al-Riffai et al. [16]
Al-Riffai et al. [16] Laborde [17]
Laborde [17]
Tipper et al. [2] – marginal
Lywood et al. [25] Tipper et al. [2] – marginal
Tipper et al. [2] – average
Tipper et al. [2] – average Nassar et al. [28]
Sunflower Al-Riffai et al. [16]
Sugarbeet Al-Riffai et al. [16]
Laborde [17]
Laborde [17] Lywood et al. [25]
C: Average for EU biofuels madndate
Tipper et al. [2] – marginal Tipper et al. [2] – average
Al-Riffai et al. [16] Hiederer et al. [20] (IFPRI)
Wheat
Hiederer et al. [20] (IPTS)
Al-Riffai et al. [16] Laborde [17]
Laborde [17]
Lywood et al. [25]
-100
-50
0
50
100
Tipper et al. [2] – marginal Tipper et al. [2] – average
LUC-related GHG emissions (g CO2e/MJ) -100
LUC-related GHG emissions (g CO2e/MJ)
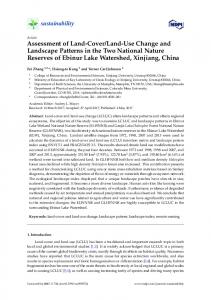
Figure 1. Overview of (direct and indirect) land use change -related greenhouse gas emissions of first generation biofuels determined in the literature (30 year allocation period) for (A) biodiesel, (B) ethanol and (C) average for EU biofuels mandate. Grey bars refer to market equilibrium models and black bars to allocation models. For an overview of the specific LUC-related GHG emissions and the ranges as determined in the literature, see Supplementary Table 1 in the supplementary online material. For an overview of the models and model specifications, see Supplementary Table 2 (market equilibrium models) and Supplementary Table 3 (allocation models) in the supplementary online material. Values shown for AlRiffai et al. [16] and Laborde et al. [17] refer to the business as usual scenario; the results for the free trade scenario are shown in Supplementary Table 1. CO2e: Carbon dioxide equivalent; LUC: Land use change.
soybean (the two main feedstocks for US biofuel production) trading partner regions (including Brazil) between 2002 and 2007. Thus, they conclude that either no ILUC was induced through 2007 or that their approach is not sensitive enough to detect ILUC from historical data [6]. Arima et al. [32] applied a different
approach using a spatial regression model that links agricultural crop expansion in one place to pasture conversion in another place. They found ILUC to be very significant in the Brazilian Amazon for the period of 2002 to 2008 [32]. It important to note that Arima et al. [32] looked at the effects of all soy production and did
Please cite as: Wicke, Verweij, van Meijl, van Vuuren and Faaij. Indirect land use change: review of existing models and strategies for mitigation. Biofuels (2012) 3(1), 87-100.
Author version, post-acceptance
not distinguish between the expansion induced (directly or indirectly) by biofuels demand. However, other studies have shown that the soy expansion in the Amazon has been dominated by the soybean meal for animal feed rather than soybean oil for biodiesel [33]. Both empirical studies on ILUC indicate that more data collection and analysis work are needed to better estimate ILUC empirically. This empirical evidence can then be used to validate assumptions and projections on LUC of market equilibrium models [34].
Uncertainties & shortcomings in existing modeling efforts Methods used to estimate the global land use impacts of bioenergy utilization are under continuous development to address discovered weaknesses. Until the recent biofuels boom, nearly all market equilibrium models treated land exogenous and linkages between agriculture and energy markets were not considered. Despite recent improvements and refinements of the models, still large uncertainties and shortcomings exist in the current modeling efforts given the complexity of the new economic reality. In general, modeling LUC requires a large amount of parameters of which many are uncertain and poorly supported by empirical evidence [10]. This can be illustrated by the wide range of future global land use projections in scenarios that have been published in the past by different modeling teams [35]. It might be expected that as time progresses, models will be better able to describe LUC processes, among others, based on more reliable econometric estimates of the relevant parameters. Modeling indirect LUC is clearly even more uncertain. Key uncertainties relate to the underlying datasets, the amount, location and type of projected LUC, future production and trade patterns of bioenergy, technological change over time and dynamic nature of LUC. These are explained in more detail below. This is followed by an overview of the main shortcomings of the existing modeling activities surrounding (I)LUC. • Underlying datasets The quality of key underlying datasets is in many cases low. For example, Al-Riffai et al. [16] describe strange intersectoral linkages in the social accounting matrices of the European Union in the commonly used GTAP7 database. Therefore, serious policy and ILUC analyses based on the GTAP data always have to adjust the basic data and extend the sectoral GTAP aggregation with ethanol, biodiesel and by-products [36,37]. Furthermore, yield responses and elasticities play a critical role in the assessment when using market equilibrium models. They are explicitly modeled, but the underlying data to determine elasticities are of low
5
quality and poorly described. Elasticity factors tend to be based on historical data, implying that future projections extrapolate what happened in the past. However, institutional changes such as sustainability criteria, land market regulations and policy changes such as reducing emissions from deforestation and forest degradation policies might change the functioning of land markets. Moreover, elasticities are often not specified per crop and region although these differences exist. For example, the elasticity that denotes the relative change in agricultural area in response to relative change in agricultural supply varies significantly across crops and time [5]. However, Searchinger et al. [3], Hertel et al. [14] and Tyner et al. [15] still apply only one average figure for all crops and all regions and in all three cases these are different from the average computed by Zilberman and colleagues [5]. Introducing endogenous land supply elasticities through land supply curves [23,24] ensures that, if regions or countries get closer to the maximum amount of land suitable for agriculture, the land supply elasticity and, in turn, ILUC effects decrease [38]. A second example is given by the global price yield elasticity (the relative increase in yields for a given increase in prices). This elasticity is 0.32 in the GTAP model used for CARB [13] and 0.25 in later GTAP model runs [14,15] while EPA [18] used a value of 0.013 for the short term and 0.074 for the long term. This example shows a large variation between models and more in-depth comparison is needed to determine what these differences actually mean for the results. A third example is the yield on newly converted land. Many models expect the yield on newly converted cropland to be lower than the average yield on existing cropland. For example, Hertel et al. [14] apply a ratio of the average yield of new cropland to the average yield on existing cropland of 0.66 for all regions. Tyner et al. [15] apply regional and land type specific values ranging between 0.51 and 1.0 for the USA and 0.89 and 1.0 for Brazil. However, Lywood et al. [39] and Babcock and Carriquiry [40] find no evidence for yields on newly converted cropland to be lower than on existing cropland in the case of EU cereals, US corn and Brazilian soybean production. This may be explained by highly productive land already partly being available but not taken into production because of high logistical or opportunity costs [10]. However, when feedstock prices rise, these constraints may be overcome. As a result, bioenergy crop yields may not be as low as projected based on marginal agricultural extension.
• Amount, location & type of projected LUC As a result of the uncertainties in the market equilibrium models, also the amount and approximate location of LUC, as projected by the market equilibrium models, is uncertain. But the specific location and type of projected LUC is even more uncertain. Firstly, LUC is a
Please cite as: Wicke, Verweij, van Meijl, van Vuuren and Faaij. Indirect land use change: review of existing models and strategies for mitigation. Biofuels (2012) 3(1), 87-100.
Author version, post-acceptance
complex and dynamic process that is affected by many different drivers (including policy) and is changing over time – characteristics that market equilibrium models cannot accurately represent [10]. Based on the complexity of factors and drivers of LUC, Plevin et al. [10] conclude that ‘the ability to predict LUC from a single driver such as commodity price increases, may be quite limited, and thus a core assumption underlying ILUC modeling is called into question, resulting in model uncertainty that is impossible to quantify.’ Secondly, modeling LUC and the resulting emissions depends on the chosen spatial resolution, time scale and type of the data used in the analysis. Thirdly, the specific location and type of LUC depends on many different factors. For example, deforestation does not take place randomly but is likely based on criteria such as tree density, road access and market access [10] while the expansion of bioenergy production also depends on other factors such as distance to road, water and cities, as well as land suitability and yields [41]. As a result, the use of average forest carbon stocks may not be representative of the type of forestland that is being converted to bioenergy production. Fourthly, future land use and land zoning policies may be more effective in controlling LUC, resulting, for example, in a reduction of deforestation. Fifthly, double cropping may become more attractive with higher feedstock prices, which would reduce the amount of additional land to be converted. However, market equilibrium models do as yet not account for double cropping [10,40]. These uncertainties in the amount, location and type of projected LUC also have consequences in terms of GHG emissions as a result of differences in assumed carbon stocks of the different land use categories [10,42]. At the same time, also the carbon stock data is uncertain and requires more research [43]. Most of these issues are difficult to deal with in a CGE model and an option pursued by Eickhout et al. [24] is to link the global CGE model LEITAP (now called MAGNET) with the biophysical IMAGE model or the even more detailed land use allocation model CLUE (see Verburg et al. [44], Banse et al. [45]). • By-products and co-products from feedstock & biofuels production By-products and co-products of bioenergy production, which can be used to meet regional food, feed and fuel demands, are not always included or not properly accounted for in the market equilibrium models. Many studies already account for oilcake as a co-products of biodiesel production and dried distillers grains with soluble (also referred to as DDGS) as a co-product of ethanol production [15,45]. However, other coproducts, such as palm kernel oil or glycerol, are not included although they can replace other land-intensive products, primarily feed for livestock production, and therefore lead to less land needed elsewhere. Not
6
accounting for these by-products and co-products of bioenergy production overestimates the LUC-related GHG emissions. • Price effects Crucial for the assessment of direct and indirect LUC as a result of biofuels is the effect of increasing demand and associated increasing feedstock prices. Although equilibrium models can capture how much of the increased demand will be met by agricultural land expansion, agricultural intensification, decreased demand for food, it is unclear how more complex changes in the production chain (such as switching to second-generation crops/fuels) will contribute. However, these new and often not yet existing production technology options have very different effects on overall LUC and GHG emissions and must therefore be included in the analysis. This requires close cooperation between technical and economic researchers. • Dynamic nature of (I)LUC (I)LUC of a specific feedstock-conversion route can change with increasing use of this route (or bioenergy in general) and over time as a result of changes in agriculture and other land use management [5,26]. However, LUC-related GHG emissions as determined for use in policies do not currently reflect the dynamic nature of (I)LUC associated with bioenergy production. In addition to uncertainties, existing modeling efforts also have shortcomings. These relate to testing the effect of the described uncertainties on the results, the focus on first generation biofuels, indirect effects of fossil fuels, impacts of LUC and the effect of introducing sustainability criteria and land use policies, as described next. • Uncertainty analysis As mentioned above, many aspects of previous (I)LUC models are highly uncertain. But although most studies conduct some kind of sensitivity analysis, no comprehensive sensitivity and uncertainty analyses have been conducted. For example, EPA [18] assessed the uncertainty in the international LUC-related emissions caused by the land use satellite data and by the GHG emission factor of land conversion. However, considerable uncertainties exist also for other parts of the analysis, most importantly in the amount and location of LUC as determined by the market equilibrium model [46].
• Focus on first generation biofuels Most studies have focused on first generation biofuels while the (I)LUC effects of second-generation biofuels are hardly assessed. (I)LUC-related GHG emissions of second-generation biofuels are expected to be lower
Please cite as: Wicke, Verweij, van Meijl, van Vuuren and Faaij. Indirect land use change: review of existing models and strategies for mitigation. Biofuels (2012) 3(1), 87-100.
Author version, post-acceptance
than first generation because the cultivation of woody and grassy biomass for second-generation biofuels production can help reverse carbon impacts on soils and has lower energy requirements than first generation feedstocks, while the energy yield per hectare is a factor two to three higher than first generation biofuels [47,48]. Still, if effective land use policies are not in place and natural areas are converted, secondgeneration biofuels may also result in negative effects, such as increased deforestation and forest degradation [19]. However, second-generation feedstocks grown on land less suitable for agriculture, such as degraded and marginal land that is not used otherwise, can provide additional benefits of, for example, carbon sequestration and restoration of that land [49,50]. • Indirect effects of fossil fuels Existing studies have only investigated the indirect effects of biofuels but have not accounted for the indirect effects of fossil fuels, such as emissions from securing oil from the Middle East or from tar sands and other unconventional fuels that are expected to provide a large share of future oil production [51]. Thus, only if indirect emissions of both fuel types are accounted for can an effective climate policy framework be created [51]. • Impacts of LUC Existing modeling of LUC has focused primarily on the resulting CO2 emissions, although there are also N2O and CH4 emissions from agriculture and agricultural intensification [52] and black carbon from fossil and biofuel combustion [10]. In addition, LUC not only has an effect on GHG emissions but also on, for example, biodiversity, water resources, land tenure and food security. But these impacts have hardly been investigated [53]. With respect to food security, it is important to mention that, as a result of higher food prices, the market equilibrium models result in lower food consumption, which induces a GHG benefit for biofuels [14]. Hertel et al. [14] note that, although this may not necessarily cause a nutritional deficit among wealthy households, it may do so for the poor, already malnourished ones. Testing the effect of keeping food consumption constant, Hertel et al. [14] then find that the GHG emission factor of LUC caused by US corn ethanol production would increase by 41%. Also Laborde [17] estimates this effect, but determines it to be only 20%. Another shortcoming related to the impacts of LUC is that most studies have looked at the effects of ethanol or biodiesel mandates of the EU or the USA separately. However, the demand for both ethanol and biodiesel from the EU and the USA (here quantities can also vary) as well as from other countries or regions will exist in parallel and the effect of the combined demand has hardly been assessed (with the exception of Banse et al.
7
[37]). In addition, the effects vary depending on whether marginal or average effects are measured. Neither the marginal nor the average effect is consistently measured in all studies. • Scenarios with sustainability criteria & land use policies Most market equilibrium models have not taken the effect of sustainability criteria and national land use policies into account. Particularly criteria with respect to excluding forests from conversion to bioenergy or forest conservation policies in general have been introduced in many different countries and may limit deforestation.
Further analysis work Based on the description of uncertainties and shortcomings of the existing modeling efforts for assessing (I)LUC, several recommendations for further analysis and improvements of the (I)LUC models can be given. • Improve key feedback relations of price, innovation & policy to productivity increases Insights in, data of and simulation of yield responses and management changes in agriculture and livestock in relation to demand, prices, R&D and various policy strategies (including agricultural subsidies) are still underdeveloped and require further improvements. Particularly, more regional and crop-specific (and possibly temporal) differentiation of elasticities and farmers’ responses to increasing prices in terms of intensification versus expansion of agricultural land use is needed [5]. • Improve input data & further refine modeling approach In addition to key feedback relations, other aspects of the (I)LUC models need improvements to allow modeling (I)LUC as accurately as possible. Most important examples for improvements are the inclusion of technological learning for food crop, livestock and bioenergy production, technological details of biofuel production systems with respect to e.g. production efficiency and delivery of co-products, better integration of economic and biophysical models and data, and other underlying data (see Section 3). In addition, field measurements and model validation are needed to reduce uncertainties of analyses and models [6]. • Include lignocellulosic feedstocks & secondgeneration biofuels Lignocellulosic feedstocks and second-generation biofuels are not included in most analyses although they are thought to have lower (I)LUC effects than first generation biofuels. Projections up to 2020 should now
Please cite as: Wicke, Verweij, van Meijl, van Vuuren and Faaij. Indirect land use change: review of existing models and strategies for mitigation. Biofuels (2012) 3(1), 87-100.
Author version, post-acceptance
include a possible market entry of second-generation biofuels (following the scenarios of e.g., IEA Energy Technology Perspectives 2010 [54] and IEA World Energy Outlook 2010 [55]) while further growth of biofuels production and use beyond 2020 is likely to be dominated by second-generation production chains once these become competitive with projected oil prices of 80–100 US$/barrel. • Conduct comprehensive uncertainty analyses Comprehensive uncertainty analyses of the different market equilibrium models combined with biophysical models are needed to better understand uncertainties and uncertainty propagation in (I)LUC modeling. Especially important are uncertainty assessments of: The market equilibrium models, where factors such as regional specific yield developments due to climate change, learning and technological change, such as penetration of second-generation bioenergy crops, must be investigated; the effect of sustainability criteria on direct and indirect LUC [16,46]. A better understanding of the uncertainties and the sensitivity of the results to these factors is important for dealing with any LUC and helps identifying the conditions under which low (I)LUC can be achieved. • Further harmonize different modeling efforts Edwards et al. [12] have compared LUC results from different market equilibrium models for marginal increases in biofuels production. They found significant LUC for all scenarios (ethanol vs biodiesel, demand in the USA vs EU) but also large ranges in LUC within each scenario. Further harmonization of parameters, databases and assumptions used in the models are needed to come to more comparable outcomes between initiatives. • Investigate the drivers of LUC Consistent monitoring and data collection of land use and LUCs at a regional level are required in order to better understand and model the dynamics and complexity of LUC and all its drivers. Establishing appropriate social, economic and environmental indicators of LUC - with measurements that are simple to obtain - would then also enable a more in-depth analysis of development options with bioenergy. A starting point for developing bioenergy resources sustainably is an interlinked integral governance of land use, land use planning and zoning, and development of agriculture and livestock (see also Section 5). • Investigate all impacts of LUC Further research is needed on the impacts of LUC such as GHG emissions other than just CO2, biodiversity, water resources, food security and land tenure.
8
• Use the models in a pro-active manner & represent new policy criteria correctly The basic approach of using market equilibrium models to date is to simulate impacts on land, prices and (eventually) GHG emissions of (I)LUC as a consequence of increasing biomass production for energy. Sustainability criteria are not taken into account, although they are an integral part of some renewable energy policies, such as the EU Renewable Energy ** directive (EU RED). Remarkably, very few studies attempted to include these criteria and focused on minimizing the undesired (I)LUC effects. In current studies, (I)LUC is a reactive concept while the alternative is to be pro-active and to minimize (I)LUC via proper policies. Studies that show how this can be achieved are highly relevant for policy makers as they can deliver more concrete input for developing proper policy strategies. As do ILUC assessment studies, also these studies require an improved economic modeling framework. (I)LUC modeling should then include different scenarios to determine under which conditions LUC effects are minimized. Important to include in these scenarios are sustainability criteria as well as the different strategies (and combination of strategies) for minimizing (I)LUC, such as optimized bioenergy chains, the use of degraded and marginal land, bioenergy production from agricultural and forestry residues and waste, and woody and grassy crops (see section 5). Investigating the different mitigation options by the models then allows determining the actual effect of these strategies on (I)LUC. In addition, research on the competitiveness of the different mitigation options and specific case studies to demonstrate their viability are needed.
Strategies for mitigating (I)LUC Most of the research so far has concentrated on estimating (I)LUC under standard policy conditions. In the previous sections, this review of existing models showed that there is a wide range of outcomes – and that there are several reasons that could explain this range. This range was partially explained by a difference in focus: while some studies try to account for factors that may mitigate (I)LUC, other studies focus more on the possible detrimental accounts. In that light, it is important to recognize that exploring how to mitigate (I)LUC is potentially even more interesting from a policy perspective than estimating (I)LUC under current assumptions. This may, in fact, also help in reducing the uncertainty in current model outcomes as it would **
Key term: The Renewable Energy Directive (RED) of the European Union accounts for direct LUC-related emissions of various biofuel pathways. Indirect LUC-related emissions are not yet accounted for but the EC is currently discussing how to deal with ILUC as a result of European bioenergy demand.
Please cite as: Wicke, Verweij, van Meijl, van Vuuren and Faaij. Indirect land use change: review of existing models and strategies for mitigation. Biofuels (2012) 3(1), 87-100.
Author version, post-acceptance
harmonize some of the assumptions made on the policy context. A main strategy for minimizing ILUC is the promotion of biofuels with low ILUC risks, such as currently unused residues from agricultural crop and forestry production and processing as well as woody and grassy feedstocks for second-generation biofuels production, particularly those produced on degraded and marginal land. Residues and by-products that are not currently used, and can therefore be classified as ‘waste’, will cause little to no ILUC [56,57]. However, if currently used residues are diverted to bioenergy production, they are likely to have negative impacts (including ILUC). But the effect strongly depends on the type of residue considered, existing regionally and temporally specific uses of the residue and possible substitutes and their emission factors [57]. Particularly the regional differences must be investigated to better understand the bioenergy potential of residues and their ILUC mitigation effect. In addition, for the forest residues it is important to note that organic carbon could be retained for a longer period of time if they are left in the forest rather than used for energy [58]. In addition, minimizing bioenergy-induced ILUC is not only an issue for bioenergy alone but must rather be seen in context of all other land uses [32,56,58–60]. This is because ILUC of biofuels is the DLUC of another activity. Recent studies also suggest that the extent of ILUC mainly depends on agricultural and livestock management, the rate of improvement in its efficiency, and the rate of deployment of (second-generation) bioenergy production [16,19,58,61]. The remainder of this section therefore focuses on strategies for mitigating all undesired LUC and its impacts (Not all LUC is undesirable; for example, revegetating degraded land with woody and grassy bioenergy feedstocks can lead to the restoration of that land and can have positive impacts on carbon stocks, water quality and availability and food security in the long term [50]). These strategies focus on controlling the extent of LUC or controlling the type of LUC. The main strategies for controlling the extent of LUC are to: • Increase efficiencies in agricultural crop and livestock production. Agricultural crop yield increases can be achieved by improved fertilizer application (e.g., through increasing the amount and/or improving the timing of nitrogen fertilizer application), better weed and pest management, switching varieties grown, investments in agricultural research and development, and multiple rotations (such as conventional crops in the summer and cool season grasses in the winter) [52,59,62]. Increasing livestock production efficiencies is possible through increasing grazing density, increasing pasture productivity by, for example, fertilization or introduction of higher productivity grasses, improved feeding practices (e.g., partially
9
•
•
•
•
replacing forage by more concentrated fodder and higher protein diets, and landless livestock production [63,64]; Integrate food, feed and fuel production to increase total biomass production per hectare. Examples of integration of different feedstock production objectives into multifunctional land use practices are agroforestry and silvopastoral production systems that combine food, fodder and fuel crop production. In addition, also the integration of biomass conversion processes and the production of multiple products such as fuels, power, heat, chemicals as well as feed (a concept generally referred to as biorefining) is important for increasing the per hectare output. Examples range from conventional biorefining systems (i.e. feeding residues from bioenergy production to animals, see e.g. Egeskog et al. [65] for the case of residues from sugarcane ethanol production used in the feed mix of dairy cattle in Pontal, Brazil) to newer types of biorefineries (e.g. lignocellulosic feedstock biorefinery [59,66]. Another option for the integration of different uses is biomass cascading, i.e. the subsequent use of biomass for materials, recycling and energy recovery [67,68]; Improve efficiencies of agricultural, forestry and bioenergy supply chains. Improving the efficiency of agricultural, forestry and bioenergy supply chain also increases the per-hectare productivity. This can be done by, for example, reducing losses in storage and transportation and increasing conversion and processing efficiencies (e.g. through the biorefining concept as mentioned above) [69]; Minimize degradation and abandonment of agricultural land. Degradation and abandonment of agricultural land often occurs as a result of agricultural mismanagement, such as irrigationinduced salinization and soil compaction due to overgrazing. By improving agricultural management, degradation and abandonment of agricultural land and subsequent conversion of additional land (e.g. forest-covered land) to agriculture can be minimized [26,50]; Apply other forms of highly efficient land use. An example of highly efficient land use is the production of algae on waste land. Algae production on waste land does not cause ILUC but particularly its economic performance is currently poor and it is unclear if and when it can become commercially viable [69].
In addition to minimizing the extent of LUC, the impacts of LUC can be minimized by controlling the type of LUC. The main strategies are to: • Develop and implement sustainable land use planning and monitoring. Appropriate zoning of
Please cite as: Wicke, Verweij, van Meijl, van Vuuren and Faaij. Indirect land use change: review of existing models and strategies for mitigation. Biofuels (2012) 3(1), 87-100.
Author version, post-acceptance
land use and land cover is needed to minimize undesired LUC. This is only possible if sufficient data on land use and land cover are available, with acceptable accuracy and a proper resolution. In addition, this data must be collected at regular time intervals to allow improved monitoring of land use and to ensure compliance with land use planning; • Exclude high carbon stock and important biodiversity areas by land use policies all around the world. Better zoning of land use and land cover should specifically address the exclusion of high carbon stocks such as forests and peatland and important biodiversity areas from conversion in order to minimize GHG emissions and biodiversity losses. Degradation of forest and deforestation may be addressed by the reducing emissions from deforestation and forest degradation program proposed for inclusion in a post-Kyoto climate mitigation strategy and the high conservation value concept may be used to define natural habitats of outstanding significance or critical importance with respect to endemic species, sacred sites or important resources for local residents; • Promote the use of marginal land, degraded lands or abandoned agricultural land for bioenergy production. Degraded land is land that has experienced the long-term loss of ecosystem function and services caused by disturbances from which the system cannot recover unaided [70]. Marginal land is land on which cost-effective food and feed production is not currently possible under the given site conditions and cultivations techniques. However, with the introduction of new technologies or changes in the cost structure, this may change in the future. Abandoned agricultural land is land that was previously used for agricultural crop production or as pasture but that has been abandoned and not converted to forest or urban areas [71]. The use of marginal, degraded or abandoned agricultural land for woody and grassy feedstock production is often promoted in order to reduce the pressure on agricultural land and nature areas. Several studies have indicated a significant potential from degraded and marginal land for various world regions, particularly Africa [49,72,73]. Moreover, converting marginal and degraded land for woody and grassy feedstock production can provide additional ecosystem services and functions, such as erosion control, improved water retention, phytoremediation (e.g., salt-affected soils), buffer zones (both for nature reserves and pollution control) and soil carbon sequestration [48,50]. However, some aspects surrounding the use of marginal or degraded land are still uncertain. Key uncertainties are related to defining degraded lands and translating this into policy measures, potential yields and the current uses and functions of
10
degraded land [74]. The potentially lower yields on degraded and marginal land result in more land required than with highly productive land, which is an additional issue to be considered. Also abandoned agricultural land may still provide important ecosystem and other service functions to rural communities and the actual availability for bioenergy feedstock production must therefore be assessed in the future. A limited number of initiatives has already developed approaches to mitigate ILUC and its impacts. These initiatives are based on an integrated approach of prevention and promotion measures. For example, the Dutch Committee on Biomass Sustainability Issues [75] has recommended an integral approach to tackling ILUC, which includes the introduction of an ILUC GHG emission factor as well as making agriculture more sustainable and more efficient. Another example is the CIIB-project (Certification system addressing Indirect Impacts of Biofuels); a private sector initiative involving WWF International, the Roundtable for Sustainable Biofuels, Ecofys and other project partners [76]. The CIIB-project is based on the Responsible Cultivation Area (RCA) initiative and aims at developing a practical and cost-effective certification system for biofuels with low indirect impacts. In addition to minimizing the extent and the effects of LUC, more general strategies for mitigating the undesired LUC and its negative effects are to introduce sustainability criteria for all other land-intensive activities, such as food and feed production and a global cap on LUC-related emissions for all countries, a strategy, which are more fundamental and more difficult to implement globally [69].
Future perspective This review of existing models of LUC-related GHG emissions and strategies for mitigating them emphasized that ILUC of biofuels - and more generally all LUC - largely depend on agricultural crop production and livestock management, the developments in their efficiencies and the rate of deployment of (secondgeneration) bioenergy production. Therefore, any future approach for minimizing LUC of bioenergy production needs to integrate all land uses, particularly agriculture. The review also showed that, despite recent improvements and refinements of the models, still significant shortcomings and uncertainties, primarily those related to the underlying data and assumptions of the market equilibrium models, exist. Thus, both studies that assess (I)LUC and those that show how (I)LUC can be minimized need an improved economic modeling toolbox that is closely integrated with biophysical land use models and fed by detailed technical information. Such assessments can then deliver more concrete input
Please cite as: Wicke, Verweij, van Meijl, van Vuuren and Faaij. Indirect land use change: review of existing models and strategies for mitigation. Biofuels (2012) 3(1), 87-100.
Author version, post-acceptance
for developing proper policy strategies. Consequently, LUC modeling should include different scenarios to determine under which conditions LUC effects are minimized. Important to include in these scenarios are sustainability criteria as well as the different strategies for minimizing undesired LUC and its negative effects, such as the more efficient agricultural crop and livestock production, optimized bioenergy chains, and use of degraded and marginal land for bioenergy feedstock
11
production. In addition, more fundamental options such as introducing sustainability criteria for all land-intensive activities (including food and feed production) and a global cap on LUC-related emissions for all countries, have to be investigated. At the same time, low ILUC risk biofuels should be promoted, such as currently unused residues and by-products as well as woody and grassy feedstocks for second-generation biofuels, particularly those produced on degraded land.
Executive summary Current status of modeling land use change -related greenhouse gas emissions • Although nearly all previous studies show significant land use change (LUC)-related greenhouse gas (GHG) emissions, large variation within and across feedstock-conversion routes are found. • The variations are explained mainly by differing underlying datasets of the market equilibrium models, differing assumptions with respect to crop yield increases and livestock intensification, the level of geographical resolution, type of land converted to bioenergy feedstock production, and co-product allocation. Uncertainties & shortcomings in existing modeling efforts • Despite recent improvements and refinements of the models, still large uncertainties and shortcomings exist in the current modeling efforts. • Key uncertainties relate to the underlying datasets, the amount, location and type of projected LUC, by-/coproduct allocation, future production and trade patterns of bioenergy, technological change over time and dynamic nature of LUC. • Shortcomings of existing assessments of LUC-related GHG emissions are the lack of comprehensive uncertainty analysis, focus on first generation biofuels, not accounting for the indirect effects of fossil fuels, not accounting for the effects of sustainability criteria and land use policies, and not assessing all impacts of LUC. Further analysis work • Improve key feedback relations of price, innovation and policy to productivity increases. • Improve input data and further refine modeling approach. • Include lignocellulosic feedstocks and second-generation biofuels. • Conduct comprehensive uncertainty analyses. • Further harmonize different modeling efforts. • Investigate the drivers of LUC. • Investigate all impacts of LUC. • Use the models in a pro-active manner. Strategies for mitigating (I)LUC • A main strategy for mitigating indirect LUC (ILUC) is the promotion of biofuels with low ILUC risks, such as currently unused residues from agriculture, forestry and processing, as well as woody and grassy feedstocks for second-generation biofuels, particularly those produced on degraded and marginal land. • However, ILUC induced by growing bioenergy demand is not only an issue for bioenergy alone but must rather be seen in context of all other land uses, particularly agriculture. • Both studies that assess (I)LUC and those that show how (I)LUC can be minimized need an improved economic modeling toolbox that is closely integrated with biophysical land use models and fed by detailed technical information. Such an assessment can then deliver more concrete input for developing proper policy strategies. • Strategies for mitigating LUC include increasing efficiencies in agricultural crop and livestock production; integrating food, feed and fuel production to increase total biomass production per hectare; improving efficiencies of agricultural, forestry and bioenergy supply chains; and minimizing degradation and abandonment of current agricultural land in production. • Strategies for controlling the type of LUC include developing and implementing sustainable land use planning, including monitoring; excluding high carbon stock and important biodiversity areas by land use policies all around the world; and promoting the use of marginal, degraded or abandoned agricultural land for bioenergy production.
Please cite as: Wicke, Verweij, van Meijl, van Vuuren and Faaij. Indirect land use change: review of existing models and strategies for mitigation. Biofuels (2012) 3(1), 87-100.
Author version, post-acceptance
12
Acknowledgements This research was conducted within the research program ‘Knowledge Infrastructure for Sustainable Biomass’, which is funded by the Dutch Ministry of Economic Affairs, Agriculture and Innovation, the European Climate Foundation and the David and Lucile Packard Foundation. The authors would like to thank Jeff Powell (LEI-WUR) and Koen Overmars (PBL) for their comments on an earlier draft of this article.
Supplementary data
Financial & competing interests disclosure The authors have no relevant affiliations or financial involvement with any organization or entity with a financial interest in or financial conflict with the subject matter or materials discussed in the manuscript. This includes employment, consultancies, honoraria, stock ownership or options, expert testimony, grants or patents received or pending, or royalties. No writing assistance was utilized in the production of this manuscript.
Supplementary data is provided as an annex below.
References 1
2
3
4
5
6
7
8
9
IPCC. Summary for policymakers. In: IPCC Special Report on Renewable Energy Sources and Climate Change Mitigation, Edenhofer O, Pichs-Madruga R, Sokona Y et al. (Eds). Cambridge University Press, Cambridge, UK and NY, USA (2011). Tipper R, Hutchison C, Brander M. A practical approach for policies to address GHG emissions from indirect land use change associated with biofuels. Ecometrica, Edinburgh, UK (2009). Searchinger T, Heimlich R, Houghton RA et al. Use of US croplands for biofuels increases greenhouse gases through emissions from land use change. Science 319(5867), 1238–1240 (2008). * Study that first highlighted the potential significance of indirect land use change (LUC). Gawel E, Ludwig G. The ILUC dilemma: how to deal with indirect land use changes when governing energy crops? Land Use Policy 28(4), 846–856 (2011). Zilberman D, Hochman G, Rajagopal D. Indirect land use change: a second best solution to a first class problem. AgBioForum 13(4), 382–390 (2010). Kim S, Dale BE. Indirect land use change for biofuels: testing predictions and improving analytical methodologies. Biomass Bioenerg. 35(7), 3235–3240 (2011). Fritsche UR, Wiegmann K. Indirect land use change and biofuels. Oeko-Institute, prepared for European Parliament's Committee on Environment, Public Health and Food Security, Brussels, Belgium (2011). Rankin J. Growing pressure to change EU biofuel policy. European Voice. 28.04.2011, (2011). Khanna M, Crago CL, Black M. Can biofuels be a solution to climate change? The implications of land use change-
10
11
12
13
14
15
16
related emissions for policy. Interface Focus 1(2), 233–247 (2011). * Description of different approaches to modeling indirect LUC, sensitivities and uncertainties in models and policy implications. Plevin RJ, O'Hare M, Jones AD, Torn MS, Gibbs HK. Greenhouse gas emissions from biofuels' indirect land use change are uncertain but may be much greater than previously estimated. Environ. Sci. Technol. 44(21), 8015–8021 (2010). * Uncertainty analysis of LUC-related greenhouse gas (GHG) emissions Prins AG, Stehfest E, Overmars KP, Ros J. Are models suitable for determining ILUC factors? Netherlands Environmental Assessment Agency, Bilthoven, The Netherlands (2010). Edwards R, Mulligan D, Marelli L. Indirect land use change from increased biofuels demand. Comparison of models and results for marginal biofuels production from different feedstocks. European Commission, Joint Research Centre, Institute for Energy, Ispra, Italy (2010). CARB. Low carbon fuel standard. California Air Resources Board, Sacramento, CA, USA (2010). Hertel TW, Golub AA, Jones AD, O'Hare M, Plevin RJ, Kammen DM. Effects of US maize ethanol on global land use and greenhouse gas emissions: estimating market-mediated responses. BioScience 60(3), 223–231 (2010). Tyner WE, Taheripour F, Zhuang Q, Birur DK, Baldos U. Land use changes and consequent CO2 emissions due to US corn ethanol production: a comprehensive analysis. Center for Global Trade Analysis, Purdue University, West Lafayette, IN, USA (2010). Al-Riffai P, Dimaranan B, Laborde D. Global trade and environmental impact study of the EU biofuels mandate.
17
18
19
20
21
22
23
International Food Policy Research Institute, Washington, DC, USA (2010). Laborde D. Asessing the land use change consequences of European biofuels policies. International Food Policy Research Institute, Washington, DC, USA (2011). * Most recent study investigating LUCrelated GHG emissions; includes many different feedstocks and a detailed uncertainty analysis. EPA. Renewable Fuel Standard Program (RFS2) Regulatory Impact Analysis. United States Environmental Protection Agency, Washington, DC, USA (2010). Melillo JM, Reilly JM, Kicklighter DW et al. Indirect emissions from biofuels: how important? Science 326(5958), 1397–1399 (2009). Hiederer R, Ramos F, Capitani C et al. Biofuels: a new methodology to estimate GHG emissions from global land use change a methodology involving spatial allocation of agricultural land demand and estimation of CO2 and N2O emissions. European Commission, Joint Research Centre, Ispra, Italy (2010). van Tongeren F, van Meijl H, Surry Y. Global models applied to agricultural and trade policies: a review and assessment. Agr. Econ. 26(2), 149–172 (2001). Lee HL, Hertel TW, Sohngen B, Ramankutty N. Towards an integrated land use data base for assessing the potential for greenhouse gas mitigation. Center for Global Trade Analysis, Purdue University, West Lafayette, IN, USA (2005). van Meijl H, van Rheenen T, Tabeau A, Eickhout B. The impact of different policy environments on agricultural land use in Europe. Agr. Ecosyst. Environ. 114(1), 21–38 (2006). * This study introduces a land supply curve to represent the process of land conversion and land abandonment
Please cite as: Wicke, Verweij, van Meijl, van Vuuren and Faaij. Indirect land use change: review of existing models and strategies for mitigation. Biofuels (2012) 3(1), 87-100.
Author version, post-acceptance
24
25
26
27
28
29
30
31
32
33
34
endogenously. This approach ensures that, if regions or countries get closer to the maximum amount of land suitable for agriculture, the land supply elasticity and, in turn, indirect LUC effects decrease. Eickhout B, van Meijl H, Tabeau A, Stehfest E. The impact of environmental and climate constraints on global food supply. In: Economic Analysis of Land Use in Global Climate Change Policy, Hertel TW, Rose S, Tol RSJ (Eds). Routledge, Oxford, UK, (2009). Fritsche UR, Hennenberg KJ, Hünecke K. The "ILUC Factor" as a means to hedge risks of GHG emissions from indirect land use change. Oeko-Institute, Darmstadt, Germany (2010). Bauen A, Chudziak C, Vad K, Watson P. A causal descriptive approach to modeling the GHG emissions associated with the indirect land use impacts of biofuels. E4tech, Lausanne, Switzerland (2010). Lywood W, Pinkney J, Cockerill S. Indirect effects of biofuels. Ensus, Yarm, UK (2008). Nassar AM, Antoniazzi LB, Moreira MR, Chiodi L, Harfuch L. An allocation methodology to assess GHG emissions associated with land use change. Institute for International Trade Negotiations, Sao Paulo, Brazil (2010). Overmars KP, Stehfest E, Ros JPM, Prins AG. Indirect land use change emissions related to EU biofuel consumption: an analysis based on historical data. Environ. Sci. Policy 14(3), 248–257 (2011). Yeh S, Witcover J. Indirect land-use change from biofuels: recent developments in modeling and policy landscapes. International Food and Agricultural Trade Policy Council, Washington, DC, USA (2010). Nassar AM, Harfuch L, Moreira MR, Bachion CL, Antoniazzi LB, Sparovek G. Impacts on land use and GHG emissions from a shock on Brazilian sugarcane ethanol exports to the United States using the Brazilian Land Use Model (BLUM). Institute for International Trade Negotiations, Sao Paulo, Brazil (2009). Arima EY, Richards P, Walker R, Caldas MM. Statistical confirmation of indirect land use change in the Brazilian Amazon. Environ. Res. Lett. 6(2), 024010 (2011). * Article that investigates the empirical evidence of indirect LUC. Verweij P, Schouten M, van Beukering P, Triana J, van der Leeuw K, Hess S. Keeping the Amazon Forests standing: a matter of values. Report commissioned by WWF Netherlands, Zeist, the Netherlands (2009). Kline KL, Oladosu GA, Dale VH, McBride AC. Scientific analysis is essential to assess biofuel policy effects: in response to the paper by Kim and Dale on "indirect land-use change for biofuels: testing predictions and improving
13
35
36
37
38
39
40
41
42
43
44
45
46
47
analytical methodologies". Biomass Bioenerg. 35(10), 4488–4491 (2011). Smith P, Gregory PJ, van Vuuren DP et al. Competition for land. Philos. Trans. R. Soc. Lond. B. Biol. Sci. 365(1554), 2941–2957 (2010). Banse M, van Meijl H, Tabeau A, Woltjer G. Will EU biofuel policies affect global agricultural markets? Eur. Rev. Agric. Econ. 35, 117–141 (2008). Banse M, Tabeau A, van Meijl H, Woltjer G, Prins AG. Global impact of multinational biofuel mandates on land use, feedstock prices, international trade and greenhouse gas emissions. Presented at: The 14th Annual Conference on Global Economic Analysis "Governing Global Challenges: Climate Change, Trade, Finance and Development". Venice, Italy, 16–18 June 2011. Prins AG, Eickhout B, Banse M, van Meijl H, Rienks W, Woltjer G. Global impacts of European agricultural and biofuel policies. Ecol. Soc. 16(1), 49 (2011). Lywood W, Pinkney J, Cockerill SAM. The relative contributions of changes in yield and land area to increasing crop output. Glob. Change Biol. Bioenergy 1(5), 360– 369 (2009). Babcock BA, Carriquiry M. An exploration of certain aspects of CARB's approach to modeling indirect land use from expanded biodiesel production. Center for Agricultural and Rural Development, Iowa State University, Ames, IA, USA (2010). van der Hilst F, Verstegen JA, Karssenberg D, Faaij APC. Spatio-temporal land use modeling to assess land availability for energy crops – illustrated for Mozambique. Glob. Change Biol. Bioenergy In press, (2011). Doi: 10.1111/j.17571707.2011.01147.x Gibbs HK, Ruesch AS, Achard F et al. Tropical forests were the primary sources of new agricultural land in the 1980s and 1990s. PNAS 107(38), 16732– 16737 (2010). Gibbs HK, Brown S, Niles JO, Foley JA. Monitoring and estimating tropical forest carbon stocks: making REDD a reality. Environ. Res. Lett. 2(4), 045023 (2007). Verburg P, Eickhout B, van Meijl H. A multi-scale, multi-model approach for analyzing the future dynamics of European land use. Ann. Regional Sci. 42(1), 57–77 (2008). Banse M, van Meijl H, Tabeau A, Woltjer G, Hellmann F, Verburg PH. Impact of EU biofuel policies on world agricultural production and land use. Biomass Bioenerg. 35(6), 2385–2390 (2011). Plevin RJ. Review of final RFS2 analysis. Energy and Resources Group, University of California, Berkeley, CA, USA (2010). Hoefnagels R, Smeets E, Faaij A. Greenhouse gas footprints of different biofuel production systems. Renew.
48
49
50
51
52
53
54
55
56
57
58
59
60
Sust. Energ. Rev. 14(7), 1661–1694 (2010). Gibbs HK, Johnston M, Foley JA et al. Carbon payback times for crop-based biofuel expansion in the tropics: the effects of changing yield and technology. Environ. Res. Lett. 3(034001), (2008). Wicke B, Smeets E, Dornburg V et al. The global technical and economic potential of bioenergy from salt-affected soils. Energy Environ. Sci. 4(8), 2669–2681 (2011). Schubert R, Schellnhuber HJ, Buchmann N et al. Future bioenergy and sustainable land use. Earthscan. German Advisory Council on Global Change (WBGU), London, UK and Sterling, VA, USA (2009). Liska AJ, Perrin RK. Indirect land use emissions in the life cycle of biofuels: regulations vs science. Biofuels, Bioprod. Biorefin. 3(3), 318–328 (2009). Stehfest E, Ros J, Bouwman L. Indirect effects of biofuels: intensification of agricultural production. Netherlands Environmental Assessment Agency, Bilthoven, The Netherlands (2010). van Oorschot M, Ros J, Notenboom J. Evaluation of the indirect effects of biofuel production on biodiversity: assessment across spatial and temporal scales. Netherlands Environmental Assessment Agency, Bilthoven, The Netherlands (2010). OECD/IEA. Energy Technology Perspectives 2010. Organization for Economic Co-operation and Development and International Energy Agency, Paris, France. (2010). OECD/IEA. World Energy Outlook 2010. Organization for Economic Co-operation and Development and International Energy Agency, Paris, France. (2010). Berndes G, Bird N, Cowie A. Bioenergy, land use change and climate change mitigation: report for policy advisors and policy makers. Chalmers University of Technology, Gothenburg, Sweden (2010). Brander M, Hutchison C, Sherrington C et al. Methodology and evidence base on the indirect greenhouse gas effects of using wastes, residues, and by-products for biofuels and bioenergy. Ecometrica, Edinburgh, UK, Eunomia, Bristol, UK and Imperial College, London, UK, (2009). Chum H, Faaij A, Moreira J et al. Bioenergy. In: IPCC Special Report on Renewable Energy Sources and Climate Change Mitigation. Edenhofer O, PichsMadruga R, Sokona Y et al. (Eds.). Cambridge University Press, Cambridge, UK and NY, USA, (2011). Dale BE, Bals BD, Kim S, Eranki P. Biofuels done right: land efficient animal feeds enable large environmental and energy benefits. Environ. Sci. Technol. 44(22), 8385–8389 (2010). Witcover J, Yeh S. Policy options for addressing global land use change associated with biofuel policy. Institute
Please cite as: Wicke, Verweij, van Meijl, van Vuuren and Faaij. Indirect land use change: review of existing models and strategies for mitigation. Biofuels (2012) 3(1), 87-100.
Author version, post-acceptance
61
62
63
64
65
of Transportation Studies, University of California, Davis, CA, USA (2011). Lapola DM, Schaldach R, Alcamo J et al. Indirect land-use changes can overcome carbon savings from biofuels in Brazil. PNAS In press, (2010). * Shows the importance of intensification of livestock production for reducing overall LUC and related GHG emissions de Wit M, Londo M, Faaij A. Productivity developments in European agriculture: relations to and opportunities for biomass production. Renew. Sust. Energ. Rev. 15(5), 2397–2412 (2011). Smeets EMW, Faaij APC, Lewandowski IM, Turkenburg WC. A bottom-up assessment and review of global bioenergy potentials to 2050. Prog. Energy Combust. Sci 33(1), 56–106 (2007). Smith P, Martino D, Cai Z et al. Greenhouse gas mitigation in agriculture. Philos. Trans. R. Soc. Lond. B. Biol. Sci. 363(1492), 789–813 (2008). Egeskog A, Berndes G, Freitas F, Gustafsson S, Sparovek G. Integrating bioenergy and food production – a case study of combined ethanol and dairy
14
66
67
68
69
70
71
72
production in Pontal, Brazil. Energ. Sust. Dev. 15(1), 8–16 (2011). Winters P. Current status of cellulosic biofuel commercialization in the United States. Ind. Biotechnol. 7(5), 365–374 (2011). Dornburg V, Faaij APC. Cost and CO2emission reduction of biomass cascading: methodological aspects and case study of SRF poplar. Clim. Change 71(3), 373–408 (2005). Shen L, Patel M. Life cycle assessment of polysaccharide materials: a review. J. Polym. Environ. 16(2), 154–167 (2008). Fritsche UR, Sims REH, Monti A. Direct and indirect land-use competition issues for energy crops and their sustainable production – an overview. Biofuels, Bioprod. Biorefin. 4(6), 692–704 (2010). UNEP. Global Environment Outlook (GEO-4): environment for development. United Nations Environment Programme, Nairobi, Kenya (2007). Wiegmann K, Hennenberg KJ, Fritsche UR. Degraded land and sustainable feedstock production - Issue paper. ÖkoInstitute, Darmstadt, Germany (2008). Nijsen M, Smeets EMW, Stehfest E, van Vuuren D. An evaluation of the global
73
74
75
76
potential of bioenergy production on degraded lands. Glob. Change Biol. Bioenergy In press, (2011). Doi: 10.1111/j.1757-1707.2011.01121.x Wicke B, Smeets E, Watson H, Faaij A. The current bioenergy production potential of semi-arid and arid regions in sub-Saharan Africa. Biomass Bioenerg. 35(7), 2773–2786 (2011). Wicke B. Bioenergy production on degraded and marginal land: assessing its potentials, economic performance and environmental impacts for different settings and geographical scales. Utrecht University, Copernicus Institute - Science, Technology and Society. PhD thesis, 203 pages (2011). CDB. Make agriculture part of the solution! Recommendation on indirect land use change. Committee on Biomass Sustainability Issues, Den Haag, The Netherlands (2009). Dehue B, Meyer S, van de Staaij J, Junquera V, Máthé L, Luebbeke I. Certification module for low indirect impact biofuels - field-testing version. Ecofys, Utrecht, The Netherlands (2011
Please cite as: Wicke, Verweij, van Meijl, van Vuuren and Faaij. Indirect land use change: review of existing models and strategies for mitigation. Biofuels (2012) 3(1), 87-100.
Author version, post-acceptance
15
Supplementary online material Table 1: Overview of (I)LUC GHG emissions determined in the literature (30 year allocation period) Biofuel / Reference
Corn ethanol Searchinger et al. [3] CARB [13] EPA [18] Hertel et al. [14] Tyner et al. [15] – Group 1 Tyner et al. [15] – Group 2 Tyner et al. [15] – Group 3 Al-Riffai et al. [16] Laborde [17] Lywood et al. [27] Tipper et al. [2] – marginal Tipper et al. [2] – average Fritsche et al. [25] Sugarcane ethanol CARB [13] EPA [18] Al-Riffai et al. [16] Laborde [17] Lywood et al. [27] Bauen et al. [26] Nassar et al. [28] Tipper et al. [2] – marginal Tipper et al. [2] – average Fritsche et al. [25] Sugar beet ethanol Al-Riffai et al. [16] Laborde [17] Tipper et al. [2] – marginal Tipper et al. [2] – average Lywood et al. [27] Wheat ethanol Al-Riffai et al. [16] Laborde [17] Tipper et al. [2] – marginal Tipper et al. [2] – average Bauen et al. [26] Lywood et al. [27]
LUC-related GHG emissions (g CO2e / MJ) ILUC LUC 104 32 26 (18-36) e 27 (15-90) 21 18 15 12 / 53 b,d 7/7g -65 b 18 b 2b 32 – 75 b 46 4 (-4–10) e 12 / 13 b,d 9 / 11 g 42 b 8 – 27 a 7c 38 b 3b 5 – 19 b 12 / 44 b,d 5/3g 18 b 2 0 25 / 11 b,d 9/9g 18 b 2b
Biofuel / Reference
Rapeseed biodiesel Al-Riffai et al. [16] Laborde [17] Lywood et al. [27] Bauen et al. [26] Tipper et al. [2] – marginal Tipper et al. [2] – average Fritsche et al. [25] Soy biodiesel CARB [13] EPA [18] Al-Riffai et al. [16] Laborde [17] Lywood et al. [27] Bauen et al. [26] Tipper et al. [2] – marginal Tipper et al. [2] – average Palm oil biodiesel Al-Riffai et al. [16] Laborde [17] Bauen et al. [26] Tipper et al. [2] – marginal Tipper et al. [2] – average Sunflower biodiesel Al-Riffai et al. [16] Laborde [17]
LUC-related GHG emissions (g CO2e / MJ) ILUC LUC 35 / 34 b,d 36 / 37 g 76 b 15 – 35 a 8b 1b 61 – 140 b 62 37 (12–58) e 50 / 45 b,d 37 / 38 g 303 b 9 – 66 a 17 b 1.5 b 31 / 30 b,d 36 / 37 g 6 – 82 a 29 b 3b 40 / 38 b,d 35 / 35 g
Average for EU biofuels mandate Al-Riffai et al. [16] Laborde [17] Hiederer et al. [20] (IFPRI) Hiederer et al. [20] (IPTS)
12 / 13 b,d 26 / 27 (16-33) g 23 – 27 b 42 – 43 b
Generic second generation biofuels Melillo et al. [19] Case 1 f 190/57/7 Melillo et al. [19] Case 2 f 181/31/1
229/112/26 158/32/13
-53 – 5 a -85 b
Switchgrass ethanol EPA [18] 11 (7 – 18)e Note: Light grey shading refers to market equilibrium models and dark grey to allocation models. For an overview of the models and model specifications, see Supplementary Table 2 and Table 3. CARB: California Air Resources Board; CO2e: carbon dioxide equivalent; EPA – US Environmental Protection Agency; ILUC - indirect land use change; LUC - land use change. a – Bauen et al. [26] present indirect LUC-related emissions only, the ranges are based on the evaluation of different scenarios related to, e.g., yield trends, deforestation rates, and share of peatland. b –LUC-related GHG emissions are presented for an allocation period for land use change emissions of 30 years. Several studies applied allocation periods of 20, 25 or 50 years and are converted here to 30 years to allow comparison of all studies. This is done by multiplying the LUC-related emission factor with the original allocation period and dividing by 30 years. c – Nassar et al. [28] determine marginal LUC-related emissions. d – Al-Riffai et al. [16] determine marginal LUC-related emissions for an additional 106 GJ of biofuel production after the 5.6% EU mandate is reached in 2020. Results for two scenarios are presented in the table: business-as-usual / trade liberalization. Al-Riffai et al. calculate the effect of peatland conversion to be small for all crops, e – EPA [18] determines international and domestic LUC-related emissions. The LUC factor presented here refers to the sum of these two emissions for the scenario for 2022. The range in parentheses refers to the 95% confidence interval of the uncertainty analysis of international LUC-related emissions. EPA [18] presents emissions in kg CO2e/mmBTU. A conversion factor of 1 mmBTU = 1055 MJ is applied. f – Melillo et al. [18] determine the GHG emissions from LUC for two cases for three integration periods. Case 1 refers to the possibility of converting natural areas to meet increased demand for land, while Case 2 meets the demand by intensifying existing managed land [18]. The three values presented here refer to the different integration periods (30/50/100 years). g – Laborde [17] presents results for two scenarios (business-as-usual / trade liberalization). The range given for the average EU biofuels mandate refers to the 95% confidence interval of the uncertainty analysis.
Please cite as: Wicke, Verweij, van Meijl, van Vuuren and Faaij. Indirect land use change: review of existing models and strategies for mitigation. Biofuels (2012) 3(1), 87-100.
CGE
CGE
CGE
PE
Tyner et al. [15]
Al-Riffai et al. [16]
Hiederer et al. [20]
MIRAGE-Biof (updated version of MIRAGE 2007) LEITAP (now called MAGNET)
spatial allocation of LUC: MODIS-4 (2001-2004), GAEZ, GlobCover, GLC2000, McGill M3; LUC-related emissions: IPCC and Carre et al. (2009 in: [20]) (above and belowground biomass carbon stocks), HWSD (soil) Same as in Al-Riffai et al. [16]
GTAP-BIO (March 2010) GTAP-BIO-ADV group 1, Woods Hole b, ratio of marginal and average productivities based on TEM 2, 3 (July 2010) MIRAGE 2007 LUC: MODIS-4 (2001-2004), LUC-related emissions: IPCC
LUC: MODIS V5 (2001-2007) and FAPRI-CARD Brazil module; N2O: DAYCENT/CENTURY; soil carbon emissions: HWSD and DAYCENT/CENTURY; livestock, rice methane and fertilizer emissions, forest sequestration: IPCC a Woods Hole b
Woods Hole a, b
Data and models used to determine GHG emissions Woods Hole a, b TEM
56 billion liters of US corn ethanol use per year US corn ethanol production of 56 billion liters (according to RFS) 5.6% share first generation biofuels in 2020 EU fuel consumption 5.6% share first generation biofuels in 2020 EU fuel consumption 8.5% share biofuels (7% first generation, 1.5% second generation) in 2020 EU fuel consumption EU mandate in accordance with implementation scenarios in NREAPs; 8.6% share biofuels in 2020 EU fuel consumption Effect of obligatory biofuel mandates in the EU, US, Canada, Brazil, Rest of South America, India, and South-East Asia
2015 2015
2020
2020
2020
2020
RFS (EISA of 2007): 36 billion gallons renewable fuels, 15 billion gallons (56 billion liters) corn ethanol
112 billion liters of US corn ethanol use per year Volume that is needed to stabilize atmospheric CO2 concentration at 550 ppmv, not further specified 56 billion liters corn ethanol, 21 million liters sugarcane ethanol, 3 billion liters soy biodiesel
2022
2016 2030, 2050, 2100 2015
Time- Biofuels volume in target year frame
20
20
20
20
30
30
30
30
Allocation period (years) 30 30, 50, 100
16
Please cite as: Wicke, Verweij, van Meijl, van Vuuren and Faaij. Indirect land use change: review of existing models and strategies for mitigation. Biofuels (2012) 3(1), 87-100.
Implementation of agricultural production in the IMAGE 2020 20 model system. IMAGE is an integrated assessment model used for climate change and/or global land use analysis [77]. Note: All market equilibrium models investigate direct and indirect LUC-related GHG emissions combined and cannot disaggregate the results. a - Searchinger et al. [3], CARB [13] and EPA [18] also determine lifecycle emissions of biofuels and fossil fuels. Searchinger et al. [3] and EPA [18] apply the model GREET, CARB [13] applies the GREET model specified for California (CA-GREET). In addition, EPA [18] determines tailpipe CH4 and N2O emissions with MOVES. b - Woods Hole data refers to data on the amount and type of land conversion to cultivation between 1990-99, which was compiled by the Woods Hole Research Center. AGLINK-COSIMO: Recursive dynamic partial equilibrium supply-demand model of world agriculture, developed by OECD in cooperation with OECD member and non-member countries; CARB: California Air Resources Board; CARD: Center for Agricultural and Rural Development; CGE: computable general equilibrium; CH4: methane; CO2: carbon dioxide; DAYCENT/CENTURY: Daily-Century Model; EISA: Energy Independence and Security Act of 2007; EPA: United States Environmental Protection Agency; EPPA: Emissions Predictions and Policy Analysis; recursive dynamic multi-regional computable general equilibrium; FAPRI: Food and Agricultural Policy Research Institute; FAPRI-CARD: Partial equilibrium model combining the FAPRI and CARD models; FASOM: Forestry and Agriculture Sector Optimization Model, partial equilibrium model; GAEZ: Global Agro-Ecological Zones; GHG: Greenhouse gas; GlobCover: global land cover database from the European Space Agency; GLC2000: harmonized global land cover database for 2000 the Global Environment Monitoring Unit from the Joint Research Centre of the European Commission; GREET: Greenhouse Gas, Regulated Emissions, and Energy Use in Transportation model; GTAP: Global
CGE
CGE
Hertel et al. [14]
Banse et al. [37], Prins et al. [38]
AGLINK-COSIMO
PE
EPA [18]
CGE
MIRAGE 2007
CGE
CARB [13]
Laborde [17]
Type Equilibrium model PE FAPRI-CARD CGE EPPA
Searchinger et al. [3] Melillo et al. [19]
GTAP-BIO (Feb 2009), GTAP-SGR (Feb 2009), GTAP-SOY (Jan 2010) FAPRI-CARD, FASOM
Model specifications
Reference
Table 2: Overview of market equilibrium models investigating LUC-related emissions of biofuels and model specifications
Author version, post-acceptance
Allocation based on historical land use change 1995 – 2005 Allocation based on historical land use change Deterministic Causal-descriptive Allocation model based on cause-effect chains
Simple ex-post model combining historical data with assumptions
Lywood et al. [27] Tipper et al. [2] Fritsche et al. [25] Bauen et al. [26] Nassar et al. [28]
Overmars et al. [29]
2007
1995 - 2005 2000 - 2005 2005 - 2030 2020 2005 - 2008
Timeframe
Current volume Current volume 2005: current volume, 2010 – 2030: not defined Biofuel demand in Europe and US, scenario dependent Sugarcane ethanol production increase from 16 to 27 billion liters per year Current share in EU fuel consumption
Biofuels volume in target year
20 / 50
Allocation period (years) 25 25 20 30 30
I
LUC (D – direct, I – indirect) D+I D+I I I D+I
Please cite as: Wicke, Verweij, van Meijl, van Vuuren and Faaij. Indirect land use change: review of existing models and strategies for mitigation. Biofuels (2012) 3(1), 87-100.
Netherlands Environmental Assessment Agency. Integrated Modelling of Global Environmental Change. An Overview of IMAGE 2.4. Netherlands Environmental Assessment Agency, Bilthoven, The Netherlands (2006).
Please see the main article for details of all references except:
References
Model specifications
Reference
Table A3: Overview of allocation models investigating LUC-related emissions of biofuels and model specifications
77
17
Trade Analysis Project; GTAP-BIO/BIO-ADV: GTAP model and database that have been extended to improve the treatment of biofuels, their by-products and land use: GTAP-BIO and GTAP-BIO-ADV are used to investigate corn ethanol; GTAP-SOY: GTAP model and database extended for soybean biodiesel; GTAP-SGR: GTAP model and database extended for sugarcane ethanol; HWSD: Harmonized World Soil Database; IMAGE: Integrated Model to Assess the Global Environment; an ecological-environmental modeling framework that simulates the environmental consequences of human activities worldwide developed at the Netherlands Environmental Assessment Agency; IPCC: Intergovernmental Panel on Climate Change; LUC: land use change; McGill M3: Madison-McGill-Minnesota datasets of global crops, cropland and pasture; MIRAGE: Modeling International Relationships in Applied General Equilibrium, CGE model; MIRAGE-Biof: Modeling International Relationships in Applied General Equilibrium for Biofuel analysis; MODIS: Moderate Resolution Imaging Spectroradiometer; MOVES: Motor Vehicle Emissions Simulator; NREAP: National Renewable Energy Action Plans; N2O: Nitrous oxide; PE: Partial equilibrium model; RFS: Renewable Fuel Standard in the US Energy Independence and Security Act of 2007; TEM: Terrestrial Ecosystem Model; US: United States.
Author version, post-acceptance