bioRxiv preprint first posted online Oct. 4, 2017; doi: http://dx.doi.org/10.1101/197582. The copyright holder for this preprint (which was not peer-reviewed) is the author/funder. It is made available under a CC-BY-NC-ND 4.0 International license.
Individual differences in locomotor function predict the capacity to reduce asymmetry and modify the energetic cost of walking poststroke Natalia Sánchez, Ph.D.1 and James M. Finley, Ph.D.1,2,3 1Division
of Biokinesiology and Physical Therapy, University of Southern California, Los Angeles, CA, 90033
2Department
of Biomedical Engineering, University of Southern California, Los Angeles,
CA, 90089 3Neuroscience
Graduate Program, University of Southern California, Los Angeles, CA,
90089
Author Email Addresses: Natalia Sanchez, Ph.D.
[email protected]
*James M. Finley, Ph.D.
[email protected]
*Corresponding author
Mailing Address for All Authors: University of Southern California, Division of Biokinesiology and Physical Therapy 1540 E. Alcazar St, CHP 155 Los Angeles, CA, USA 90033
Word Count: Abstract: 250 Main Text: 4051 Tables: 3 Figures: 3
bioRxiv preprint first posted online Oct. 4, 2017; doi: http://dx.doi.org/10.1101/197582. The copyright holder for this preprint (which was not peer-reviewed) is the author/funder. It is made available under a CC-BY-NC-ND 4.0 International license.
Abstract Changes in the control of the lower extremities post-stroke lead to persistent biomechanical asymmetries during walking. These asymmetries are associated with an increase in energetic cost, leading to the possibility that reduction of asymmetry can improve economy. However, the influence of asymmetry on economy may depend on the direction and cause of asymmetry. For example, impairments with paretic limb advancement may result in shorter paretic steps while deficits in paretic support or propulsion result in shorter non-paretic steps. Given differences in the underlying impairments responsible for each type of step length asymmetry, the capacity to reduce asymmetry, and the associated changes in energetic cost may not be consistent across this population. Here, we identified factors explaining individual differences in the capacity to voluntarily reduce step length asymmetry and modify energetic cost during walking. Twenty-four individuals post-stroke walked on a treadmill with visual feedback of their step lengths to aid explicit modification of asymmetry. We found that individuals who naturally took longer paretic steps had a greater capacity to reduce asymmetry, and were better able to transfer the effects of training to over-ground walking. In addition, baseline energetic cost was negatively correlated with reductions in cost, such that participants with a more economical gait were more likely to reduce energetic cost by improving symmetry. These results demonstrate that many stroke survivors retain the capacity to voluntarily walk more symmetrically on a treadmill and overground. However, whether reductions in asymmetry reduce metabolic cost depends on individual differences in impairments affecting locomotor function.
bioRxiv preprint first posted online Oct. 4, 2017; doi: http://dx.doi.org/10.1101/197582. The copyright holder for this preprint (which was not peer-reviewed) is the author/funder. It is made available under a CC-BY-NC-ND 4.0 International license.
Introduction One of the major goals of post-stroke rehabilitation is to improve walking ability1,2. Poststroke changes in lower extremity function lead to persistent biomechanical abnormalities during walking including but not limited to decreased paretic stance time3, and asymmetric step lengths4–7. Previous research has shown positive associations between spatiotemporal asymmetries and the metabolic cost of walking8–10, and in people post-stroke, this increased cost may be due in part to sub-optimal coordination of leading limb contact and trailing limb push-off forces10,11. Therefore, it is possible that reducing asymmetry may reduce the metabolic burden of walking post-stroke. Alternatively, people post-stroke may naturally adopt asymmetric walking patterns because this strategy is energetically optimal given their level of impairment. However, these possibilities have yet to be systematically investigated. Due to heterogeneity in the types of motor impairments that occur post-stroke, the direction and magnitude of step length asymmetry are not uniform across the entire post-stroke population. Whereas most individuals shorten stance time and increase swing time on the paretic side3,12,13, the direction of the spatial asymmetry is highly heterogeneous5,14,15. Reductions in paretic propulsion5,14 and hip extension16 manifest as shorter non-paretic steps while dominant impairments with paretic limb advancement5,17 may result in shorter paretic steps. Given the differences in the mechanisms underlying each type of asymmetry, the capacity to reduce asymmetry may not be consistent across the entire post-stroke population. Moreover, these differential impairments may influence how metabolic cost changes in response to reductions in asymmetry: individuals with shorter non-paretic steps may only need to increase paretic stance duration18 whereas individuals with shorter paretic steps may rely on strategies such as hip hiking and circumduction to advance the paretic limb, which could increase metabolic cost19–23 . Here, we sought to determine: 1) the factors that predict whether people post-stroke retain the capacity to reduce step length asymmetry, 2 voluntarily) how changes in asymmetry impact metabolic cost and 3) whether voluntary attempts to reduce asymmetry during treadmill walking transfer to over-ground walking. We addressed these aims through the use of a single session, biofeedback-based, treadmill training paradigm which enabled participants to reduce step length asymmetry explicitly. We hypothesized that the baseline direction of asymmetry will influence the capacity to reduce asymmetry voluntarily and that reductions in asymmetry would be correlated with reductions metabolic cost. We also hypothesized that the direction of the
bioRxiv preprint first posted online Oct. 4, 2017; doi: http://dx.doi.org/10.1101/197582. The copyright holder for this preprint (which was not peer-reviewed) is the author/funder. It is made available under a CC-BY-NC-ND 4.0 International license.
baseline asymmetry would influence how well reductions in asymmetry transfer to over-ground walking. Ultimately, a better understanding of how motor impairments influence the ability to reduce asymmetry can facilitate the design of personalized interventions to improve locomotor function post-stroke.
Methods Twenty-four chronic stroke survivors (Table 1) participated in this study. Study inclusion criteria were: 1) chronic hemiparesis (time since stroke > 6 months) due to a single stroke, 2) ability to walk on the treadmill continuously for five minutes, 3) ability to walk over-ground independently or with use of a cane, 4) no concurrent neurological disorders or orthopedic conditions that interfered with their ability to walk, and 5) the ability to provide informed consent. Consistent with previous studies24,25, participants were instructed to lightly touch a handrail placed in front of them to aid balance and prevent drift on the treadmill. All procedures conformed to the principles set forth in the Declaration of Helsinki and were approved by the University of Southern California’s Institutional Review Board.
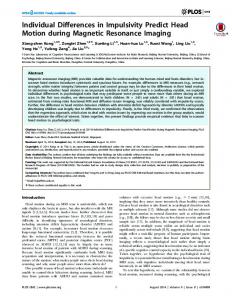
Experimental Protocol The full protocol consisted of a set of clinical assessments and a combination of trials over-ground and on the treadmill (Figure 1). The lower extremity portion of the Fugl-Meyer Assessment26 was performed to assess lower extremity motor impairment. Initial evaluation of walking function was done using the 6-minute walk test. The experiment began with 4-6 passes of over-ground walking over a 10m walkway at each participant’s self-selected speed (OG BASE), and this was followed by a treadmill familiarization trial. During all treadmill trials, participants wore a harness to prevent falls, without providing any body weight support. During this trial, the speed of the treadmill was gradually adjusted using the staircase method27 until participants achieved their comfortable walking speed. In the final minute of this five-minute trial, we introduced the visual feedback and participants practiced matching step length targets for one minute. They subsequently completed a 5-minute walking trial on the treadmill (BASELINE) where we measured their baseline metabolic cost and step lengths. After BASELINE, participants walked for five minutes with feedback of their natural step lengths (BASELINE+FBK) to measure any potential changes in spatiotemporal control or metabolic cost due to the accurate foot placement requirements. For the subsequent SYMMETRY trial, participants were instructed to walk with equal step lengths, by lengthening their shorter step to match their longer step. Lastly, participants transitioned to walking over-ground to assess
bioRxiv preprint first posted online Oct. 4, 2017; doi: http://dx.doi.org/10.1101/197582. The copyright holder for this preprint (which was not peer-reviewed) is the author/funder. It is made available under a CC-BY-NC-ND 4.0 International license.
transfer (OG POST). Sitting breaks of at least five minutes were provided between all trials, and blood pressure and heart rate were measured for safety and to ensure that resting conditions were achieved before beginning the next trial. Participants were provided with visual feedback of their step lengths via a display that was controlled by custom software written in Vizard (Worldviz, Santa Barbara, CA). The visual feedback consisted of two vertical bars specifying the desired length of their right and left steps. The real-time location of markers placed on their ankles was projected onto the vertical bars. Participants were instructed to walk such that the position of the ankle marker coincided with the top of the bars on the corresponding side at foot strike. Points were awarded to participants as follows (rounded to the nearest integer): 𝑆𝑆𝑆𝑆𝑆𝑆𝑆𝑆𝑆𝑆 = 10 − 10 ∗ 𝑎𝑎𝑎𝑎𝑎𝑎 �1 −
𝑆𝑆𝑆𝑆𝑆𝑆𝑆𝑆𝑆𝑆𝑆𝑆𝑆𝑆𝑆𝑆𝑆𝑆ℎ
𝑇𝑇𝑇𝑇𝑇𝑇𝑇𝑇𝑇𝑇𝑇𝑇𝑇𝑇𝑇𝑇𝑇𝑇𝑇𝑇𝑇𝑇𝑇𝑇𝑇𝑇𝑇𝑇𝑇𝑇ℎ
�.
(1)
This formula was used to provide a score that varied systematically with the error between the desired and actual step length. Participants were verbally encouraged to obtain 10 points for every step on each side.
Data Acquisition Kinematic data Kinematic data for passive markers placed bilaterally on the lateral malleoli and greater trochanters were collected using a 10 camera Qualisys Oqus system (QTM, Sweden). Foot strike and lift-off were estimated from peak anterior and posterior lateral malleoli excursions, respectively28. Metabolic cost Metabolic cost was assessed using expired gas analysis. Expired gas was sampled on a breath-by-breath basis, and the rate of O2 and CO2production were measured using a TrueOne® 2400 system (Parvomedics, UT). Substrate utilization during the experiment was determined using the Respiratory Exchange Ratio (RER), which is the ratio of carbon dioxide produced to the oxygen consumed. Metabolic power was assessed using a standard equation29. The average metabolic power from a standing baseline trial collected before the waking trials was subtracted from measurements made during all subsequent walking periods to yield net metabolic power. Metabolic data were supplemented with self-reported Ratings of Perceived Exertion (RPE)30, which were collected after each trial in 18 of 24 participants.
bioRxiv preprint first posted online Oct. 4, 2017; doi: http://dx.doi.org/10.1101/197582. The copyright holder for this preprint (which was not peer-reviewed) is the author/funder. It is made available under a CC-BY-NC-ND 4.0 International license.
Data Processing and Analysis Step length asymmetry Individual step lengths were defined as the fore-aft distance between the lateral malleoli at the time of the respective limb’s footstrike7,25,31. We characterized step length asymmetry using the magnitude of the difference in step lengths (|SLDiff|), defined as the non-paretic step length minus the paretic step length, and the direction of this difference, such that -1 indicated a longer paretic step and 1 indicates a shorter paretic step. Average values of SLDiff were obtained for the last two minutes of walking from the five-minute trials. Spatial and temporal contributions to step length asymmetry We also expressed SLDiff as the sum of spatial and temporal contributions to step length asymmetry, as previous work has shown that the variance in the metabolic cost of walking poststroke can be partially explained by differences in paretic and non-paretic foot placement relative to the body (step position contribution, Equation 3)8: 𝑆𝑆𝑆𝑆𝐷𝐷𝐷𝐷𝐷𝐷𝐷𝐷 = �∝𝑛𝑛𝑛𝑛 −∝𝑝𝑝 � +
𝑣𝑣𝑝𝑝 + 𝑣𝑣𝑛𝑛𝑛𝑛
𝑆𝑆𝑆𝑆𝑆𝑆𝑆𝑆𝑆𝑆𝑆𝑆𝑆𝑆𝑆𝑆𝑆𝑆𝑆𝑆𝑆𝑆𝑆𝑆 = ∝𝑛𝑛𝑛𝑛 −∝𝑝𝑝 𝑆𝑆𝑆𝑆𝑆𝑆𝑆𝑆𝑆𝑆𝑆𝑆𝑆𝑆𝑆𝑆 =
𝑣𝑣𝑝𝑝 + 𝑣𝑣𝑛𝑛𝑛𝑛
𝑆𝑆𝑆𝑆𝑆𝑆𝑆𝑆𝑆𝑆𝑆𝑆𝑆𝑆𝑆𝑆𝑆𝑆𝑆𝑆𝑆𝑆𝑆𝑆 =
2
2
∗ �𝑡𝑡𝑝𝑝 − 𝑡𝑡𝑛𝑛𝑛𝑛 � +
∗ �𝑡𝑡𝑝𝑝 − 𝑡𝑡𝑛𝑛𝑛𝑛 �
�𝑡𝑡𝑝𝑝 +𝑡𝑡𝑛𝑛𝑛𝑛 � 2
∗ �𝑣𝑣𝑝𝑝 − 𝑣𝑣𝑛𝑛𝑛𝑛 �
�𝑡𝑡𝑝𝑝 +𝑡𝑡𝑛𝑛𝑛𝑛 � 2
∗ �𝑣𝑣𝑝𝑝 − 𝑣𝑣𝑛𝑛𝑛𝑛 � (2)
(3)
(4) (5)
Here, αnp is a spatial variable indicating the difference in how far the non-paretic foot is placed in front of the body relative to the previous paretic foot placement, and αp indicates the difference in how far the paretic foot is placed in front of the body relative to the previous non-paretic foot placement. vnp and vp are the speed of the body relative to the non-paretic and paretic foot during stance. tnp and tp are the non-paretic and paretic step times where tnp it is the time from non-paretic foot strike to paretic foot strike and vice versa for tp. A detailed derivation of these equations can be found elsewhere7. Average values for each variable were calculated for the last two minutes in each trial. Cost of Transport The net metabolic power and RER corresponding to BASELINE, BASELINE+FBK and SYMMETRY were calculated from the averages during the last two steady-state minutes of each trial, consistent with the period over which spatiotemporal variables were analyzed. All
bioRxiv preprint first posted online Oct. 4, 2017; doi: http://dx.doi.org/10.1101/197582. The copyright holder for this preprint (which was not peer-reviewed) is the author/funder. It is made available under a CC-BY-NC-ND 4.0 International license.
measures of metabolic power were normalized by body mass and treadmill speed to obtain the net metabolic cost of transport (CoT), expressed in J/kg*m. Statistical analyses All statistical analyses were performed in Matlab R2016b (Mathworks, Natick, MA, USA). Data were tested for normality using the Kolmogorov-Smirnov test. If the data satisfied the normality test, repeated measures analyses of variance (RM-ANOVA) were implemented to test whether the values of the following variables differed across trials: |SLDiff|, step lengths, stance duration, swing duration, stride length, cadence, position, time and velocity contributions to SLDiff, CoT, RER, and RPE. The direction of the asymmetry was defined as a between-subjects effect in the repeated measures analyses. If data did not satisfy the normality requirement, repeated measures analyses were implemented using either the Wilcoxon sign rank test for paired data or the Friedman test. We verified that data satisfied the sphericity assumption using the Mauchly test. If the sphericity assumption was not satisfied, we used the Huyn-Feldt corrected p-value. Post-hoc comparisons were performed using the Tukey-Kramer correction for multiple comparisons. The significance level was set at p=0.05. Regression analyses We used robust regression to fit linear models relating participant-specific modifications in asymmetry or modifications in metabolic cost and spatiotemporal variables characterizing each participant’s walking pattern. We explored whether the dependent variables, change in asymmetry magnitude (∆SLDiff) and change in CoT (∆CoT) during SYMMETRY relative to BASELINE+FBK were associated with the following independent variables: magnitude of baseline SLdiff, step position, step time, and step velocity contributions to SLDiff, and baseline asymmetry direction (AsymPositive). AsymPositive is a binary variable that takes a value of 1 if the asymmetry is positive (shorter paretic steps) and 0 if the asymmetry is negative (longer paretic steps). For each regression analysis, we first calculated variance inflation factors (VIF) to determine the candidate variables considered for inclusion in the model. If the VIF for a given variable was greater than 4, the variable was removed from the model to avoid multicollinearity. Once the set of candidate variables for each model were determined, all possible models with combinations of an intercept, linear combinations of the dependent variables, and two-way interactions between the independent variables were fit in Matlab using robust linear regression. The model with the lowest Akaike Information Criterion32 (AIC) was then selected as the best-fit
bioRxiv preprint first posted online Oct. 4, 2017; doi: http://dx.doi.org/10.1101/197582. The copyright holder for this preprint (which was not peer-reviewed) is the author/funder. It is made available under a CC-BY-NC-ND 4.0 International license.
model, and the quality of the model’s fit to the data was determined using a leave-one-out cross-validation (LOOCV) approach for computing R2.
Results Effects of augmented visual feedback on spatiotemporal variables and CoT We first determined whether the provision of visual feedback during BASELINE+FBK had an effect on any spatiotemporal variables relative to BASELINE. We observed a significant main effect of trial type on |SLDiff| (RM-ANOVA, F2,44=10.44, p