16 th. January 2014 ... 13. 2.2. The Proficiency response strand. 14. 2.3. Politzer 1978. 15 ... 2.15.3 Analysing the data from a group or individual perspective. 74 ..... in those still at the early stages of competency such as native children and ...... A word such as cup for example would probably be known by nearly all low-level.
Individual profiling of second language learners through word association
George Michael Higginbotham
A thesis submitted to Swansea University in fulfilment of the requirements for the degree of Philosophiae Doctor
2014
Abstract This thesis explores the organisation of second language learners’ mental lexicons through the use of word association tests; a reliable measure of which would complement established measures of lexicon size. Following studies with native speakers (Russell & Jenkins, 1954; Ervin, 1961), research with second language learners began in the late 1950’s (Lambert, 1956) although much of the methodology and theory had been developed decades before by clinical psychologists (Jung, 1918). Unlike the L1 studies, the L2 studies have been plagued by inconsistent findings, leading some to conclude that the use of word associations to assess L2 learners is unfeasible (Kruse et al., 1987). In an attempt to realise the potential that word association tests have as a method of measuring the organisation of learner lexicons, a series of experiments was conducted. The initial experiment was a replication of Wolter (2001) using a traditional classification system. This was followed by five more experiments that centred around a quite different methodology and approach to data analysis put forward by Fitzpatrick (2006; 2007). The reliability of Fitzpatrick’s individual profiling approach was tested using various kinds of stimulus words. The results indicate that the word class and frequency of the stimuli have little effect on the reliability of the response profiles generated. Improvements to the methodology and issues that arose during the experiments are discussed. The experiments were all conducted in Japan, with college aged learners between early 2007 and mid-2012. In that six year period, over 20,000 responses were elicited from 213 learners involved in the pilot tests and main experiments.
ii
DECLARATION This work has not previously been accepted in substance for any degree and is not currently being submitted in candidature for any degree.
STATEMENT 1 This thesis is the result of my own investigation except where otherwise stated. Other sources are acknowledged by explicit references. A bibliography is appended.
STATEMENT 2 I hereby give consent for my thesis, to be available for photocopying and for interlibrary loan and for the title and summary to be made available to outside organisations.
SIGNED
DATE
16th January 2014
iii
Acknowledgements While working on this thesis I sometimes felt like a child walking through a field of tall grass, although I usually had a sense that I was moving forward I was not always sure where I was headed or even how far I had come. Clambering up the findings of other researchers allowed me to see a little further and get my bearings, although it was mainly the advice, assistance and occasional push from my seniors that kept me moving in the right direction. Fortunately I had experienced guides to help me out when I needed it. My thanks therefore first of all go to my supervisor Professor Paul Meara, for his patience and perspicacity throughout the preparation of this work. While allowing me the freedom to make mistakes, his depth of knowledge and enthusiasm for research into vocabulary acquisition meant that I didn’t stray too far, and in the process learned a lot. Conversations and emails with members of the Swansea University VARG network, many of whom took considerable time to discuss and refine my arguments, were also valuable. In particular, Professor Tess Fitzpatrick and Dr. Ian Munby deserve a special mention for reading and advising on early drafts of chapters in this thesis. For access to the learners that were used in the pilot tests and main experiments I needed to rely on colleagues in neighbouring universities. I therefore owe a debt of gratitude to Dr. Jim Ronald, Dr. Monika Szirmai, Katherine Song, Muneo Hotta, and of course their students, all of whom gave up their time in helping me collect the data. Last but not least, I am deeply appreciative of my family, especially my wife, for all the encouragement over the years. Without a supportive family I would have achieved little, and it is therefore to my family that I dedicate this thesis.
iv
Table of Contents Abstract
ii
Acknowledgements
iv
List of Tables
xii
List of Figures
xiii
Chapter One: Introduction, Background, and Overview 1.1
Introduction
1
1.2
What is the mental lexicon?
1
1.3
What is a word association test?
4
1.4
The history of word association testing
7
1.5
Overview of the thesis
12
Chapter Two: Literature Review 2.1
Introduction
13
2.2
The Proficiency response strand
14
2.3
Politzer 1978
15
2.3.1
Summary
15
2.3.2
Critique
17
2.4
Kruse, Pankhurst & Sharwood-Smith 1987
19
2.4.1
Summary
19
2.4.2
Critique
21
2.5
Söderman 1993b
24
2.5.1
Summary
24
2.5.2
Critique
26
2.6
Schmitt 1998a
28
2.6.1
Summary
28
2.6.2
Critique
30
2.7
Orita 2002
34
2.7.1
Summary
34
v
2.7.2
Critique
35
2.8
Henriksen 2008
37
2.8.1
Summary
37
2.8.2
Critique
41
2.9
Type response strand
45
2.10
Sökmen 1993
46
2.10.1 Summary
46
2.10.2 Critique
48
2.11
51
Wolter 2001
2.11.1 Summary
51
2.11.2 Critique
54
2.12
57
Bagger-Nissen & Henriksen 2006
2.12.1 Summary
57
2.12.2 Critique
58
2.13
61
Fitzpatrick 2007
2.13.1 Summary
61
2.13.2 Critique
62
2.14
66
Zareva 2011
2.14.1 Summary
66
2.14.2 Critique
68
2.15
71
Discussion
2.15.1 Classification
71
2.15.2 The quantity and quality of stimulus words
73
2.15.3 Analysing the data from a group or individual perspective
74
2.15.4 Complexity of experiments
75
2.16
77
Conclusions
Chapter Three: A replication study of Wolter 2001 3.1
Introduction
79
3.2
Outline of this study
82
3.3
The replication study
82
vi
3.3.1
Participants
83
3.3.2
Classification of data
84
3.4
Results
85
3.4.1
Comparisons of general response data
86
3.4.2
Comparisons of response data at each level of word familiarity
88
3.4.3
Summary of results
94
3.5
Discussion
95
3.5.1
Similar findings
95
3.5.2
Conflicting findings
97
3.6
Conclusions
101
Chapter Four: Exploring individual learner profiles through word association tests. 4.1
Introduction
102
4.2
Overview of the study
103
4.3
Research questions
103
4.4
Participants
104
4.5
Materials
104
4.5.1
Stimulus word lists
104
4.5.2
Classification
105
4.6
Results
106
4.6.1
The completion rates of the prompt word lists.
106
4.6.2
General trends in the group.
107
4.6.3
Individual profiles: example case studies.
109
4.6.4
Profile proximity ranking
114
4.6.5
Analysis of individuals’ dominant categories
115
4.7
Discussion
116
4.7.1
The frequency effect
116
4.7.2
The word class effect
117
4.7.3
Filtering unhelpful prompt words
117
4.8
Conclusions
119
vii
Chapter Five: Revisiting the effect of word frequency 5.1
Introduction and overview of the study
120
5.2
Research questions
120
5.3
Participants
121
5.4
Materials
121
5.4.1
Stimulus word lists
121
5.4.2
Classification
122
5.5
Results
122
5.5.1
Completion rates of PWL1 and PWL2
123
5.5.2
General trends in the group
123
5.5.3
Focusing on individuals
124
5.5.4
Individual profiles: five case studies
126
5.5.5
The accuracy of intuitions
130
5.6
Discussion
131
5.6.1
Word class
131
5.6.2
Improving the methodology
132
5.6.3
Learner background effect
134
5.7
Conclusions
136
Chapter Six: The effect of verb stimuli 6.1
Introduction
137
6.2
Outline of the study
138
6.3
Research questions
139
6.4
Participants
139
6.5
Stimulus word lists
139
6.6
Results
140
6.6.1
Completion rates of PWL1 and PWL2
140
6.6.2
General response trends
141
6.6.3
Focusing on individual profiles: four case studies
145
6.7
Discussion
147
6.7.1
Why so many xy collocations?
147
viii
6.7.2
Why did one student make such disparate responses?
149
6.7.3
Comparing the noun and verb studies
150
6.7.4
Implications of a word class effect
151
6.8
Conclusions
152
Chapter Seven: The effect of adjective stimuli 7.1
Introduction
154
7.2
Outline of the study
155
7.3
Participants
156
7.4
Research questions
157
7.5
The pilot study
157
7.6
Stimulus word lists
158
7.7
Results
159
7.7.1
Completion rates of PWL1 and PWL2
159
7.7.2
General trends in the group
160
7.7.3
The proximity of individual profiles
161
7.8
Discussion
162
7.8.1
Individual profiles: four case studies
162
7.8.2
The value of native norms lists
168
7.8.3
How typical were the adjectives in this study?
170
7.9
Summary
171
7.10
Conclusions
172
Chapter Eight: And then there was one 8.1
Introduction
174
8.2
The participant
176
8.3
Outline of the study
177
8.4
Research questions
179
8.5
Results
179
8.5.1
General response trends
179
8.5.2
Comparing profiles in the initial and follow up word association tests
185
ix
8.5.3
Changes in responses to specific words
189
8.5.4
Think aloud data
189
8.6
Discussion
190
8.6.1
Responding to questions raised by this study
191
8.6.2
Rethinking the think-aloud procedure
194
8.6.3
Intervals between testing
195
8.7
Summary
195
8.8
Conclusions
196
Chapter Nine: General discussion 9.1
Introduction
198
9.2
General review of findings
198
9.3
Why are profiles internally reliable?
206
9.4
Creating stimulus lists
207
9.5
Classification problems
214
9.6
Automaticity of responses
219
9.7
Pedagogical applications
220
9.8
Summary of General Discussion
223
Chapter Ten: Conclusions
226
Bibliography
227
Appendices Appendix 3.1 Prompt Word List 1: used in replication study
234
Appendix 3.2 Prompt Word List 2: used in replication study
235
Appendix 3.3 Statistical analysis of data in the replication study
236
Appendix 4.1 Prompt Word List 1: used in Noun 1 study
237
Appendix 4.2 Prompt Word List 2: used in Noun 1 study
238
Appendix 4.3 Fitzpatrick’s 2007 Classification System
239
Appendix 4.4 Chi-square matrix for 9 randomly selected profiles: Noun 1
240
x
Appendix 4.5 A note on calculating profile similarity
241
Appendix 5.1 Prompt Word List 2: used in Noun 2 study
243
Appendix 5.2 Chi-square matrix for 9 randomly selected profiles: Noun 2
244
Appendix 6.1 Prompt Word List 1: used in Verb study
245
Appendix 6.2 Prompt Word List 2: used in Verb study
246
Appendix 7.1 Prompt Word List 1: used in Adjective study
247
Appendix 7.2 Prompt Word List 2: used in Adjective study
248
Appendix 7.3 Adjectives rejected after 1st pilot study
249
Appendix 7.4 Adjectives rejected after 2nd pilot study
250
xi
List of Tables Table 1.1 Problems in using word association tests with L2 learners (Meara, 1983)
10
Table 2.1 Correlations between L2 responses and language tests (Politzer, 1978)
16
Table 2.2 Mean scores, SDs, and theoretical maximum scoring (Kruse et al., 1987)
20
Table 2.3 Reliability coefficients on two test sessions (Kruse et al., 1987)
21
Table 2.4 Correlations between association and proficiency (Kruse et al., 1987)
21
Table 2.5 An L1/L2 comparison of five stimulus words used in Kruse et al. (1987)
23
Table 2.6 The number of each stimulus type (Orita, 2002)
35
Table 2.7 The categorisation and scoring system (Henriksen, 2008)
39
Table 2.8 Results of two measures of declarative lexical knowledge (Henriksen,
40
2008) Table 2.9 Classification by word class categories (Sökmen, 1993)
47
Table 2.10 Responses to two 45 item word association tests in L1 and L2 (Bagger-
58
Nissen & Henriksen, 2006) Table 2.11 Native norms for 12 stimuli used in Bagger-Nissen & Henriksen (2006)
60
Table 2.12 Comparison of classification categories used in Fitzpatrick 2006 &
63
2007 Table 2.13 Difficult to classify responses
65
Table 2.14 The quantity and quality of stimuli used in 11 word association studies
73
Table 3.1 The Vocabulary Knowledge Scale assessment card (Wolter 2001:54)
85
Table 3.2 Correlations between the percentage of responses in Wolter (2001) and
88
the replication study Table 4.1 Prompt word list completion rates for those accepted in the study
106
Table 4.2 Proximity rankings
114
Table 4.3 Dominant Pair Categories
115
Table 5.1 Proximity rankings in the Noun 1 and Noun 2 studies.
126
Table 6.1 Mean scores on the vocabulary test
139
Table 6.2 Usable responses for the Verb study
141
Table 6.3 Proximity rankings for the Verb study
144
Table 6.4 Proximity rankings in the Noun 2 (2008) and Verb (2009) studies
151
Table 6.5 Percentage of lemmas in each word class: source BNC
152
xii
Table 7.1 Mean VLT scores for the Adjective study
156
Table 7.2 Items rejected following within group analysis
159
Table 7.3 Completion rates for responses to PWL1 and PWL2
159
Table 7.4 Proximity ranking for adjective profiles
162
Table 7.5 Criteria for classifying the native-norms list predictions
168
Table 8.1 VLT scores before and after the word association tests
177
Table 8.2 The number of responses sampled from each sub-test
180
Table 8.3 The percentage of dominant responses to noun stimuli
183
Table 8.4 The percentage of dominant responses to verb stimuli
184
Table 8.5 The percentage of dominant responses to adjective stimuli
184
Table 8.6 The percentage of ‘same’ responses
189
Table 9.1 Mean Proportion of paradigmatic responses (Piper & Leicester, 1980)
202
Table 9.2 Proximity rankings for profiles in three word class studies
204
Table 9.3 Random samplings of M’s responses (2012)
213
Table 9.4 Number of categories at each rank from 60 randomly selected profiles
217
Table 9.5 The number of M’s responses to Adjective stimuli (2012 WAT)
217
Table 11.1 A comparison of two metrics: Pearson Correlations and Euclidean Distance
242
List of Figures Fig 2.1 The depth of individual word knowledge model (Wolter, 2001:48)
52
Fig 3.1 The depth of individual word knowledge model (Wolter, 2001:48)
81
Fig 3.2 The Word Knowledge Continuum, (Namei, 2004:382)
81
Fig 3.3a Percentage of NNS and NS response types for PWL1 (Wolter, 2001)
86
Fig 3.3b Percentage of NNS and NS response types for PWL1 (GH07)
86
Fig 3.4a Percentage of NS response types for PWL1 and PWL2 (Wolter, 2001)
87
Fig 3.4b Percentage of NS response types for PWL1 and PWL2 (GH07)
88
Fig 3.5a Percentage of NNS and NS response types for prompt words that elicited
89
a VKS score of 1 (Wolter, 2001) Fig 3.5b Percentage of NNS and NS response types for prompt words that elicited
89
a VKS score of 1 (GH07) Fig 3.6a Percentage of NNS and NS response types for prompt words that elicited
xiii
90
a VKS score of 2 (Wolter, 2001) Fig 3.6b Percentage of NNS and NS response types for prompt words that elicited
90
a VKS score of 2 (GH07) Fig 3.7a Percentage of NNS and NS response types for prompt words that elicited
91
a VKS score of 3 (Wolter, 2001) Fig 3.7b Percentage of NNS and NS response types for prompt words that elicited
91
a VKS score of 3 (GH07) Fig 3.8a Percentage of NNS and NS response types for prompt words that elicited
92
a VKS score of 4 (Wolter, 2001) Fig 3.8b Percentage of NNS and NS response types for prompt words that elicited
92
a VKS score of 4 (GH07) Fig 3.9a Percentage of NNS and NS response types for prompt words that elicited
93
a VKS score of 5 (Wolter, 2001) Fig 3.9b Percentage of NNS and NS response types for prompt words that elicited
93
a VKS score of 5 (GH07) Fig 4.1 Responses in main categories
107
Fig 4.2 Responses classified by main categories: Student 1
108
Fig 4.3 Responses classified by subcategories: Student 1
109
Fig 4.4 Responses classified by subcategories: Student 2
111
Fig 4.5: Responses classified by subcategories: Student 3
111
Fig 4.6: Responses classified by subcategories: Student 4
112
Fig 4.7: Responses classified by subcategories: Student 5
113
Fig 5.1 General group trends between the two noun studies: main categories
123
Fig 5.2 General group trends between the two noun studies: subcategories
124
Fig 5.3 Correlations between profiles for 30 students in the Noun 2 study
125
Fig 5.4 Dissimilar student profiles
126
Fig 5.5 Vaguely similar student profiles
127
Fig 5.6 Close student profiles
128
Fig 5.7 Very close student profiles - a
129
Fig 5.8 Very close student profiles - b
129
Fig 5.9 The effect of randomly redistributing 11% of responses
134
xiv
Fig 6.1. A comparison of general (main category) response trends in the Verb and
142
Noun 2 studies Fig 6.2. A comparison of general (subcategory) response trends in the Verb and
143
Noun 2 studies Fig 6.3 Correlations between profiles for students in the Verb study
144
Fig 6.4 Dissimilar profiles.
145
Fig 6.5 Vaguely similar profiles
146
Fig 6.6 Close profiles
146
Fig 6.6 Very close profiles
147
Fig 7.1 General trends for adjective responses: main categories
160
Fig 7.2 General trends for adjective responses: subcategories
161
Fig 7.3 Correlations between PWL1 and PWL2 in the Adjective study
163
Fig 7.4 Dissimilar profiles
164
Fig 7.5 Vaguely Similar Profiles
164
Fig 7.6 Close profiles
165
Fig 7.7 Very close profiles
165
Fig 7.8 Predictions from L1 norms lists
169
Fig 8.1 Combined responses to the initial word association tests and the retests
181
Fig 8.2 Responses to noun stimuli
182
Fig 8.3 Responses to verb stimuli
182
Fig 8.4 Responses to adjective stimuli
183
Fig 8.5 Responses to high frequency nouns in 2009 and 2012
186
Fig 8.6 Responses to low frequency nouns in 2009 and 2012
186
Fig 8.7 Responses to high frequency verbs in 2010 and 2012
187
Fig 8.8 Responses to low frequency verbs in 2010 and 2012
187
Fig 8.9 Responses to high frequency adjectives in 2011 and 2012
188
Fig 8.10 Responses to low frequency adjectives in 2011 and 2012
188
Fig 9.1 Responses to stimuli from three word classes: subcategories
200
Fig 9.2 Responses to stimuli from three word classes: main categories
202
Fig 9.3 An alternative way to present the stimuli
211
Fig 11.1 Four hypothetical profiles.
241
xv
Chapter One: Introduction, Background, and Overview
1.1 Introduction As Aitchison’s (1987) aptly titled and entertaining introduction to the field states, psycholinguistics is concerned with “words in the mind”. Its theoretical and methodological roots stem from two long established areas of research: psychology and linguistics. In this chapter, I will begin with an explanation of two constructs, the mental lexicon and word association that are fundamental to this thesis. This will be followed by a condensed history of the uses that word association tests have been put to over the last 130 years. The main purpose of this chapter is to explain the potential of word association tests in exploring the mental lexicons of second language learners. As well as introducing key concepts and discussing the background to the methodology, I will also give an overview of the structure of the thesis and the main themes that will be pursued.
1.2 What is the mental lexicon? The mental lexicon can be thought of as the mental space that stores the words and phrases used in understanding and/or producing language. The most complex of our cognitive functions, language (and its constituent parts), is difficult to conceptualize other than through metaphor. One commonly used metaphor for the mental lexicon is that it resembles a dictionary or thesaurus (Meara, 1978), although as Pavičić Takač (2008:11) points out, such a comparison is unsatisfactory as printed dictionaries are “static, limited and prone to become outdated” with items not necessarily being stored alphabetically. On the contrary, it is widely agreed (Aitchison, 1987; Pavičić Takač, 2008) that the mental lexicon is “connected into semantic networks” and characterized by “fluidity and flexibility”. When new words are learned or extra information on existing words is added, there is a need for reorganization. Even for adult (L1) speakers the system must be in a constant state of flux, although we can probably assume the greatest instability would exist in those still at the early stages of competency such as native children and second language (L2) learners. There is a temptation to view the mental lexicon of L2 learners (the focus of this thesis) as being less complex than the lexicon of native speakers, as learners have smaller L2 vocabularies. This is a misconception as the first language is already in place before the learning of any subsequent language; the learner’s mental lexicon is a more complex system as it comprises both L1 and L2 items. Another widely accepted metaphor (Aitchison, 1987:72) is that the lexicon is “a 1
gigantic multi-dimensional cobweb in which every item is attached to a score of others”. In this view the lexicon can be seen as a complex structure with words having multiple links and differing levels of connectivity to other words in the network. In some respects this works quite well, the notion that different parts of the ‘web’ are more connected than others agrees with the idea of high and low frequency lexical items. Words that occur rarely in the language, such as perspicacious, can be thought of as existing in a more tenuous state at the edge of the web. Common words, such as clever, can be thought of as occupying a position closer to the center of the web with a greater number of connections. Despite the attractions the ‘web’ metaphor holds it does have limits. A recent study by Meara (2011) suggests that the lexicon is far too dense to be thought of as a light diaphanous substance like a cobweb. Meara calculates that for a network of 900 very common words there are over 20,000 connections, with such a density he argues that it might be more correct to think of the lexicon as “bindweed” rather than “gossamer”. Whether we choose to view the lexicon as an internal dictionary or an organic network, we ought not to lose sight of the fact that metaphors are simply figurative representations of reality, and when pushed eventually breakdown. While metaphors are useful in giving a general idea of something as intangible as human thought, as a base on which to build research there is greater merit in working from carefully phrased definitions. For such a widely written about construct though, there have been surprisingly few attempts to precisely pin it down. Of the handful of definitions for the mental lexicon that have been proposed, three will be discussed. These not only help to explain the mental lexicon but also illustrate the different kinds of thinking that the two main research traditions bring to psycholinguistics. The first two definitions are by linguists who view the lexicon from the perspective of the foreign language learner. The third definition is provided by two researchers more concerned with the psychological and neuropsychological side of psycholinguistics.
Definition 1: (Hulstijn, 2000:210) the mental lexicon is a memory system in which a vast number of words, accumulated over time, has been stored. The first point about this definition is that it recognizes the sheer size of the mental lexicon. Schmitt (2010:6) estimates an educated native adult speaker’s vocabulary will “range between 16,000 and 20,000 word families” and as Bauer & Nation (1993:253) state: “a word family consists of a base word and all its derived and inflected forms”. Each of these 2
forms is connected in various ways (meaning, phonology, orthography, syntactic characteristics) to other words in the network. When we also consider that for many there is also an L2 (and perhaps part of an L3) system being layered on top of this, calling the system ‘vast’ is no exaggeration. The second point that this definition highlights is that words are not completely acquired in the first-encounter; bits and pieces of word knowledge are gradually ‘accumulated’ through repeatedly meeting the item in various contexts.
Definition 2: (Richards & Schmidt, 2002:327) the mental lexicon is a person’s mental store of words, their meanings and associations This definition is useful for two reasons, firstly by specifying ‘person’ the uniqueness of every individual’s lexicon is recognized, a major theme running through this thesis. Secondly, by specifying ‘meaning and associations’, the multiple aspects of word knowledge (Nation 2001:27) are hinted at. As with the initial definition, being so short it fails to fully account for some important components of the mental lexicon. For example, of the aspects of word knowledge, only ‘meaning and associations’ are made explicit. Other aspects, such as: what the word sounds like, how it is spelled, its syntactic limitations or frequency of use, are not mentioned. These are surprising omissions given that Richards wrote a seminal paper on the aspects of word knowledge (Richards, 1976). A further problem with this definition is that it does not clearly state that the words are connected in a network. Although by mentioning ‘associations’ this is perhaps implied, it is easy to interpret this as merely referring to an internal component of the words themselves.
Definition 3: (Jarema & Libben, 2007:2) The mental lexicon is the cognitive system that constitutes the capacity for conscious and unconscious lexical activity. Unlike the previous definitions, the issues of size, gradual accumulation, uniqueness of the individual and the aspects of word knowledge are not made explicit. On the positive side, the third definition does however ask us to consider a ‘cognitive system’, the implication being that words are part of a network – a crucial point. The third definition also specifies ‘conscious and unconscious’ activity. While it is perhaps redundant to state both, it underlines the fact that in many cases we are able to consciously consider the connections 3
made between words, but we often do not do this. By doing so we would not be able to express our ideas fluently. The constraints of real-time communication require that a lot of the connections be made so quickly as to be almost automatic (Hulstijn, 2007). I also think the idea of ‘capacity’ is useful; while there are many connections between words available for us to use it does not necessarily follow that they will all be active and ready for use when demanded. The tip of the tongue phenomenon, a common word that we ‘know’ but under pressure just don’t seem to be able to produce, is a frustrating experience familiar to most. As noted in the preceding paragraphs, while the three definitions contain valid points they are all, disappointingly, incomplete. However, as these points seem complementary, a logical step would be to combine them into a more inclusive definition. It would also make sense to incorporate the idea that came out of the analyses of the metaphors, that the mental lexicon is a dynamic system. Thus, a more comprehensive (though unfortunately less succinct) definition would be: The mental lexicon is a vast cognitive system that constitutes a mental store of the multiple aspects of word knowledge that an individual gradually accumulates for each word or phrase. There are numerous links between words in this dynamic network, which has the capacity for conscious and unconscious lexical activity. Within this definition it ought to be noted that ‘word’ is used in the broader sense. This goes beyond the everyday meaning of ‘word’ as ‘a string of letters with a space either side’, such as dog, watch or ear. As Pawley & Syder (1983) argue, due to the speed with which people communicate it is unlikely that words are stored in the lexicon as single units alone. It is more likely that in addition they will also be stored in larger units such as dog eared, dog watch or gone to the dogs. The term ‘word’ also covers these multi word units whose meaning cannot be worked out through adding together the individual parts. Given the current lack of a widely accepted model explaining how the mental lexicon is organized and how new items become integrated, the above definition will need to be refined as our understanding improves. The definition will however serve as a base on which to build this thesis as it includes the components I think are key to its construct.
1.3 What is a word association test? Now that we have a definition of the mental lexicon to work with we can move on to the next point, how to measure its characteristics. Much of human behaviour can be measured directly by observation, what happens within our brains however is not so easy to discern. 4
The measurement of thought, and more specifically, a construct such as the mental lexicon requires an indirect approach. Due to the vastness of the lexicon, Meara (1996:50) argues it is impractical to measure every aspect of word knowledge for a representative sample of words; a better approach is therefore to develop tests that cover key “global characteristics”. The two dimensions he puts forward are “size and organization”. Tests of vocabulary size (The Vocabulary Levels Test, Nation 1983; The Eurocentre’s Size Test, Meara & Jones 1990) are widely used and have been checked for reliability and validity (Schmitt, 1996; Schmitt et al., 2001), more importantly they have survived the test of time. With an enhanced version of the VLT - The Vocabulary Size Test (Nation & Beglar, 2007) recently introduced, it seems that measuring the size dimension is well in hand. A widely accepted test of the ‘organizational’ characteristic has however yet to emerge, although as Meara’s (1996) paper suggests, one way to achieve this is through word association tests. It is the analysis and development of reliable word association tests, as a way to understanding the organization of a person’s mental lexicon that is the focus of this thesis. In its simplest form a word association test (WAT) is a task where the person being tested is given a stimulus word and is asked to respond to it with the first word that comes to mind. It is, as Entwistle (1966:1) notes, “a method for gathering data relevant to verbal habits and linguistic development”. The main advantages that are cited with WATs are that they are relatively quick to administer, give rich information about a user’s knowledge of a word and are uncluttered by context. Deese (1965:39) argues, “the free-association test has survived as a technique of psychological investigation because it is an instrument for detecting the sequences of thought as these seem to exist in their most unconstrained form.” More recently, Milton (2009:141) notes that a benefit WATs have over other kinds of language test, is that “people carrying out such tasks are not hindered by the requirement to produce grammatical or well structured grammar”. Such tests are therefore well suited for use with language learners, who by definition have difficulty doing language tasks that require comprehension/manipulation of sentences or longer texts. The lack of context is however a double-edged sword; while it only puts a minimal burden on the testee in terms of output, it does not measure language in a particularly authentic or ‘communicative’ way. Another potential flaw that Milton (2009:141) points out is that “it only works when learners willingly engage with the purpose of the exercise and do not try and maximize their scores”. There are many variations of the WAT, and these will be briefly explained before we explore the history of how the different kinds of WAT have been employed over the 5
years. A basic distinction we can make is between free and controlled WATs. In the free version, a number of stimulus words (also referred to in the literature as cue or prompt words) are given to a testee and then the testee is asked to respond to them. This can be done orally, using a paper test or via a computer. Usually the testee is asked to make only one response per stimulus, although a common variation is to ask the testee to give multiple responses. Of the multiple response formats two further variations exist, continuous and continued. In the continuous test the stimulus is only given once whereas in the continued test the stimulus is repeated many times between responses. This is to ensure that each response is with the main stimulus word rather than responses to the first or second responses – a way of responding known as chaining. The controlled word association tests work slightly differently. In this kind of WAT the testees are given stimulus words although their response is limited in some way. A testee could for example be given a stimulus and asked to connect the word with one or more words in a predetermined list. The “word associates test”, developed by Read (1993) for his language learners, follows this format. Other constraints might restrict the response by requiring the testee to respond with a specific word class or perhaps a word in the same lexical group. These variations have been developed over the years and enabled researchers to explore different aspects of the mental lexicon for different purposes. These can be roughly divided into two main research strands, the movement towards native-like proficiency and response type. As these strands will be dealt with in considerable detail in Chapter 2, in the following paragraphs only a brief outline is provided. The first of the two main research strands, that has received considerable attention, is how stereotypical learner responses are in contrast to native responses. Many have argued that analysis of responses in this way can be used as a measure of proficiency in the language (Lambert, 1956; Randall, 1980; Piper & Leicester, 1980; Kruse et al., 1987; Read, 1993; Nishiyama, 1996; Schmitt & Meara, 1997; Schmitt, 1998a, 1998b; Greidanus & Nienhuis 2001; Wolter, 2002; Henriksen, 2008; Zareva, 2005, 2007, 2011). Researchers working in this proficiency strand measure factors such as the speed, number and also the quality of learner responses and through comparison with norms lists make inferences about the learner’s language ability. These studies are based on the assumption that as learners become more proficient, their responses become more native-like. A norms list that has often been used as a benchmark against which to measure native-like ability is the Postman & Keppel list (1970). Recently (Meara & Schmitt, 1997; Schmitt, 1998a; Zareva, 2011) researchers have been using other lists, such as The Edinburgh Associative 6
Thesaurus (Kiss et al., 1973), or developing their own norms lists. The second of the two main research strands, is concerned with measuring how the words in the network relate to each other in terms of their semantic or lexical meaning. In this tradition researchers have made inferences about the organization of the mental lexicon for certain groups of people or certain word classes based on the type of responses generated. As this thesis fits into the research strand concerned with analyzing word associations responses based on their lexico-semantic type, it is relevant to consider at this point how these types of response might be classified. Although various competing classification systems have been suggested, the traditional method in L1 studies (and also many L2 studies) has been to divide responses into three main groups: Paradigmatic: meaningful responses which are in the same word class, these vertically related responses can often replace each other in a sentence and remain grammatically correct. Synonyms, antonyms, meronyms and hyponyms would fall into this category. For example: keylock or dogpuppy Syntagmatic: meaningful responses that are not (usually) in the same word class but are linked horizontally in the sentence. Collocations would fall into this category. For example: keylow or dogtired Clang/Phonological: responses that don’t have a meaningful connection with the stimulus but have a similar sound and/or spelling to the stimulus. For example: keykeen or dogfog Many studies of type have focused on the development of the lexico-semantic relationships in native speaker lexicons (Ervin, 1961; Entwistle, 1966; Deese, 1965; Stolz & Tiffany, 1972; Emmerson & Gekoski, 1976; Fitzpatrick 2007). There have also been numerous studies of second language learners (Riegel & Zivian, 1972; Meara, 1978; Politzer, 1978; Söderman, 1993; Wolter, 2001; Orita, 2002; Namei, 2004; Zareva, 2005; 2011; BaggerNissen & Henriksen, 2006; Fitzpatrick, 2006; 2009).
1.4 The history of word association testing Deese (1965) and Entwistle (1966) point out that scholars have been thinking about associations since the time of Aristotle and that the laws of association can be traced back to the 17th century philosopher John Locke. We will however begin our story in the 19 th century, with Sir Francis Galton. The definitive ‘gentleman scholar’, Galton is an unlikely 7
character to find cited in a modern thesis. Infamous as the founding father of eugenics, his innovative contributions to other fields are consequently often overlooked. Driven by an obsession to measure humans in every aspect he could think of, in pursuit of his belief that some types of humans are superior to others, he made numerous discoveries and inventions: such as the uniqueness of fingerprints. Despite the distasteful direction of his primary field of research, Galton (1883) warrants mentioning here for two reasons. Firstly he can be credited with documenting the first free productive word association test, the form of WAT that is used within this thesis. Galton tested himself on four occasions with 75 stimulus words with about a month between each sitting. He wrote down the first two or three words that he associated with each word within a four second timeframe, using what was then cutting-edge technology (a stopwatch) to record the time. Contrary to his expectation, the associations were marked by a lot of repetitions of the same word. For example, 23% of his responses to stimulus words were the same on all four occasions with a further 21% occurring three out of the four times. As well as recording the quantity of the responses he also devised four qualitative categories for the associations. The second reason for mentioning Galton is his pioneering work in the field of statistics, particularly correlation coefficients: now a standard tool in behavioural science that not only features in many of the papers in the following chapter but also my own experimental work later in this thesis. Following Galton there were many studies by clinical psychologists such as Jung (1902) who used the free word association test and developed norm lists to diagnose patients. In their 1918 paper, Jung and colleagues explain a method of diagnosing psychopathological conditions through WATs. They created an extensive prompt list of over 200 words from mixed word classes and a detailed classification system. They then tested a lot of people without psychological disorders, to create a response norms list, and then compared these to the responses of their patients in order to identify psychological problems. A stimulus list developed at that time, the Kent & Rosanoff list (1910), became a standard reference. Using this list and following Jung’s methodology, Bleuer (1924) for example claimed, “a primary symptom of schizophrenia is a loosening of association”. Basing a clinical diagnosis on vaguely defined concepts such as ‘a loose association’ did not really catch on. In any case, by the late 1920’s the work of Freud (1900) had become more accepted, clinical psychologists began to move away from word association tests in favour of dream analysis and testing other kinds of cognitive behaviour. At about the same time, linguists and psychologists (Woodworth, 1938) began to apply word associations to the study of language development. For a detailed explanation 8
of the kind of work that was done within an L1 context Cramer’s 1968 review is recommended; in this volume she describes over 300 word association studies conducted between 1950 and 1965. Particularly influential projects were initiated by researchers such as Russell & Jenkins (1954), Ervin (1961) and Entwisle (1966). These large-scale L1 studies (typically around 1000 subjects) used word association tests to establish general associative patterns such as the syntagmatic – paradigmatic shift. Simply stated this theory holds that children initially make a lot of syntagmatic associations (pot in response to flower) and then as their lexicon matures they make more paradigmatic associations (daisy in response to flower). The early L1 studies also laid much of the theoretical groundwork by applying the laws of association to linguistics. Deese (1965:2) informs us that the primary law of association - the law of contiguity, can be expressed as “one thought leads to another because it causes another”. Of the secondary ‘modifying’ laws of association: duration, vividness, intensity and frequency, it was frequency (the most accessible of these influences) that formed a central role in many of the studies of this period. The law of frequency tells us that the response to any idea or word is not random but determined by how frequently the stimulus is heard in general and how frequently two words have been heard together in the past. As well as a discussion of the theory of association Deese (1965) details two experiments undertaken at John Hopkins University on 100 native English speakers’ associative responses. In the first study he specifically looked at the responses to adjective stimuli. He expected to find (and did) that the most common adjectives are composed of a limited set of polar opposites. Of the 278 adjectives, 29% were polar opposites, alive for example generated dead 44% of the time and bad generated good 43% of the time. Frequency was found to be an important variable, the adjectives generating polar opposites were usually high frequency adjectives (e.g. blackwhite), the less frequent adjectives however often generated nouns (e.g. grandcanyon). In the second experiment he used noun stimuli, again with university students. The most basic finding was that nouns generated other nouns. An interesting point about Deese’s 1965 study is that he rejected the traditional classification used by his peers (if a noun generates a noun it is paradigmatic if it generates another form class it is syntagmatic) as being too simple to be of any real use. He elected instead to classify the responses into categories aimed at grouping responses with similar or different nominal characteristics. While such L1 studies were being conducted it also began to occur to some researchers (Lambert, 1956; Riegel & Zivian, 1972) that the methodology could be applied to bilingual students, the expectation being that adult L2 learners would behave in a similar 9
way to L1 children. A particularly insightful paper (Meara, 1983) is viewed by many as a good place to begin a discussion of the problems and assumptions involved with using word associations with learners. Primarily, this paper is a review of a series of word association studies done with L2 learners at Birberk College, London in the late 1970’s and early 1980’s (Meara, 1978; Beck, 1981; Hughes, 1981; Morrison, 1981). The main findings were that learner responses: differed fairly systematically from native speakers; were far more unstable than native speakers; were inhomogeneous; were often based on phonological connections rather than on meaning. As this was a “preliminary skirmish” into L2 word associations much of this paper deals with problems in collecting and analyzing the data. These problems, comments and suggestions for future research are summarized in Table 1.1.
Table 1.1 Problems in using word association tests with L2 learners (Meara, 1983) Problem
Comment/potential solution
It is difficult to classify responses using the syntagmatic/paradigmatic system. L1 norms lists (particularly Kent-Rosanoff, 1910) are inadequate for use in L2 studies. This is mainly due to a lot of the words in the list being high frequency words. Learner responses are not as stable as native speaker responses.
Learners make a lot of errors, both in identifying and responding to words. A learner’s L1 interferes with his/her responses. L2 users do not necessarily approach the word association task in the same way as L1 users. Learning words is a gradual process, not an allor-nothing activity.
Learner responses are less homogenous than native speakers There is a lack of general theoretical models to account for word association responses
10
Abandon standard lists in favour of carefully considered word lists that suit the research questions Need to identify what conditions lead to stable patterns, what the causes of the instability are and how long they last. In analysing responses one needs to consider a learner’s language (L1+L2) as an integrated whole rather than a set of discreet components. One-off studies are ineffective measures. Studies ought to include a test-retest strategy over a period of time.
In Table1.1 there are suggestions on how to resolve some of these problems. Three crucial areas are however not addressed: the problem of reliably classifying the responses, the variability within non-native speaker groups and the lack of a broad theoretical model with which to explain the response data. Following Meara’s1983 paper, there were however a series of conflicting findings, some studies supported the idea of using WATs as a measure of proficiency (Söderman, 1993) and others rejecting it (Kruse et al., 1987). Some studies found that L2 lexicons shifted from being syntagmatically dominated to paradigmatically dominated with increased proficiency (Piper & Leicester, 1980; Söderman, 1993; Orita, 2002; Namei, 2004). Others had findings that were incompatible with such a shift (Wolter, 2001; Bagger-Nissen & Henriksen, 2006). The optimism of the early 1980’s had become bogged down in contradictory research findings, a fresh approach was needed. One researcher who explicitly set out to re-evaluate basic assumptions and resolve Meara’s problems (Table 1.1) was Fitzpatrick (2006), who proposed a more precise classification system. In a subsequent paper Fitzpatrick (2007:328) also addressed the problem that learners are not homogenous, proposing an “individual profile” style of analysis. In Fitzpatrick’s work (2006, 2007, 2009), and also studies by Schmitt (1998a) and Wolter (2001), there is serious consideration given to the selection of prompt words and how to analyze the responses generated. Following Meara’s arguments it is no longer considered good practice to unquestioningly use the Kent & Rosanoff list (1910) as a source for prompt words. These days, prompt words are usually selected in a principled way in order to provide data that will help to answer specific research questions. In his 1983 paper Meara was one of the first to argue that word association tests could be used as a tool to measure the structure and organization of a learner’s mental lexicon and answer questions such as: “what does a learner’s mental lexicon look like?” and “how is it different from the mental lexicon of a monolingual native speaker?” At the time such claims might have appeared fanciful due to the numerous problems identified. A quarter of a century (and a few large empirical studies) later Fitzpatrick (2009:52) states: far from being fanciful, they were “prescient”. There is still a fair amount of disagreement over how best to collect word association data, interpret the results and apply the findings; but there are currently few who would disagree with the essence of Meara’s claims in the early 1980’s. It is now widely accepted (Henriksen, 2008; Fitzpatrick, 2009; Zareva & Wolter 2012) that word associations can tell us something useful about a learner’s mental lexicon.
11
1.5 Overview of the thesis This thesis is primarily an examination into current methods of collecting and analysing word associations for the purpose of describing how L2 mental lexicons are organised. In conjunction with the measures of size that are currently available it is argued that a reliable measure of organisation would be useful in understanding the global characteristics of a learner’s lexicon. In Chapter 2 there will be a detailed review of eleven studies that illustrate how word association research has proceeded over the last 30 years, including an extended discussion of the main achievements and problems in this field. Chapter 3 reports a close replication of an influential study (Wolter, 2001) that holds potential in terms of the theoretical model it proposes and careful attention to methodology. Following this, an alternative approach first suggested by Fitzpatrick (2006), is explored from a number of angles. Fitzpatrick’s individual profiling idea is taken up in Chapters 4 – 8 with experiments to test the reliability of the construct and evaluate the methodological framework. The main question being addressed is whether Fitzpatrick’s approach can generate stable profiles with stimuli from different frequency ranges and different word classes. In Chapter 9 there is a general discussion of the main findings of this series of experiments with suggestions on how research in this area might proceed. The final part of the thesis (Chapter 10) draws together the main points from the general discussion.
12
Chapter Two: Literature Review
2.1 Introduction As the main focus of this thesis is with language learners (L2), the large body of research using word associations to understand first language (L1) development, outlined in Chapter 1, will be put to one side unless directly relevant to the discussion. Early L1 word association studies by Galton (1883) and Deese (1965) and also the studies by clinical psychologists (Jung, 1918) are interesting in fleshing out the historical development and uses that word association have been put to over the last century. It is however necessary to now narrow our perspective to studies more pertinent to the experiments in Chapters 3 - 8. This chapter therefore consists of a detailed review of eleven studies that have made contributions to our understanding of the network of words that form a learner’s mental lexicon. There are two basic strands of research into the L2 lexicon, studies that argue WA responses can be used as a measure of proficiency and studies that use the type of response to explore the semantic organisation of the lexicon. The primary focus of this thesis is with type, although studies that are mainly concerned with proficiency cannot be ignored. Firstly, many of these proficiency studies also examine the type of response and secondly there is a considerable overlap in the methodology and assumptions that underpin them. This overlap can be seen in studies such as Politzer (1978), Söderman (1993b) and Orita (2002) which argue that a shift in response type can discriminate between language users of differing proficiency. Furthermore, studies that are concerned with type of response generally account for learner proficiency as one of the many variables that will affect responses. A discussion of both strands can therefore help fit the studies of response type into the broader framework of research into learner lexicons. Within each of these two main strands the papers are explored in chronological order. By ordering them in such a way there is no intention to imply that the methodologies and findings of these studies follow each other in a well-ordered progression. The main reason for this is that it seems the least complicated way of grouping the studies and allows the reader to follow the development of ideas and methodologies over the last 30 years. The selection of papers reviewed attempts to give a broad view of how the research in this field has progressed (and regressed) with inclusion of papers that reflect both negatively and positively on the use of word associations to answer questions about the mental lexicon of learners. Following an objective summary of each study within the two main strands and comments on the key points of interest that each paper raises, there will be a general 13
discussion of some of the more persistent issues. The issues addressed will give greater context to the series of experiments in this thesis and support the approach that was eventually adopted.
2.2 The Proficiency response strand The initial strand, papers that are more concerned with using word association tests as a measure of proficiency, begins with Politzer (1978). This is by no means the first study to view word association behaviour as a potential measure of learner proficiency, that distinction can be attributed to Lambert and colleagues (Lambert, 1956; Lambert & Moore, 1966). The decision to start with Politzer was made due its comparative recency and the large (and lingering) impact on the field. Also, this paper is particularly interesting for two further reasons. It was the first to suggest that the kind of word associations made by L2 learners are similar to those made by L1 children (in that they make a lot of syntagmatic links) and there is an attempt to link associative patterns with pedagogy. The problems highlighted in this study reveal that studying the L2 context is not merely a case of applying methodologies and assumptions that seem to work with native speakers. An equally influential paper by Kruse, Pankhurst and Sharwood-Smith (1987) is next on the list. This requires inclusion due to the severe criticism of the use of word association response data in general, which led to the basic methodology falling out of favour for about a decade. Some research did however persevere with this methodology, one study from this period (Söderman, 1993b) is included. This study attempted to work on the ideas initially put forward by Politzer. Although still problematic this study certainly represents a step forward in terms of experimental design. The work by Söderman is important as there is an attempt to look at lower frequency stimulus words and compare the findings with more frequent stimulus items. Along with word class, the frequency of the stimulus has long been assumed (Deese, 1965; Cramer, 1968) to be a key variable in determining response. Until this point however studies had generally limited themselves to high frequency stimulus items taken from the Kent-Rosanoff list (1910). As it is quite likely that low frequency stimuli will behave differently to high frequency stimuli the generalisations that can be made from such early studies on response behaviour are limited. The next study, Schmitt (1998a) is included due to it being one of the few studies to have attempted to track word association responses over time. As is argued in Chapter 8, it does not do justice to the incremental nature of vocabulary acquisition to only view snapshots of a learner’s lexicon. A lexicon is dynamic by nature with a learner’s lexicon being especially 14
so; words are integrated, reinforced and forgotten all the time as the learner’s lexicon continually reorganises itself. If we are to truly understand the complexity of the processes at work, studies such as Schmitt (1998a) which track the development of words over time (and in detail) are likely to lead to enlightenment. The next paper, Orita (2002) is relevant to the experiments presented in this thesis as it is in a Japanese context using participants of a similar background and ability. Despite being exemplary in some respects of how word association studies ought to be done it also highlights some issues that had yet to be adequately addressed: how stimulus words are selected and how responses are classified. Finally in this section we look at a recent, large scale Danish study that includes two measures of word association (Henriksen, 2008). This is particularly interesting as it builds on the work of Schmitt (1998a) in developing a categorisation method that ‘scores’ word association. To a certain extent it also takes on board the idea that when viewed from an individual perspective, word association data can give important insights into how a learner’s lexicon is structured. This is a key theme that we will come back to repeatedly throughout this thesis.
2.3 Politzer 1978 2.3.1 Summary This study builds on L1 research findings (Brown & Berko, 1960; Entwistle, 1966) that young children give a high proportion of syntagmatic responses and when their lexicon matures (between five and eight) they begin to make more paradigmatic responses. Working on the assumption that the proportion of paradigmatic and syntagmatic responses is indicative of language proficiency Politzer gave word association and language proficiency tests to his French learners. He posed three questions. -How does the ratio of paradigmatic and syntagmatic responses of French students in French compare with the same ratio in their native language (English)? -What is the relation of paradigmatic and syntagmatic responses and achievement in French? -Are there any teaching behaviours which favour the establishment of either paradigmatic or syntagmatic responses by the student?
(Politzer, 1978:204)
The 203 first year French students were given two 20-item word association tests; the items were from various word classes. The first test used French items and the second test used the same items but in English. The tests were two days apart and the order of the 15
items was randomised for the second test. The responses to these 40 stimulus words were categorized, the important categories being paradigmatic and syntagmatic. As previous L1 studies led the author to expect, the responses to the L2 stimuli showed a syntagmatic dominance (on average 9.7 of the 20 responses were syntagmatic and 5.3 were paradigmatic). The remaining responses (25%) were not classified; Politzer notes that they were a mixture of “clang - purely acoustic” or “non-responses”. The responses to the L1 stimuli showed a paradigmatic dominance (on average 14.3 of the 20 responses were paradigmatic and 4.9 syntagmatic). To test the second question the L2 word association responses were correlated with scores from an L2 language test. The results (Table 2.1) show significant correlations between the number of syntagmatic responses and the scores on the Listening, Reading, and Speaking sections of the test. All sections of the test had significant correlations with the number of paradigmatic responses. Table 2.1 Correlations between L2 responses and language tests (Politzer, 1978) Number of syntagmatic Number of responses paradigmatic responses Listening 0.26** 0.20** Reading
0.14*
0.28**
Grammar
0.10
0.34**
Writing
0.10
0.29**
Free writing
0.04
0.26**
Speaking
0.27**
0.21**
**p< .01, *p< .05
To test the third question the L2 responses were correlated with data on teaching behaviour taken from a different study done by the author on the same classes. It was found that some teaching methods, such as dialogue drills generate syntagmatic responses (a correlation of 0.56) and that some methods, such as substitution drills, generate paradigmatic responses (0.55). The translation method was found to be “counterproductive”, he argues that the native language “inhibits thinking in the foreign language” and consequently hinders the development of L2 associations. Politzer concludes that L2 beginners’ dominant responses are syntagmatic with any paradigmatic responses being associated with the learning of writing and grammar skills. He argues that as learners improve there is a shift in association type and that this can be used as an indicator of L2 proficiency.
16
2.3.2 Critique of Politzer 1978 In this section I will discuss some serious problems with the evidence that this study presents, focusing particularly on the low correlation values and also the stimulus items used in the word association test. As well as these negative points I will also comment on an interesting (though poorly supported) idea that came out of this study. A major problem with this widely cited and influential study is that the evidence presented is very weak and offers scant support for the conclusions. In this study Politzer calculates the correlation coefficients between various sets of data. The significant correlations cited as evidence that a particular set of word association responses are linked in various ways to language ability range from 0.14 to 0.34 (Table 2.1). It is natural to question such values, which even within the behavioural sciences are very low. As Cohen et al. (2006:202) explain, the reason that such low correlation values are deemed “statistically significant” is that significance is determined by the number of subjects. In this case the number of subjects (203) is high, meaning that correlations as low as 0.14 have statistical significance. Even though they are statistically significant it would have made more sense to interpret all these values as showing that there was very little relationship between any of the language measures and the responses. Cohen et al. (2006:202) argue that “when correlations are around 0.40, crude group predictions may be possible” but that between the 0.20 and 0.35 range they are “of no value”. With the correlations between the word association responses and the teaching behaviours we do see some higher values (the highest being 0.58 between paradigmatic responses and the number of drills per minute) although even these are not particularly convincing. As well as the low correlation values there are problems with the proficiency measure, one of these is that some parts of the language test are more (or less) syntagmatically biased than others. The listening section for example requires students to produce learned sentence patterns, a syntagmatic task, whereas the reading section requires substitution of items, a paradigmatic task. It therefore seems quite likely that the kind of task influenced the type of response given. A further problem is that each section of the main test only comprises a few questions. The proficiency sub skills (listening, reading, grammar, writing, speaking) were being judged on only a small demonstration of ability in each area. As the reliability of these test data is questionable, we must also view the correlations that they are based on with caution. The problems with the measures of language proficiency, one half of the correlations, are compounded by problems with the word association measure, the other 17
half of the correlations. The problem here is with the stimulus items. Firstly, they are not (as stated) a translation of each other, the English list is not an English version of the initial French list. There are some items in the second list that are not in the first, and the item we is included twice in the English version! A more serious problem is that the number of items is small (20 per test), although this might not have mattered so much if the selection of items had been a bit better. Unfortunately the selection of items (it is not reported how this was done) is poor and it is this which undermines the study the most. Many of the items included have a very strong primary link to just one other word. As Meara (1983) notes the word white for example will generally give black in English and good will probably give bad. Similarly, in this test blanc will give noir, not only because blanc and noir are strongly linked, but because both these words are used in the same stimulus list leading to a priming effect. Consequently, a lot of the responses generated from these stimulus words simply show the strength of the link that particular pairs of words have with each other rather than telling us something useful about the response characteristics of the learners. The use of personal pronouns (we in the English list and nous in the French) are also problematic as French pronouns will give a verb response noussommes (syntagmatic) but in English it is likely for pronouns to generate responses from the same class, we might give you (paradigmatic). As there were only 20 items in each list, these problematic stimuli would have seriously skewed the data. A more useful list of stimulus words would have contained not only many more items but items that had been carefully selected so as to give a variety of potential responses (both syntagmatic and paradigmatic). These problems with the stimuli invalidate the measure of learners’ response preferences. Putting aside the serious weaknesses with the study, one idea that does seem to make sense (and had the strongest correlation values in Politzer’s data) is that the way we are taught an L2 dictates to a certain extent the kind of characteristic responses that we give. According to Politzer, those who have for example been taught using a method that promotes a lot of memorisation of dialogues can be expected to give a lot of syntagmatic responses to a word association test. Unfortunately the data does not really support this idea, for the reasons given above and also because Politzer did not isolate the language learned through this classroom practice from general language learning. It would have been more reasonable to conclude from his data that spoken language in general encouraged the syntagmatic responses rather than just the dialogues used in these classes. Still, the idea that how language is taught is reflected in word association responses does warrant more serious consideration. If we turn the idea around we might even entertain the 18
notion that a student, who has a tendency to give an unusually high number of syntagmatic responses, might acquire L2 vocabulary more efficiently from doing activities (like memorising dialogues) that reinforce this predisposition. Despite its many weaknesses this paper was extremely influential, and not in a positive way. Although not the first study of L2 word associations, it was the first to suggest that L2 learners are similar to L1 children in that they make a lot of syntagmatic responses. Consequently it led research down what “turned out to be a blind alley” (Meara 2009:98). As Meara explains, “Politzer was a Big Name in Applied Linguistics at the time, and his results were taken very much at face value by L2 researchers, and not subjected to much critical analysis”. However, when these results are subjected to critical analysis they are found to be seriously flawed, lacking both validity and reliability.
2.4 Kruse, Pankhurst & Sharwood-Smith 1987 2.4.1 Summary Based on a methodology used in Randall (1980) this experiment was conducted in order to establish whether word association generated reliable data and also to assess the viability of using word association tests as a measure of second language proficiency. In the experiment 15 Dutch students of English were asked to make multiple (up to 12) responses to ten stimulus words selected from the Postman and Keppel (1970) norms list. As a control, seven native speakers of English were also asked to do the word association test. In an attempt to limit the effect of word stimulus type, one word was selected from each of ten word categories. The words in the norms list were initially divided into ten categories based on the stereotypy of the native speaker responses. The first category consisted of words with extremely high primary responses, such as man which associates with the word woman to the exclusion of most other words. The last category (10) consisted of words that are not stereotypical, words that have a very low primary response. The following words were selected: man, high, sickness, short, fruit, mutton, priest, eating, comfort, and anger. To determine their English proficiency level, each student was given a cloze style English test (students had to fill in 50 words deleted from a text) as well as a grammar test. To measure the reliability of the word association test, the students were asked to repeat the test two weeks later. A high correlation coefficient (r= >0.8) between the two data sets was expected in order to confirm its reliability. The computer-administered tests (participants saw the word on the screen for 30 seconds and typed in their responses) were analysed in two ways. The first was to count the number of responses each student made to the 19
stimulus words. It was expected that as proficiency increased the number of responses would increase. The second was to measure how stereotypical the responses were when compared to the norms list. It was expected that learners would give more varied (less stereotypical) responses than natives. Stereotypy was calculated in two ways, an unweighted measure and a weighted measure. The weighted measure gave more weight to stereotypical responses that were in the same order as the native responses. In the weighted measure each response was given a score (from 12 to 1) depending on how stereotypical it was in the norms list (the most typical response got a score of 12, the second 11, etc.), this was then multiplied by the order in which it appeared in the participant’s response (if it was the first response it was multiplied by 12). Therefore if the primary response to a stimulus was also the primary response in the norms list the score for that response would be 144. The scores for each of the responses to the nine words were summed and the averages calculated. There were three main sets of findings. Firstly (Table 2.2), the mean scores did not show any significant difference between the learners and the native speakers for any of the measures.
Table 2.2 Mean scores, SDs, and theoretical maximum scoring (Kruse et al., 1987) Test 1
Test 2 Mean
SD
Mean
Native speaker SD
Mean
SD
Theoretical Maximum
A:
76.8
17.9
82.8
19.1
79.9
14.2
108
B:
23.4
7.3
22.9
5.7
25.7
7.2
108
C:
1457
377
1542
337
1509
414
15,552
Test A = Response score Test B = Non-weighted stereotypy Test C= Weighted stereotypy
The second main finding was that when the tests in the first word association test were compared with the second test the correlations (Table 2.3) were below expectations. The authors argue that this demonstrates that the word association measure is unreliable.
20
Table 2.3 Reliability coefficients on two test sessions (Kruse et al.,1987) Test A: Response score
r = 0.759
p 25% of their primary responses to just one other word were cut. - Common collocates of Japanese words (e.g. stand/ スタンド, meaning bar/pub). - modal verbs such as will (too strongly linked to other verbs) - verbs with multiple meanings such as draw or let. - Difficult to classify as belongs to more than one word class (e.g. mean or like) - Too difficult for respondents (e.g. derive). To ensure students were clear that in this test it was a verb to which they were meant to be responding, ‘to’ was put before each stimulus word (to advise, to believe, etc.). The word lists used in this experiment can be found in Appendix 6.1 and 6.2.
6.6 Results In this section the following is reported: 6.6.1 Completion rates of PWL1 and PWL2 6.6.2 General trends in the group. 6.6.3 Focusing on individual profiles: four case studies
6.6.1 Completion rates of PWL1 and PWL2 After the test the responses were checked to confirm that within the group there were no prompt words that had proved too difficult for a majority of respondents or were strongly associated with just one other word. Following this, from PWL1 three words were eliminated from the analysis: to call, to feel, to carry. In PWL2, four words were eliminated: to blow, to climb, to vote, to burn. With the word to call for example 90%
140
answered telephone/phone. Although it was expected that some students would not know every item, 27 of the 28 individuals completed enough of the word lists for a satisfactory profile to be generated. One student did not turn over the test paper and so only completed PWL1, this was picked up at the interview stage but she couldn’t be persuaded to finish it. As with the previous experiments the threshold for completion was 50% or more for each word list. As can be seen in Table 6.2, of the 27 students analysed, the number of useable responses to PWL1 averaged 95% and the number of usable responses to PWL2 averaged 87%. There were therefore over 40 useable responses per student per list available for analysis, it was assumed that this would be enough to create profiles that reliably showed characteristic response patterns for each individual.
Table 6.2 Usable responses for the Verb study n=27 Mean s.d.
PWL1 (Max 47) 44.70 3.05
PWL2 (Max 46) 40.07 5.67
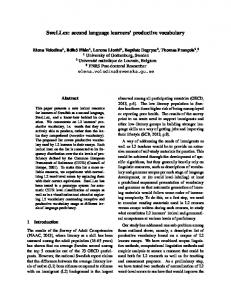
6.6.2 General response trends Of the 2508 responses in this study, most (90%) were comprehensible responses that could be clearly classified. As can be seen in Fig 6.1, there were a large percentage of Meaningbased responses, the second largest group was Position-based with the Form-based responses being the smallest group. Bagger-Nissen & Henriksen’s 2006 claim that “nouns elicit a higher proportion of paradigmatic responses than verbs and adjectives” is supported by these data. In the Verb study 55% of the responses were Meaning-based as opposed to 78% in the Noun 2 study, a considerable difference. With fewer Meaning-based responses the Verb study (Fig 6.1) generated more Position-based responses than the Noun 2 study. As well as the differences, there are however some broad similarities between the responses in the two studies; Meaning-based responses were both ranked first, Positionbased responses second and Form-based responses ranked third - accounting for less than 10% of responses.
141
Fig 6.1. A comparison of general (main category) response trends in the Verb and Noun 2 studies
General response trends: main categories 100
Percentage of responses
Verb (n=27) Noun 2 (n=30)
80 60 40 20 0 Meaning-based
Position-based
Form-based
What we can see from Fig 6.2 is that when these broad categories are unpacked there is a difference in response trends. Three subcategories in particular show a marked difference: same lexical set/context relationship
(19% difference)
xy collocation
(17% difference)
conceptual association
(11% difference)
In the Verb study there are far more xy collocations, there is also a drop in the number of responses in the two subcategories that were dominant in the Noun studies. In answer to the initial research question there is a difference in how learners respond to nouns and verbs. Reasons why this might be so are taken up in the discussion section. It ought to be noted though that so far we have been comparing two different groups of students, even though they are of similar ability we might therefore expect some variation. As argued in previous chapters it is better to look at the data from an individual perspective.
142
Fig 6.2. A comparison of general (subcategory) response trends in the Verb and Noun 2 studies General response trends: subcategories 40
Verbs (n=27) Noun 2 (n=30)
30 25 20 15 10 5
re ep l tu al as so c Sp ec ifi cS xy yn co llo ca t io n er ro r/ bl an yx k co llo ca t io n De fin in sim gS ila yn rf or m on ly af fix ch an ge ot he rc oll
0
co nc
Le x
se t/c
on te xt
Percentage of responses
35
As with the Noun studies, each individual’s Profile 1 (responses to very high frequency words) was compared with the profile created from their responses to less frequent words (Profile 2). An individual’s profiles were usually found to have some relationship. The proximity of these profiles was confirmed through calculating the correlation coefficient between the two profiles. To calculate this, the difference between the percentage of responses in each subcategory were compared. In the scatter-plot diagram (Fig 6.3) there is a wide range of correlation coefficients for participants in the Verb study, from students whose profiles are virtually identical (r=0.96) through to students who have very weak profile correlations (r=0.352). There was also one learner whose responses showed no relationship at all (r=0.035).
143
Fig 6.3 Correlations between profiles for students in the Verb study
Correlation coefficient (r)
Correlations between responses to PWL1 and PWL2 for 27 learners. 1 0.95 0.9 0.85 0.8 0.75 0.7 0.65 0.6 0.55 0.5 0.45 0.4 0.35 0.3 0.25 0.2 0.15 0.1 0.05 0
student 7
student 27 student 25
student 14
As Fig 6.3 shows, 63% of the correlations (17 out of 27 students) were defined as being vaguely similar, close or very close (r=>0.6). However, a significant number of individuals (10) generated profiles that were below the 0.6 threshold and were therefore classified as dissimilar. The learner who had the most dissimilar profiles is considered more fully in the following section along with the three other case studies highlighted in Fig 6.3.
Table 6.3 Proximity rankings for the Verb study Correlation r >0.8** 0.7 – 0.79** 0.6 – 0.69* 0.8**
Very close
22
6
0.7 – 0.79**
Close
3
7
0.6 – 0.69*
Vaguely similar
2
4
25% of their primary response being to just one other word were flagged as problematic (big for example gives small 29% and little 18% of the time) - Common collocates of Japanese words, such as single (used in hotels, as in a single room). - Adjectives with multiple meanings, such as right. - Difficult to classify due to belonging to more than one word class, such as relative. The pilot studies highlighted the problem of selecting suitable prompt words that generated responses from a range of words and were not too strongly linked to just one word. Consequently, prior to analysis a post-hoc check of responses was conducted to identify any ‘unhelpful’ prompt words that might have slipped through the initial screening. Not surprisingly, despite the pilot tests, there were still some stimuli in each word list that proved to be unsuitable as they had a within group primary response >25%. These words, shown in Table 7.2, were consequently cut from the main analysis. This meant that the 40 item lists had to be trimmed further, 33 items per list were available to create the student profiles.
158
Table 7.2 Items rejected following within group analysis PWL1 rejects national different significant foreign necessary concerned original
primary association country same important country need think first
% 34.6 29.6 35.0 50.0 35.7 29.6 33.3
PWL2 rejects entire educational wonderful ancient used odd elderly
primary association whole school great old old strange old
% 31.6 40.7 37.0 48.0 32.0 34.8 29.6
7.7 Results In this section the following are reported: 7.7.1 Completion rates of PWL1 and PWL2 7.7.2 General trends in the group 7.7.3 The proximity of individual profiles
7.7.1 Completion rates of PWL1 and PWL2 As in previous studies the threshold for including an individual in the analysis was 25 responses. It is difficult to have much confidence in learner profiles generated from fewer responses than this. The initial analysis of the responses indicated that three out of the 30 students fell well short of the required 25 on at least one of their response forms, these three were cut from the analysis. As can be seen in Table 7.3, of the 27 learner profiles that were used in the main analysis, completion rates were generally high, >30 responses per profile with the high frequency adjectives and 25 - 30 responses for the lower frequency adjectives. Two of the learners completed only 24 responses on PWL2. Given that the original level of acceptance was arbitrarily set at 25, it was decided to include these two whose completion rate fell just shy of the threshold.
Table 7.3 Completion rates for responses to PWL1 and PWL2 n= 27 Mean s.d.
PWL1 (max 33) 31.2 1.8
159
PWL2 (max 33) 27.5 3.5
7.7.2 General trends in the group As Fig 7.1 shows, most of the responses to the adjective prompt words were Meaningbased. This trend is in line with the previous studies in this series, the noun and verb studies were also dominated by Meaning-based responses.
Fig 7.1 General trends for adjective responses: main categories
100
Percentage of responses
80
60
40
20
0 Meaning-based
Position-based
Form-based
Error/blank
When the broad data shown in Fig 7.1 is broken down into the subcategories (Fig 7.2) we see that of the Meaning-based group, most of the responses are from two subcategories the same lexical set/context relationship category and the conceptual relationship category. Of the Position-based categories it is the xy collocation category that dominates. In the Adjective study students gave very few Form-based responses.
160
Fig. 7.2 General trends for adjective responses: subcategories
40 30 20 10 0
lex
ica
ls
et /c on co te nc xt ep re lat tu al ion as so cia ti xy co on sp llo ec ca ifi tio c n sy no ny m er s ro de r /b fin la n ing k sy pr no ef ix/ ny m af s fix ch sim an ila ge rf or m yx on ly co llo ot c he at rc ion ol loc at io n
Percentage of responses
50
Unlike the Verb study, where the bias was in favour of xy collocations, with adjectives there were a lot of lexical set/context related responses, coordinates such as cleardark, normalstrange, urbanrural were common.
7.7.3 The proximity of individual profiles A Pearson’s correlation was calculated for each individual by comparing the percentage of responses in each PWL1 subcategory to the percentage of responses in each PWL2 subcategory. As can be seen in Table 7.4, when a learner’s profile 1 (generated from responses to the high frequency adjectives) was compared with his/her profile 2 (generated from responses to lower frequency adjectives) the two profiles were generally found to have a similar pattern. Of the 27 sets of profiles 18 were defined as being close or very close, that is, they had a correlation coefficient of >0.70. The level of consistency in the responses by individuals, in Table 7.4, shows that these adjectives can be used to generate reliable profiles with Japanese learners. Over 90% of responses profiles were judged to be at least vaguely similar with 40.7% of the profiles judged as being very close. Only two profiles were defined as dissimilar, although it might be noted the correlation coefficients of these two (r=0.565; r=0.550) were only slightly below the 0.6 threshold and were statistically significant at the 95% confidence level.
161
Table 7.4 Proximity ranking for adjective profiles Correlation coefficient (r) Definition of profile proximity > 0.8**
very close
Number of students 11
0.7 – 0.79**
close
7
0.6 – 0.69*
vaguely similar
7