Center for Research in Public Economics, Leyden, The Netherlands. Received ... The function d@(olwo) on fi defines a normed measure vu0 on Q. We call (a,. â!
173
Economics Letters 1 (1978) 173-177 0 North-Holland Publishing Company
INDIVIDUAL
WELFARE FUNCTIONS AND SOCIAL REFERENCE
SPACES *
Arie KAPTEYN, Bernard M.S. VAN PRAAG and Floor G. VAN HERWAARDEN University of Leyden, The Netherlands Center for Research in Public Economics,
Leyden,
The Netherlands
Received June 1978
A model of interdependent welfare functions is developed. The relationship between the parameters of an individual’s welfare function and the income distribution in his Social Reference Space is established. Results based on Dutch data are presented.
In this paper we present a study of utility interdependence, empirically.
both theoretically
and
1. Social reference spaces Let s2 be a population of individuals o. The behaviour of an individual w E Sz in a given period may be described by a vector x(w). For instance, if the elements of x denote the levels of consumption of different goods, then x(w) describes w’s consumer behaviour. Generally, the behaviour of individuals is perceived by other individuals. Thus, an individual o0 will perceive a whole distribution of behaviours x(w) (w E a&,). This perception depends upon two phenomena: (1) on the value of the vector x(o) for each w E fi\o,; (2) on the weight which individual w. assigns to each individual o, to be denoted by d#(wloo), If d#(wlwo) = 0 for some o, w. does not attach any weight to w. We require J{, E a\wo} d@(olwo) = 1 [so d@(wloe) is a densityelement]. We call d$(wlwo) the reference weight (RW) which w. attaches to w. The function d@(olwo) on fi defines a normed measure vu0 on Q. We call (a, “!& vuo) the Social Reference Space (SRS) of w. , where “a is a u-algebra on s2 with individuals as atoms. After the introduction of x(o) and d#(olwo) we can define the density-element * This study has been supported by a grant from the Netherlands Organization for the Advancement of Pure Research (ZWO) and by the kind cooperation of the Dutch Consumer Union. It is a part of the Leyden Income Evaluation Project of the Center for Research in Public Economics of Leyden University. A more extensive version of this paper is available under the same title as Report 76.01 of CERPEC.
A. Kapteyn et al. /Individual
174
d$(xlwo)
of the behaviour distribution
W&loo)
=
s
welfare functions
perceived by w. as (1)
d@(wlwo).
{w E ci\wolx(w)=x} Probably drl/( * Iwo) influences gated in the sequel.
individual we’s welfare function.
2. The individual welfare function
This will be investi-
of income
We assume that an individual is able to evaluate income levels z on a [O,l]-scale. These evaluations are described by a so-called individual welfare function of income WFI). An individual’s WFI is measured by asking him the following question: In answering the following question it is advisable to start with the underlined words. Try at any rate to fill in all amounts asked for to the best of your judgement. Taking
into account
monthly/yearly excellent good
amply sufficient sufficient barely suffcien t
insufficient very insufficient bad very bad
my (our) present
living circumstances,
I would regard a net weekly/
(encircle the period) family income as: if if if if if if if if if
it it it it it it it it it
were were were were were were were were were
above between between between between between between between below
and
. .
. .
and
and and and and and
We call this the income-evaluation question. The verbal evaluations (excellent, good, amply sufficient, etc.) are transformed into numbers on a zero-one scale by identifying these evaluations with equal quantiles. ’ That is the qualification “excellent” is identified with 0.888, the qualification good is identified with 0.777, etc. Denoting the amount in the left-hand column in the ith row of the income evaluation question by zi and the corresponding numerical evaluation by U(zi), we obtain a sequence {(zi, V(Zi))} f= 1, where U(zi) = (9 - i)/9, i = 1, . .. . 8. (Note that the amount in the ninth row may be discarded because it will be equal to the amount in the eighth row.) According to the theory outlined in Van Praag (1968), the answers to the incomeevaluation question will follow a definite pattern. More precisely, the evaluation
1 This transformation rests upon an information maximization Praag (1971) and generalized by Kapteyn (1977).
argument
developed
by Van
A. Kapteyn et al. /Individual
U(z) of an income z is fairly well approximated
u(z) =
L o_f1t
exp 1-i
042ir
[(In(t)
- ~)/a]
welfare functions
175
by
*} dt
= A@; c130), the lognormal distribution function with parameters p and u. * The parameters p and u can be estimated per individual from the eight points {(zi, U(zi))} by means of simple regression. If individual o. has a higher /J [and consequently a hi&er expb)] than individual w 1, then w. needs more income to reach a certain evaluation level than does w1 . The quantity exp@) has been called the natural unit of income [for a motivation of the term, see Van Praag (1968, p. 37)]. The parameter u determines the slope of the WFI about the median value exp(p). The smaller an individual’s u, the steeper his WFI will be. The parameter u has been called the welfare sensitivity [Van Praag (1968, p. 38)]. Over a five-year period, WFIs of about 12,000 individuals were measured, and a number of attempts were made to explain individual welfare parameters p and u from individuals’ personal and social circumstances. [Van Herwaarden, Kapteyn and Van Praag (1977) give a short review of results.] It appears that an individual’s own actual income y and his family size fs are the most important factors. In the present study we extend the explanation of the welfare parameters by taking into account reference group effects. We assume that an individual we’s WFI depends on his income y(oo), the number of equivalent adults in his family fs(wo) [for details, see Kapteyn and Van Praag (1976)] and on the income distribution in LAas it is perceived by wo, J/( . IWO), 3 ~(Zl~o) = U?Ifi(~O)~Y(~O), where U(zlw,) is individual
J/( . Iwo)) 1 we’s evaluation
(3) of an income level z.
3. The relation between an individual’s WFI and his SRS Characterizing m&0)=
J
$( . Iwo) by its two first log-moments, In Y(W)
,
(4)
m@)12dN44,
(5)
dO(4wo)
n\wo ?(wo)
= s
n\wo
Uny(w)
-
* It should be stressed that in the present context the log-normal distribution function has no probability theoretical meaning. 3 The quantity $ ( IWO)has been defined by (l), be it that the vector x(w) is now replaced by the scalar y(w), the net after tax income of individual w.
A. Kapteyn et al. /Individual
176
welfare functions
we specify the following relationships: &we)=Po+ a2(oo)=
Pl~fi(~o)+Pz {a0
+ als2(wo)+~z~(wo)-
~JJ(oo)+Psm(wo) t~~(w~)]~}
+u(mo) eUcWo)
2
(6)
,
(7)
where u(wo) and u(wo) are i.i.d. error terms and PO, fir, f12,B3, ao, al, a2 are parameters. The relations (6) and (7) are theoretically motivated in Kapteyn (1977). The main problem in the empirical research is to specify d$(wloo), which defines m(wo) and s2(oo), as a function of a modest number of parameters which can be estimated along with the other parameters in model (6) and (7). To simplify matters, individuals are characterized by a number of social characteristics (education; job; degree of urbanization; age; geographical location; working environment, i.e., whether working in private firms, self-employed, or not employed at all). Next, the RWs d@(wloo) are specified as a function of the social characteristics of individuals o and oo. The whole model specifies the RWs d$(wloe) for all w and w. as a function of 20 unknown parameters.
4. Results The parameters in (6) and (7) [including the 20 parameters inherent in m(wo) and s2(wo)] have been estimated by means of Gallant’s non-linear least squares method from a sample of 2,774 members of the Dutch Consumer Union, drawn in 1971. The estimated counterparts of (6) and (7) read (standard errors in parentheses) M(w~) = 1.94 + 0.12 In fs(wo) + 0.49 In y(wo) + 0.29 m(wo) , (0.32) (0.02) (0.01) (0.03)
R * = 0.647, N = 2,774, (8)
a*(wo) = 0.12 + 0.53 ?(wo) (0.01) (0.10)
+ 0.21 [p(we) - m(wo)]2 ) (0.03)
R2 = 0.064, N = 2,774. (9)
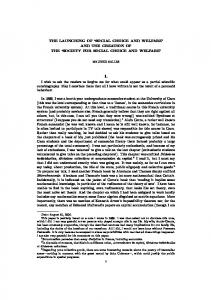
The meaning of (8) is illustrated by the example in fig. 1 [the numbers do not follow exactly from (8) but are merely illustrative; the argument w. is omitted]. Let individual w. with income y(wo) and WFI A at a certain moment expect an income increase by a factor (1 + o). He evaluates his present income by 0.70. The expected future income y(wo)(l + ol) is evaluated by 0.95. Once he receives the income y(wo)( 1 + a), eq. (8) implies that his WFI shifts to position B so ex post he evaluates the new income by 0.85. The phenomenon that the WFI shifts with income has been called the preference drift effect [Van Praag (1971)]. If, moreover, all other individuals receive the same income increase, m(oo) rises to m(oo) + ln( 1 + cr), and the WFI shifts to position C implying a welfare evaluation of the new income by only 0.75. The phenomenon that an individual’s WFI shifts with incomes in
A. Kapteyn et al. /Individual welfare functions
/
P
0.49
177
;
(I +cr) pi.,8 (I +Q)
Fig. 1. Ilhrstration
a
of eq. (8).
his SRS has been called the reference drift effect
[Kapteyn (1977)]. The positive coefficient offi finally implies that with a larger family the WFI lies more to the right. Hence a larger income is required to attain a certain evaluation level. This observation allows for the construction of constant welfare family income equivalence scales [Kapteyn and Van Praag (1976)]. Regarding (9) similar interpretations may be provided.
References Kapteyn, A., 1977, A theory of preference formation, Ph.D. thesis (Leyden). Kapteyn, A. and B.M.S. Van Praag, 1976, A new approach to the construction of family equivalence scales, European Economic Review 7, 313-335. Van Herwaarden, F.G., A. Kapteyn and B.M.S. Van Praag, 1977, Twelve thousand individual welfare functions, European Economic Review 9, 283-300. Van Praag, B.M.S., 1968, Individual welfare functions and consumer behavior (North-Holland, Amsterdam). Van Praag, B.M.S., 1971, The welfare function of income in Belgium: An empirical investigation, European Economic Review 2, 337-369. Van Praag, B.M.S. and A. Kapteyn, 1973, Further evidence on the individual welfare function of income: An empirical investigation in The Netherlands, European Economic Review 4, 33-62.