[3] is an attractive approach to perform localization since it can reuse the existing ..... degree, third degree and forth degree of polynomial regression are mixed ...
Indoor Localization Using Improved RSS-Based Lateration Methods Jie Yang, Yingying Chen Department of Electrical and Computer Engineering Stevens Institute of Technology Castle Point on Hudson, Hoboken, NJ 07030 {jyang, yingying.chen}@stevens.edu Abstract—Location estimation is a critical step for many location-aware applications. To obtain location information, localization methods employing Received Signal Strength (RSS) are attestative since it can reuse the existing wireless infrastructure for localization. Among the large class of localization schemes, RSS-based lateration methods have the advantage of providing closed-form solutions for mathematical analysis as compared to heuristic-based localization approaches. However, the localization accuracy of RSS-based lateration methods are significantly affected by the unpredictable setup in indoor environments. To improve the applicability of RSS-based lateration methods in indoors, we propose two approaches, regression-based and correlation-based. The regression-based approach uses linear regression to discover a better fit of signal propagation model between RSS and the distance, while the correlation-based approach utilizes the correlation among RSS in local area to obtain more accurate signal propagation. Our results using both simulation as well as real experiments demonstrate that our improved methods outperform the original RSS-based lateration methods significantly.
I. I NTRODUCTION The widespread deployment of indoor wireless technologies are resulting in a variety of location-based services, such as health care monitoring, personal tracking and inventory control. In indoor environment, performing RF-based localization is particularly challenging due to the radio signal is affected by reflection, refraction, shadowing and scattering. Compared to various physical properties of radio signal, such as Time of Arrival (ToA), Time Difference of Arrival (TDoA), Angle of Arrival (AoA), using the Received Signal Strength (RSS) [1]– [3] is an attractive approach to perform localization since it can reuse the existing wireless infrastructure and presents a tremendous cost savings over deploying localization-specific hardware. The current RSS-based localization methods in indoor environments such as fingerprinting or probabilistic approaches [1], [4] are heuristic-based and do not have closed-form solutions, and thus are hard for mathematical analysis. On the other hand, localization using multilateration is popular [5], [6] due to its closed-form solution for the convenient of mathematical analysis [7], [8]. However, due to the unpredictable signal propagation in indoor environments, e.g., reflection, refraction, shadowing and scattering of signal, RSS-based lateration methods cannot achieve comparable performance in terms
of location accuracy to other RSS-based algorithms [2]. To improve the applicability of RSS-based lateration methods in indoor environments and further provide feasible mathematical analysis for indoor localization, in this work we propose improved lateration methods, which can outperform the original lateration methods significantly. RSS-based lateration methods utilize the signal propagation model to estimate the distance between a wireless device and access point pair. However, the signal propagation between the wireless device and access point pair suffers from the connectivity of line-of-sight (LOS), Non-line-of-sight (NLOS), and the shadow fading due to the complicated indoor environments, such as walls, furniture and the movement of people. Thus, using the theoretical log-distance propagation model to characterize the relationship between distance and RSS may result in high errors, which significantly affects the localization accuracy of lateration algorithms. In previous work, [9]–[11] used polynomial regression to determine the mathematical relationship between the RSS and distance. But none of them investigated the possible improvement of the localization accuracy of lateration algorithms by utilizing linear regression. In our work, we study the performance of RSS-based lateration algorithms using linear regression under simulated indoor environments as well as in a real office building environment with two different networks. Moveover, we found that the RSS readings from closeby locations are highly correlated since these locations face the similar propagation environment, e.g., obstructs, walls and local construction of indoors. Therefore, our second method to improve localization accuracy of lateration algorithms is to utilize the correlated RSS and recursively perform localization in gradually reduced local areas to approach the true location, and thus achieve a higher accuracy. To evaluate the effectiveness of our regression-based and correlation-based methods, we use a partition attenuation factor propagation model to simulate the real indoor environments. Further, we conducted experiments using an 802.11 (WiFi) network as well as an 802.15.4 (Zigbee) network in a real office building. We examined our approaches on lateration algorithms including both Nonlinear Least Squares (NLS) and Linear Least Squares (LLS) methods. Our results from both simulation and experiments show that our approaches can
978-1-4244-4148-8/09/$25.00 ©2009 This full text paper was peer reviewed at the direction of IEEE Communications Society subject matter experts for publication in the IEEE "GLOBECOM" 2009 proceedings.
improve the localization accuracy significantly compared to the original lateration methods. The rest of the paper is organized as follows. In Section II, we first provide the background of RSS-based lateratoin algorithms, we then introduce our approaches, the linear regression-based method and the correlation-based method. We present our simulation results in Section III. The experimental results from a real office building are presented in Section IV. Finally, we conclude our work in Section V. II. A LGORITHMIC A PPROACH A. Background Lateration approaches are the most common methods for deriving location of wireless device [5], [6], [12]. By estimating the distance from the wireless device to multiple access points, lateration approaches derive the wireless device’s location based on least squares methods. There are two phases in RSS-based lateration methods: the off line training phase and the runtime localization phase. During the off line training phase, RSS samples are collected at various known locations from multiple access points and distances are calculated from the known locations to access points. The measured RSS readings and distances are then used to fit the signal propagation model and the signal-to-distance relationship is derived by: � � d + Xσ , (1) P (d)[dBm] = P (d0 )[dBm] − 10γ log10 d0 where P (d0 ) represents the transmitting power of a wireless device at the reference distance d0 , d is the distance between the wireless device and the access point, γ is the path loss exponent and Xσ is the shadow fading which follows zero mean Gaussian distribution with σ standard deviation. During the runtime localization phase, there are two steps: ranging step and lateration step. In ranging step, according to the measured online RSS from the wireless device and the fitted signal-to-distance relationship, the distances between the wireless device and multiple access points can be estimated. In lateration step, we can estimate the location of the device according to estimated distances based on least squares methods. In this work, we study both Non-Linear Least Square (NLS) and Linear Least Square (LLS) methods in the lateration step. Non-Linear Least Square (NLS): Given the estimated distances di and known positions (xi , yi ) of the ith access points, the position (x, y) of the wireless node can be estimated by finding (ˆ x, yˆ) satisfying: (ˆ x, yˆ) = arg min x,y
N � � [ (xi − x)2 + (yi − y)2 − di ]2
(2)
i=1
where N is the number of access points that used to estimate the location of the wireless node. Non-linear least square can be viewed as an optimization problem where the objective is to minimize the sum of the error square. Linear Least Square (LLS): The LLS is an approximation of NLS solution. It linearizes the NLS problem by introducing
Environment LOS Commercial NLOS Commercial LOS Residential NLOS Residential
Path loss: γ 2.07 2.95 2.01 3.12
Shadow fading: σ 2.3 4.1 3.2 3.8
TABLE I T HE PATH LOSS PARAMETERS IN INDOOR ENVIRONMENT [13]
a constraint in the formulation and obtain a closed form solution of location estimation. Compared with NLS, LLS has less computational complexity. The location of the wireless device can be obtained by solving the form Ax = b with: ⎞ ⎛ N N x1 − N1 i=1 xi y1 − N1 i=1 yi ⎟ ⎜ .. .. A=⎝ (3) ⎠ . . N N 1 1 xN − N i=1 xi yN − N i=1 yi ⎛
(x21 −
⎜ ⎜ 1⎜ b= ⎜ 2⎜ ⎜ 2 ⎝(xN −
1 N
1 N
N
2 (y12 − N1 i=1 xi ) + N 1 −(d21 − N i=1 d2i )
.. . N 2 2 x ) + (yN − N1 i=1 i N −(d2N − N1 i=1 d2i )
N i=1
yi2 )
⎞
⎟ ⎟ ⎟ ⎟ , (4) ⎟ N 2 ⎟ ⎠ y ) i=1 i
where A is only described by the coordinates of access points, b is represented by the distances to the access points together with the coordinates of access points and x is the estimated location of wireless device. Thus, the estimated location (ˆ x, yˆ) of the wireless device is given by x = (AT A)−1 AT b. B. Linear Regression The radio propagation in indoors is complicated by signal reflection, refraction, shadowing and scattering due to the walls, furniture and the movement of people. According to the connectivity between the wireless device and the access point, the signal propagation can be classified into line-ofsight (LOS) and Non-line-of-sight (NLOS) scenarios [1], [14]. These two scenarios represent different signal propagation environment in indoors. Thus, under different scenarios, the propagation parameters are different, such as the path loss exponent and the shadow fading in formula (1). Table I presents the propagation parameters under different scenarios in both commercial indoor environments as well as residential indoor environments [13]. The training data collected in the area of interest usually includes both LOS and NLOS scenarios and we cannot differentiate which scenario the locating wireless device belongs to. Thus, in the off line training phase, the fitted theoretical log-distance propagation model can not characterize both LOS and NLOS scenarios simultaneously and will result in high distance estimation errors in the ranging step of RSS-based lateration methods, and consequently the localization accuracy is significantly affected. Therefore, in this work we are exploiting using linear regression rather than the theoretical log-distance propagation model to better model the relationship between the RSS and distance to improve localization accuracy for lateration methods.
978-1-4244-4148-8/09/$25.00 ©2009 This full text paper was peer reviewed at the direction of IEEE Communications Society subject matter experts for publication in the IEEE "GLOBECOM" 2009 proceedings.
We choose polynomial regression since polynomials dominate the interpolation theory–Weierstrass’s theorem and they are easy to evaluate [15]. Given the M training points (di , RSSi ) collected in the area of interest, where di is the distance between the wireless device and an access point and RSSi is the corresponding signal strength reading at the training point. We fit the nth-degree polynomial through the set of data and obtain a set of M equations. The ideal nthdegree polynomial should satisfy: dˆi = a0 + a1 ∗ RSSi + a2 ∗ RSSi2 + ... + an ∗ RSSin (5) where aj (with j = 0, 1, 2, ..., n) are the coefficients of the polynomial, RSSi is the received signal strength and dˆi is the estimated distance. However, there are estimation errors ei . Thus, we have: ei = (di − dˆi ) = (di − a0 − a1 ∗ RSSi − ... − an ∗ RSSin ),
(6)
where i = 1, 2, ..., M . We use least squares approximation, in which the coefficients can be obtained by minimizing the sum of the error squares, which is given by E(a0 , a1 , ..., an ) = =
i=M � i=1 i=M �
(ei )2 (di − a0 − a1 ∗ RSSi − ... − an ∗ RSSin )2 .
(7)
i=1
The equation (7) is a function of variables, a0 , a1 , ..., an , which minimizes the sum of error squares. We equate its partial derivatives to zero with respect to a0 , a1 , ..., an . Then, we get ∂E i=M = i=1 −2(RSSij )(di −a0 −a1 ∗RSSi −...−an ∗RSSin ) ∂aj = 0, (8) for each j, with j = 0, 1, 2, ..., n. By rearranging equation (8), we obtain the normal equations: i=M j RSSi di =
a0
i=1 i=M i=1
RSSij +a1
i=M i=1
(j+1)
RSSi
+...+an
i=M i=1
(j+n)
RSSi
,
(9)
for each j, with j = 0, 1, 2, ..., n. Now, the coefficients aj , with j = 0, 1, 2, ..., n, can be solved by Gauss elimination of Equation (9). In our experimental section, we will evaluate the performance of linear regression-based method under different degrees of polynomial in indoor setups.
face the similar propagation environment. For instance, the locations in a regular-sized room are facing the same radio connectivity to the access points (i.e. LOS or NLOS), and similar distance to the access points. Thus, the signal propagation from a local area experiences similar signal attenuation (due to distance) and penetration losses through walls. Therefore, the signal propagation model can be better fitted if we just use the data collected in the local area. Further, experimental results have provided strong evidence that shadow fading is spatially correlated in indoors [16] due to the local area facing similar obstacles. The correlation distance can range from several to many tens of meters [14], [16]. In this work, we explore how the correlated RSS collected in a local area can help to characterize the relationship between RSS and distance, and consequently improve the localization accuracy using lateration methods. We propose a correlation-based method, which utilizes the correlated RSS readings that are collected from a local area to fit the theoretical log-distance propagation model. The objective is to obtain more accurate distance estimations for the wireless device, whose location belongs to that local area, based on the fitted model. Our correlation-based method refines the localization result iteratively by using the correlated RSS in the local area. We start with a coarse-grained location estimation by using all the training data. Then, in the subsequent iterative steps, we gradually reduce the size of the training data by just using the data that is close to the location estimate from the previous step. The iterative process stops when the estimated location falls outside of the local area where the training data comes from. The correlation method is summarized as follows. 1. Initialize. Using all the training points (xj , yj ) and corresponding RSS {RSSij } at multiple access points (xi , yi ), with i = {1, 2, ..., M } and j = {1, 2, ..., N }, to fit the propagation model, and obtain the initial location (xˆ0 , yˆ0 ) according to the measured RSS {RSSi } of the wireless device using the lateration method. 2. Iteration. Refine the wireless device’s location estimation (ˆ xk , yˆk ), k is the kth iteration step, by using top Ck (Ck = Ck−1 /2 in our simulation) closest training points to the previous estimated location (ˆ xk−1 , yˆk−1 ) as training data. Ck is the number of training points used in kth iteration step. 3. Termination. Repeat step 2 until the refined location (ˆ xk , yˆk ) falls outside of the area where the Ck training points come from. Return the wireless device’s final estimated location (ˆ x, yˆ) = (ˆ xk−1 , yˆk−1 ).
III. S IMULATION R ESULTS
C. Correlation Constraint Although the radio propagation is complicated due to the placement of walls, obstacles and movement of people in indoors, the signal propagation from close-by locations in a local area to an access point is highly correlated as they
In this section, we first describe our methodology that is used to simulate the indoor environment. We then present simulation results that evaluate our approaches under indoor conditions.
978-1-4244-4148-8/09/$25.00 ©2009 This full text paper was peer reviewed at the direction of IEEE Communications Society subject matter experts for publication in the IEEE "GLOBECOM" 2009 proceedings.
300
B
C
1
1
0.9
0.9
0.8
0.8
0.7
0.7
0.6
0.6
Room3
CDF
240 Y coordinates (feet)
Room9
180
CDF
Room6
0.5 0.4
Room5 Room2
0.4
0.3
Room8
0.1 0 0
Room4 60
D
Fig. 1.
60
90 Error (feet)
120
150
180
(a) Second degree polynomial
Room1
60
30
120 180 X coordinates (feet)
0.2 0.1 0 0
30
60
90 Error (feet)
120
150
180
Room7
A 0 0
Second degree LLS Second degree NLS Third degree LLS Third degree NLS Forth degree LLS Forth degree NLS
0.3 LLS NLS Regression−based LLS Regression−based NLS
0.2
120
0.5
240
Fig. 2.
(b) Different degrees of polynomial
Regression-based approach: Localization error CDFs.
300
Parameter Value
Simulation layout.
P (d0 ) -40 dBm
γ 2.0
P AF 5.0 dB
σ 3.0 dB
Dc 10 meters
TABLE II D EFAULT PARAMETERS USED IN THE SIMULATION .
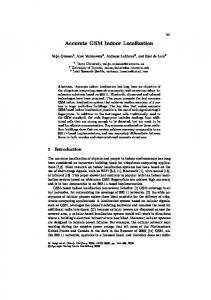
A. Simulation Methodology In our simulation setup, we collected RSS from 100 locations in a 300 feet by 300 feet square field. We deployed four access points at four corners of the square field, shown as the red stars in figure 1. To simulate the indoor structures, we partitioned the whole area into nine districts representing nine rooms. The solid lines in the figure represent the concrete walls. The wireless devices in different rooms encounter different number of walls to reach the access points. In order to simulate the signal propagation in indoors, we add a partition attenuation factor [1] into the shadow fading propagation model in Equation (1): � � d − W ∗ P AF + Xσ . (10) P (d) = P (d0 ) − 10γ log10 d0 The partition attenuation factor P AF is used for a specific obstruction in indoors, such as the wall in our experiment. In our case, P AF represents the penetration loss through one wall and W is the number of walls between the wireless device and the access point. Further, to simulate the spatial correlation of the shadow fading effect, we use a exponential model [17]: E[Xσ (i)Xσ (j)] = σ 2 e−Dij /Dc ,
(11)
where Xσ (i) and Xσ (j) are the shadow fading at location i and j respectively. Dij is the distance between i and j. Dc represents the decorrelation distance, which can range from several meters to many tens of meters [14], [16]. B. Effectiveness of Regression-based Approach We evaluate the accuracy performance using a set of representative parameter setting summarized in Table II. Figure 2 shows the localization results under different degrees of polynomial regression. Figure 2(a) presents the comparison of the Cumulative Distribution Function (CDF) of the localization error between the regression-based method using the second degree polynomial regression and the original lateration methods using the log-distance propagation model. First, we observed that NLS outperforms LLS by 29% (from 51 feet to 36 feet) of the median error in original lateration approaches.
Under the linear regression approach, we found that the regression-based methods significantly improve the localization accuracy of original lateration methods. The performance of LLS is comparable to that of NLS under the regressionbased approach. Specifically, the accuracy improvement on the median error is 45% (from 51 feet to 28 feet) for LLS, and 25% (from 36 feet to 27 feet) for NLS. In addition, the regression-based approach reduces the fraction of poor localization results largely, i.e., the maximum error, which achieves an improvement of 52%, from 156 feet to 75 feet, for LLS and 42%, 120 feet to 69 feet, for NLS. Further, Figure 2(b) shows the performance comparison of using different degrees of polynomial in our regression-based approach. We observed that the CDF curves of using second degree, third degree and forth degree of polynomial regression are mixed together, which indicate that they have similar localization performance on both LLS and NLS. Theoretically, the higher degrees of polynomial can obtain better curve fitting of the training data, but often suffer from overfitting. Thus, high-degree polynomial regression may not result in better results in the ranging step that is used to estimate the distance between a wireless device and an access point. Moveover, compared to lower degree of polynomial regression, the higher degree of polynomial regression involves more computational overhead. C. Effectiveness of Correlation-based Approach Figure 3 shows the comparison of localization error CDFs between the correlation-based method and the original lateration-based methods using the log-distance propagation model. We observed that the correlation-based approach can reduce localization errors. Further, the correlation-based NLS achieves the best performance. In particular, the median error is improved from 51 feet to 35 feet, a 31% increase, for LLS and from 36 feet to 29 feet, a 20% increase, for NLS. And the maximum localization error is reduced from 156 feet to 101 feet for LLS and from 120 feet to 63 feet for NLS, achieving an improvement of 35% and 48% for LLS and NLS respectively.
978-1-4244-4148-8/09/$25.00 ©2009 This full text paper was peer reviewed at the direction of IEEE Communications Society subject matter experts for publication in the IEEE "GLOBECOM" 2009 proceedings.
0.9 0.8 CDF
0.7
CDF
0.6
1
1
0.9
0.9
0.8
0.8
0.7
0.7
0.6
0.6 CDF
1
0.5 0.4
0.4
0.3
0.5
0.3 LLS NLS Regression−based LLS Regression−based NLS
0.2
0.4
0.1
0.3
0 0
LLS NLS Correlation−based LLS Correlation−based NLS
0.2 0.1 0 0
Fig. 3.
30
60
90 Error (feet)
120
150
180
Correlation-based approach: localization error CDFs.
IV. E XPERIMENTAL E VALUATION In this section, we evaluate the effectiveness of our improved methods in a real office building environment using an 802.11 (WiFi) network as well as an 802.15.4 (Zigbee) network. A. Experimental Setup We conducted all experiments in the Wireless Network Laboratory (WINLAB) at Rutgers University. Figure 5 depicts the layout of WINLAB, where the floor size is 219ft by 169ft. We collected data in the yellow shaded area, which belongs to WINLAB. We deployed five access points (APs) which were used to observe packet traffic at fixed locations in our experiment. The location of each access point is shown as a red star in Figure 5 and denoted as A, B, C, D, and E. For the 802.11 (WiFi) network, each access point is a Linux machine with a 1-GHz CPU, 512 MBs of RAM and a 20-GB disk. We used Atheros miniPCI 802.11 wireless cards. Each card was connected to an external 7 dBi Omni directional antenna to monitor packet traffic. Whereas for the 802.15.4 (ZigBee) network, we attached a Tmote Sky mote on each access point, which is used in 802.11 (WiFi) network, and each Tmote Sky mote was connected to an external 7 dBi Omni directional antenna. We configured each attached mote as an access point to monitor the traffic of the 802.15.4 (ZigBee) network. We collected RSS from a total of 101 locations which are shown as green dots in Figure 5 in both networks. The distance between two adjacent locations is from 5 feet to 10 feet. The wireless devices that we used to send packets from 101 locations to access points are a Dell laptop running Linux and equipped with an Orinoco silver card for the 802.11 network, and a Tmote Sky mote for the 802.15.4 network. At each location, we collected 350 packets of RSS and used the averaged RSS for each location. We use the leave-one-out method in RSS-based lateration algorithms, which means that we choose one location as the localizing location whereas the rest of the locations as training data that used to discover the relationship between RSS and distance. B. Performance Evaluation
0.5
20
40
60
80 100 Error (feet)
120
140
(a) 802.11 (WiFi) network
160
LLS NLS Regression−based LLS Regression−based NLS
0.2 0.1 0 0
20
40
60
80 100 Error (feet)
120
140
160
(b) 802.15.4 (Zigbee) network
Fig. 4. Regression-based approach: Localization error CDFs in two networks.
802.11 (WiFi) network and the 802.15.4 (Zigbee) network respectively. We observed that the regression-based methods result in a better performance than original log-distance based lateration methods. This is inline with our simulation results. The overall improvement of median error is above 29% in both networks. Specifically, in the WiFi network, the improvement of median error is 29% (from 21 feet to 15 feet) for LLS and 34% (from 15 feet to 10 feet) for NLS, whereas in the Zigbee network it is 35% (from 29 feet to 19 feet) for LLS, and 32% (from 22 feet to 15 feet) for NLS. In addition, the maximum localization error is significantly reduced. The overall improvement of maximum error is over 50% in two networks. In particular, for LLS, the maximum error is reduced from 155 feet to 56 feet in WiFi and from 145 to 68 feet in Zigbee, whereas for NLS, the maximum error is reduced from 63 feet to 42 feet in WiFi and from 109 feet to 51 feet in Zigbee, respectively. Figure 6 shows the comparison of localization results using different degrees of polynomial regression in two networks. We found that the error CDF curves are mixed together for LLS as well as NLS in two networks. This observation confirms our simulation results and indicates that the higher degree polynomial regression does not help much to improve the localization accuracy in practice. Thus, compared to the higher degree polynomial regression, a degree two polynomial regression gives consistently good performance in both simulation and real experiments. Figure 7 shows the localization error CDFs of correlation-
Fig. 5.
Floor plan of the experimental site.
Figure 4 presents the localization results of the regressionbased methods using the second degree of polynomial for the
978-1-4244-4148-8/09/$25.00 ©2009 This full text paper was peer reviewed at the direction of IEEE Communications Society subject matter experts for publication in the IEEE "GLOBECOM" 2009 proceedings.
1 0.9
0.8
0.8
0.7
0.7
0.6
0.6 CDF
CDF
1 0.9
0.5 0.4
0.4 Second degree LLS Second degree NLS Third degree LLS Third degree NLS Forth degree LLS Forth degree NLS
0.3 0.2 0.1 0 0
0.5
20
40
60
80 100 Error (feet)
120
140
Second degree LLS Second degree NLS Third degree LLS Third degree NLS Forth degree LLS Forth order NLS
0.3 0.2 0.1 0 0
160
(a) 802.11 (WiFi) network
20
40
60
80 100 Error (feet)
120
140
160
(b) 802.15.4 (Zigbee) network
1
1
0.9
0.9
0.8
0.8
0.7
0.7
0.6
0.6 CDF
CDF
Fig. 6. Comparison of localization results using different degrees of polynomial regression.
0.5 0.4
0.3 LLS NLS Correlation−based LLS Correlation−based NLS
0.1 0 0
0.5 0.4
0.3 0.2
20
40
60
80 100 Error (feet)
120
140
(a) 802.11 (WiFi) network
factor and shadow fading. In addition, we conducted experiments using an 802.11 (WiFi) network as well as an 802.15.4 (Zigbee) network in a real office building environment. Our results from both simulation and experiments show that our proposed approach can significantly improve the localization accuracy of RSS-based lateration methods, and thus making the lateration methods applicable to indoors.
160
LLS NLS Correlation−based LLS Correlation−based NLS
0.2 0.1 0 0
20
40
60
80 100 Error (feet)
120
140
160
(b) 802.15.4 (Zigbee) network
Fig. 7. Correlation-based method: Localization error CDFs in two networks.
based methods in the WiFi network and the Zigbee network. We found that the correlation-based approach significantly improves the accuracy of lateration methods in both median error as well as maximum error. The overall improvement of median error is over 33% in two networks. Specifically, the median error is improved from 21 feet to 12 feet in WiFi, and from 29 feet to 19 feet in Zigbee for LLS, whereas it is improved from 15 feet to 10 feet in WiFi and from 22 feet to 14 feet in Zigbee for NLS. On the other hand, in terms of the poor localization results, the maximum error is reduced from 155 feet to 92 feet and from 145 feet to 95 feet in WiFi and Zigbee respectively for LLS, while it is reduced from 63 feet to 43 feet in WiFi and from 109 feet to 73 feet in Zigbee for NLS, achieving an overall improvement over 32%. V. C ONCLUSION In this work, to overcome the obstacle that lateration methods employing Received Signal Strength (RSS) are sensitive to unpredictable indoor environments, we proposed two methods to improve the localization accuracy of lateration methods, namely regression-based and correlation-based. For the regression-based method, we utilized linear regression to discover the relationship between RSS and the distance from a wireless device to an access point to improve the localization accuracy. Whereas we exploited the characteristic of the correlation of RSS in close-by locations to find a better fit of the signal propagation model in the correlation-based approach. To validate the effectiveness of our improved methods, we simulated indoor conditions including partition attenuation
R EFERENCES [1] P. Bahl and V. N. Padmanabhan, “RADAR: An in-building RF-based user location and tracking system,” in Proceedings of the IEEE International Conference on Computer Communications (INFOCOM), March 2000, pp. 775–784. [2] Y. Chen, J. Francisco, W. Trappe, and R. P. Martin, “A practical approach to landmark deployment for indoor localization,” in Proceedings of the Third Annual IEEE Communications Society Conference on Sensor, Mesh and Ad Hoc Communications and Networks (SECON), September 2006. [3] J. Yang and Y. Chen, “A theoretical analysis of wireless localization using RF-based fingerprint matching,” in Proceedings of the Fourth International Workshop on System Management Techniques, Processes, and Services (SMTPS), April 2008. [4] K. Kleisouris, Y. Chen, J. Yang, and R. P. Martin, “The impact of using multiple antennas on wireless localization,” in Proceedings of the Fifth Annual IEEE Communications Society Conference on Sensor, Mesh and Ad Hoc Communications and Networks (SECON), June 2008. [5] K. Langendoen and N. Reijers, “Distributed localization in wireless sensor networks: a quantitative comparison,” Comput. Networks, vol. 43, no. 4, pp. 499–518, 2003. [6] D. Niculescu and B. Nath, “Ad hoc positioning system (APS),” in Proceedings of the IEEE Global Telecommunications Conference (GLOBECOM), 2001, pp. 2926–2931. [7] N. Patwari, J. Ash, S. Kyperountas, I. Hero, A.O., R. Moses, and N. Correal, “Locating the nodes: cooperative localization in wireless sensor networks,” Signal Processing Magazine, IEEE, vol. 22, no. 4, pp. 54–69, July 2005. [8] Y. Chen, W. Trappe, and R. Martin, “Attack detection in wireless localization,” in Proceedings of the IEEE International Conference on Computer Communications (INFOCOM), April 2007. [9] Y. Wang, X. Jia, and H. Lee, “An indoors wireless positioning system based on wireless local area network infrastructure,” in Proceedings of the 6th International Symposium on Satellite Navigation Technology Including Mobile Positioning and Location Services, 2003. [10] G. Retscher and Q. Fu, “Integration of rfid, gnss and dr for ubiquitous positioning in pedestrian navigation,” Journal of Global Positioning Systems, vol. 6, pp. 56–64, 2007. [11] A. Varshavsky, D. Pankratov, J. Krumm, and E. de Lara, “Calibree: Calibration-free localization using relative distance estimations,” in Proceedings of the Sixth International Conference on Pervasive Computing (Pervasive 2008), May 2008. [12] J. Yang, Y. Chen, V. Lawrence, and V. Swaminathan, “Robust wireless localization to attacks on access points,” in IEEE Sarnoff Symposium 2009, Princeton , NJ, USA. [13] S. Ghassemzadeh, L. J. Greenstein, A. Kavcic, T. Sveinsson, and V. Tarokh, “An empirical indoor path loss model for ultra-wideband channels,” Journal of Communications and Network, vol. 5, pp. 303– 308, 2003. [14] M. Gudmundson, “Correlation model for shadow fading in mobile radio systems,” Electronics Letters, vol. 27, pp. 2145–2146, 1991. [15] J. L. Buchanan and P. R. Turner, Numerical Methods and Analysis. New York: McGraw-Hill, 1992. [16] N. Jalden, P. Zetterberg, B. Ottersten, A. Hong, and R. Thoma, “Correlation properties of large scale fading based on indoor measurements,” in Wireless Communications and Networking Conference, 2007.WCNC 2007. IEEE, March 2007. [17] M. Gudmundson, “Correlation model for shadow fading in mobile radio systems,” Electronics Letters, vol. 27, pp. 2145–2146, Nov. 1991.
978-1-4244-4148-8/09/$25.00 ©2009 This full text paper was peer reviewed at the direction of IEEE Communications Society subject matter experts for publication in the IEEE "GLOBECOM" 2009 proceedings.