positioning and neural network based deep learning. ... Assuming fixed positions, a graph can be derived similar to the .... exit sign or clock, a large initial scale of anchor may lead to bad training result of the RPN and to low detection rate,.
Indoor Localization using Region-based Convolutional Neural Network Haowei Xu, Visiting Scholar, The Ohio State University, Zoltan Koppanyi, Post-Doctoral Researcher, The Ohio State University, Charles K. Toth, Research Professor, Dorota Brzezinska, Professor, The Ohio State University BIOGRAPHY Haowei Xu is a Ph.D. student at Northwestern Polytechnical University and a visiting scholar at The Ohio State University. He received M.Sc in Information and Communication Engineering at Northwestern Polytechnical University. He also received a B.Sc. degree in Spatial information and digital technology at Xidian University. His research interest covers several fields as GNSS receiver design, multi-source integrated navigation system, LiDAR positioning and neural network based deep learning. Zoltan Koppanyi is a post-doctoral researcher at The Ohio State University. He received M.Sc. in Land Surveying and GIS Engineering, and Ph.D. in Earth Sciences at the Budapest University of Technology and Economics (BME). His research interests cover several fields of positioning, navigation and tracking in GNSS-denied or corrupted environments, such as LiDAR and image-based tracking, positioning with signal of opportunity or ultra-wide band signals, sensor fusion and intelligent-based navigation. Charles K. Toth is a Research Professor at the Department of Civil, Environmental and Geodetic Engineering, The Ohio State University. He received a M.Sc. in Electrical Engineering and a Ph.D. in Electrical Engineering and GeoInformation Sciences from the Technical University of Budapest, Hungary. His research expertise covers broad areas of 2D/3D signal processing, spatial information systems, high-resolution imaging, surface extraction, modeling, integrating and calibrating of multi-sensor systems, multi-sensor geospatial data acquisition systems, and mobile mapping technology. Dorota A. Grejner-Brzezinska is a Professor in Geodetic Science, and director of the Satellite Positioning and Inertial Navigation (SPIN) Laboratory at The Ohio State University. Her research interests cover GPS/GNSS algorithms, GPS/inertial and other sensor integration for navigation in GPS-challenged environments, sensors and algorithms for indoor and personal navigation, Kalman filter and non-linear filtering. She published over 250 peer reviewed journal and proceedings papers, and five book chapters on GPS and navigation. ABSTRACT A novel indoor localization concept is introduced in this study. The navigating user takes an image inside a building to determine its own position. In the first step, this image is passed to a trained R-CNN that recognizes and localizes various types of objects in the image, such as doors, windows, signs, trash bins. Typically, the R-CNN output is a set of boxes representing the regions of the objects in the image, and their classification scores. The spatial relationships of these objects can be derived based on the box locations in the image and they can be represented as a directed graph, where the directions of the edges are the relationships, e.g., right-left, up-down. This graph is called image graph. The next step of the localization requires prior knowledge, basically the building model, obtained by blueprint or surveying, as the location of the used objects must be known. Assuming fixed positions, a graph can be derived similar to the image graph, but it is generated based on the building map. This graph is called position graph. Each unique position inside the building has its own position graph. Finally, the user location is obtained by measuring the similarity between the image graph and the stored position graphs. To prove the concept, a test was conducted in a typical yet challenging building. Images of selected objects were taken at randomly chosen locations around the test area. Correct solution was found in the 40.5% of the cases with 5-10 m accuracy; the failure rate was 14.3%; the rest 45.2% produced multiple solutions. Note that the system is fail-safe at 85.7%. The concept also allows deriving the direction of the image; the results suggest a 45-60º accuracy.
INTRODUCTION As opposed to outdoor or underwater applications, where GNSS and GNSS/IMU or acoustic ranging are the typically applied technologies, there is no standard approach for indoor localization. However, several methods are developed and applied successfully for various applications. WiFi or mobile networks are commonly used for indoor positioning or localization, because WiFi access points (AP) or mobile network towers are already installed, and thus, no system hardware has to be deployed [1, 2]. There are two main approaches for these systems to be applied for indoor localization, namely ranging based on radio frequency (RF) signal loss and fingerprinting. The drawback of the signal loss-based ranging system is that it requires the accurate position of the transmitter and the knowledge of several other system parameters, such as the transmitted signal strength. In addition, the environment, walls and other obstacles have significant impact on the loss, and thus, all of these parameters have to be considered to derive accurate position, which increases the complexity of the system. For these reasons, the simpler fingerprinting solutions are more popular, however, these methods require the mapping of the signal distribution around the indoor area. These surveys typically take long time. In addition, for both approaches, the system configuration might change. In these cases, the time and cost investments of the system are increasing and the reliability of the system is decreasing. RFID and UWB indoor positioning is also commonly used, however, these solutions have significantly larger costs due to the special hardware on the network, as well as on the user side [2, 3]. Image-based localization provides cost efficient alternative in those indoor applications, where the goal is to provide approximate locations within a building; for instance, finding rooms in hospitals, nursing rooms, universities and institutions, or providing location-based information about objects, areas at museums or conferences. One of the main advantage of the image-based localization solutions that smartphones equipped with cameras are commonly available, and thus, no special hardware is required on the user side. Nowadays, one popular solution is to place QR tags around the area and the location or other information can be obtained by a smartphone with scanning these tags. Note, this localization approach is a proximity sensing type localization similar to Bluetooth or RFID localization. In another approach, images are acquired around the indoor area, and the feature descriptors are extracted, for example, by SIFT, and stored in a database. When the user wants to obtain the location, it uploads the image taken around his/her location to a webserver that matches the features found in the user image with the webserver’s database. This study was inspired by the latest results of the annual ImageNet Large Scale Visual Recognition Challenge (ILSVC). In this competition, the algorithms solve various image perception problems, such as object detection and localization in images or videos, as well as object classification and scene interpretation [4]. These algorithms are based on deep neural networks (DNN) and have already achieved the same ~5% success rate as humans in image labeling problems [5]. Our goal here is to exploit these achievements for navigation purposes. The basic idea of this study is to use these DNNs to extract and recognize objects from images. The high level concept of the proposed system is shown in Figure 1. The user captures an image with his/her smartphone, then this image is uploaded to a webserver that processes it. The objects in the image with their relationships are extracted. The map of the objects is available on the server, thus the extracted image objects can be matched to the map and the user location can be obtained. Unlike SIFT-based image matching, this concept does not require pre-survey around the area, since the DNN is “universal”, in other words, the network is trained on large image datasets independently from the area, and thus, it is able to identify large number of various objects, irrespective to the specific area. The concept only requires the map of the possible objects that can be derived from blueprints or building models. Thus, this system also offers faster deployment as opposed to other techniques. The paper is structured as follows. In the “Methods” section, the Region-based Convolutional Neural Networks (RCNN), which is used for object extraction, are introduced briefly. Then, the concept of the image and position graphs is presented. These structures represent the relationships of the objects in the image. The image graph is generated from recognized objects in the image, while the position graph is created based on the map of the objects. The two graphs are compared based on a similarity measure for obtaining the location that is presented at the end of the “Methods” section. In order to validate the performance of the proposed system, test data were collected, and the “Test” section presents the description of our experiment. The “Results and Discussions” section provides the results of the test. Finally, the “Conclusion” section summarizes our findings and future plans.
Figure 1 The high level concept of the proposed localization system. METHODS Object Detection with Region-based Convolutional Neural Network Originally, Artificial Neural Network (ANN) was inspired by the human brain neuron structure. ANN is able to approximate linear or complicated non-linear systems (universal approximator), therefore it is widely used in several fields, such as control, classification and estimation. Neural networks have been used for a long while, yet the range of their applications was somewhat limited, because neither huge training sets nor large computation capacity was available in the past. The recent availability of large datasets, such as from the social web, and then the computation power of cloud technologies have allowed constructing and training neural networks with very large number of neurons, called deep neural networks (DNN). These networks have already been successfully applied to problems that have no exact solution and/or require cognitive thinking, such as text translation, speech recognition, handwriting interpretation, and sign language understanding. Convolutional Neural Network (CNN) is a version of DNN, primarily developed for image processing and classification [6]. Typically, the input of the CNN network is the array of image pixels. The network structure utilizes a convolution layer that has several kernels, covering all the pixels in the image. Each kernel has a connection to a neuron in the subsampling layers. Due to this arrangement, the network is able to recognize local and holistic relationships of image patterns, which improves the recognition accuracy, and the weight sharing mechanism. CNN is commonly used for image classification or labeling problems. This problem is simple for humans; recognizing what is on the picture and label it. According to this problem definition, the input layer of CNN is the array of image pixels, and the output vector contains the scores or weights that indicates the class or label to which the image belongs. CNN typically labels the whole image and does not segment it into smaller objects. Region-based CNN (R-CNN), proposed by Girshick et al. [7], enables segmenting the image into regions, and thus, multiple objects can be localized, detected, and recognized in a single image. For an example, in Figure 2 the red rectangles depict the segmented regions, which are recognized as doors in this case. Several R-CNN implementations exist, such as Fast R-CNN and Faster R-CNN algorithms, see [8, 9], respectively. In this study, Faster R-CNN is used for detecting objects in images taken by a single smartphone. The latest version of Faster R-CNN consists of a Region Proposal Network (RPN) and a Fast R-CNN. RPN is used to provide proposals and distinguish between background and objects for the Fast R-CNN. Due to this structure, feature extraction, classification and proposal position refinement are integrated into one deep network, which further leads to improved detection rate and training speed. Such a system has several parameters that have to be chosen properly to achieve the best performance. Here, three main parameters, namely (1) anchor scale, (2) non-maximum suppression (NMS) threshold overlap, and (3) box extracting threshold, are discussed. Anchor scale (1) specifies the initial size of the objects being recognized. For each input image, the RPN layer will generate multiple anchor centers, and each of the centers generates nine anchors with
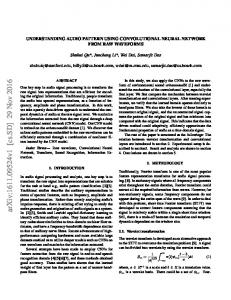
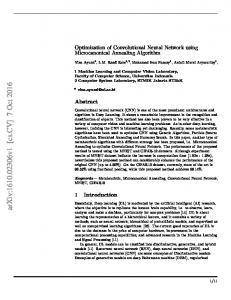
different scale and ratio. For example, due to the different size of classes, especially for some smaller objects, such as exit sign or clock, a large initial scale of anchor may lead to bad training result of the RPN and to low detection rate, consequently. NMS overlap threshold (2) determines whether the candidate regions are merged into one object or kept separated. The raw output of the R-CNN is a set of regions with their labels and scores, and the same object might be recognized and segmented multiple times. Clearly, in these situations, one of the regions has to be chosen to avoid multiple detection. If two regions are close to each other and they are categorized to the same object type, then the NMS overlap threshold decides which box will be deleted based on the ratio of the overlapping areas. In Figure 3, there are different detection results for the same class when three different NMS overlap thresholds applied. Note, when the overlap threshold is 0.5, the middle door was detected twice in the right side of the figure. In contrast, in the middle of the figure, the threshold is 0.1, and three doors are identified from out of four. In the left part of the figure, the threshold is 0.3, and all four doors are segmented successfully. Box extracting threshold (3) is another key parameter that determines whether a region is detected based on its score. For some of the classes, the small size or varying shapes may result in a low detection weight, and, consequently, this threshold should be carefully set for the proper detection rate. In the preliminary examination, a pre-trained network, based on the dataset of VOC2007 with 20 classes, see [11], was used for extracting objects from images, but the detection rate was so low that it did not allow any kind of localization. There are two main reasons for this negative result. The development of the used R-CNN model was at the early stage; its detection rate was expected to increase in the future. On the other hand, the pre-trained CNN was trained to solve general image labeling problems, and thus, it also contains many special classes that are not present in a typical indoor environment; for instance, animals, vehicles, etc. In the future, we plan to train a network, dedicated to detecting indoor objects. In order to improve the detection performance, a parallel Faster R-CNN is proposed, see Figure 1. In this case, several Faster R-CNN networks are trained separately for each class. During the detection, all Faster R-CNNs process the image in parallel, and the results of the R-CNNs are merged to provide a composite output with all detected classes. Different training and testing parameters are used for each R-CNN. In addition, when a new class is needed to be detected, instead of having the traditional Faster R-CNN re-trained by the whole dataset requiring large computation, another parallel sub-Faster R-CNN is added to the system, which is trained by a small training set containing only the specific class. Image and position graphs Image graphs are used for describing the spatial relationships and connections of the objects detected in the images. The nodes of the graph represent the regions with the type of the detected objects, such as doors, lights; and the edges of the graph are annotated with direction values that describe the relative position of the centers of the regions, see Figure 4. The directions are evaluated from left to right in the images. The edge is annotated with the direction values based on the upper right part of Figure 4. The table representation of the graph is shown in the lower right part of the figure. The position graph, created from the building map contains the digitized objects. Some of the digitized objects on the blueprint are shown in the left side of Figure 5, where doors are depicted with red and a trash bin marked by black dots, respectively. The height information is simply chosen based on that the object is likely appear in the lower, middle or the upper part of a picture. Thus, the trash bin is likely to be in the lower part, and a door is likely to be localized in the middle part of an image. For example, placing a camera at the point of the intersection of the red and green lines on the map, an image can be generated with projecting the positions of the objects onto the camera’s image plane depicted by green line in the figure. The generated image can be seen in the right side of Figure 5. Then, a position graph is created similarly as it was presented for the image graph, just using this generated images. These position graphs can be derived at various positions and with various directions in the area and stored in a database. Then, during the localization, the image taken by the user is sent to the system that calculates the image graph. The image graph is compared to all position graphs in the database. The closest position graph is selected based on a similarity measure, and the known location is delivered to the user.
NMS Overlap Threshold = 0.5
NMS Overlap Threshold = 0.1
NMS Overlap Threshold = 0.3
Figure 2 An example of various NMS overlap thresholds. Anchor Scale
NMS overlap threshold
Weight threshold
Faster R-CNN
RPN
Fast R-CNN
Boxes filtering I : 0.962
O : 0.838
… … Anchor Scale
NMS overlap threshold
Weight threshold
Faster R-CNN
RPN
Fast R-CNN
Boxes filtering
Figure 3 The concept of parallel Faster R-CNN.
Figure 4 An image with the segmented regions, marked by green rectangles, and the image graph with red lines, including the direction values in the boxes (left); the direction values based on relative positions (upper right figure), and the table representation of the graph (lower right).
Figure 5 The digitized objects with red and black dots in the blueprint and the camera plane and direction with green and red lines (left), and the generated image (right). At this point, one can use the generated image directly and the region centers. The reason for the position and image graphs is that no camera parameters or metrics are assumed. The relationships between objects allow using “metrics free” system. It is essential as we assume no prior knowledge of any dimension of the map. The coordinates of the digitized objects are in the map coordinate frame in pixels. The height value can be simply grouped into three values whether the object is on the lower, middle or upper part of the image. Similarity measure The proposed similarity measure includes three terms:
‖𝑷 − 𝑰‖ = 𝑤1
∑
‖𝑒(𝑷, 𝑖, 𝑗) − 𝑒(𝑰, 𝑘, 𝑙)‖2 + 𝑤2 𝑛(𝑰) + 𝑛(𝑷) −
∑
}
𝑖,𝑗∈1..𝑛(𝑷) 𝑘,𝑙 ∈1..𝑛(𝑰) ∃𝑒(𝑷,𝑖,𝑗),∃𝑒(𝑰,𝑘,𝑙) 𝑛(𝑃,𝑖)=𝑛(𝐼,𝑘) 𝑛(𝑃,𝑗)=𝑛(𝐼,𝑙)
𝑖,𝑗∈1..𝑛(𝑷,) 𝑘,𝑙 ∈1..𝑛(𝑰) ∃𝑒(𝑷,𝑖,𝑗),∃𝑒(𝑰,𝑘,𝑙) 𝑛(𝑃,𝑖)=𝑛(𝐼,𝑘) { 𝑛(𝑃,𝑗)=𝑛(𝐼,𝑙)
+ 𝑤3
∑ 𝑖,𝑗∈1..𝑛(𝑷) 𝑘,𝑙 ∈1..𝑛(𝑰) ∃𝑒(𝑷,𝑖,𝑗),∃𝑒(𝑰,𝑘,𝑙) 𝑛(𝑃,𝑖)=𝑛(𝐼,𝑘) { 𝑛(𝑃,𝑗)=𝑛(𝐼,𝑙)
{
2
}
(1)
𝜋[𝑛(𝑷, 𝑖), 𝑛(𝑷, 𝑗)] ,
}
where 𝑃, 𝐼 are the position and image graphs, respectively, 𝑛(𝐺) is a function that returns the number of nodes in the 𝐺 graph, 𝑛(𝐺, 𝑖) is the value of the 𝑖th node in 𝐺 graph, 𝑒(𝐺, 𝑖, 𝑗) returns a vector of the direction values between the 𝑖th and 𝑗th node in the 𝐺 graph, and 𝜋[𝑛1 , 𝑛2 ] is the frequency of the edge between 𝑛1 , 𝑛2 nodes. This frequency is calculated based on how many often an edge with 𝑛1 , 𝑛2 nodes appear in the position graph database. The 𝑤𝑖 values are responsible for normalizing and weighting the three terms. Note, the first component measures all the direction differences of those edges that have same node values, thus it takes into account the direction similarity of the object relationships. The second term is the number of those edges that has no correspondence in the image and position graphs. The third term measures the uniqueness of an edge. This
is calculated based on how many times an edge appears in the position graph database with the same nodes. For instance, edges between doors are very often represented in the database, as opposed to those edges of that nodes of a special object, which is very rare. This increases the localization accuracy because once a special object or special object connection is found, it will restrict the possible set of position graphs, and thus, locations. TEST In order to examine the performance of the proposed indoor localization method, a test was conducted in two floors of the Bolz Hall at The Ohio State University. The Caffe neural network library and framework was used for the RCNN implementation [10]. To build up the parallel Faster R-CNN for the objects in Bolz Hall, 600 images were taken randomly with a smartphone camera. 10 classes, such as doors, lights and trashe bins, were labeled in the images. Table 1 shows the parameter value applied for the classes in the corresponding sub Faster R-CNN. In order to compare the detection performance between the parallel Faster R-CNN and the Faster R-CNN, a 10-class Faster R-CNN is also trained by the same 600 image dataset. Figure 6 shows all the 142 objects digitized from a blueprint for the two floors. Lights, doors and any other objects are depicted with blue, red and black triangles, respectively. Note, the floors are very similar in terms of object locations and diversity, and thus, it is a challenging environment for the algorithm. In order to create the position graph database, the virtual camera positions are placed along the center of the corridors with an about 5 m separation to derive position graphs. At certain positions, the virtual camera direction was also changed by 25º steps around the vertical axis to complete a 360º turn. Thus, the database contains 3154 position graphs. For validation, 42 images were taken randomly around the area with a single smart phone. Table 1 Parameter settings in parallel Faster R-CNN
Parameters Anchor Scale NMS Overlap Threshold Boxes Extracting Threshold
Door [D]
Light [L]
Clock [K]
Lock[O ]
Trash bin [T]
Fire Extinguisher [F]
Exit [E]
Water Fountain [W]
Bench [B]
Vendor [V]
128×128, 256×256, 512×512
64×64, 128×128, 256×256
128×128,2 56×256,51 2×512
128×128,2 56×256,51 2×512
64×64, 128×128, 256×256
128×128,2 56×256,51 2×512
32×32 64×64, 128×128,
64×64, 128×128, 256×256
128×128,2 56×256,51 2×512
128×128,2 56×256,51 2×512
0.3
0.5
0.6
0.6
0.7
0.45
0.7
0.7
0.6
0.6
0.75
0.65
0.45
0.92
0.85
0.75
0.65
0.9
0.9
0.9
Figure 6 The digitized objects on the blueprints for the two floors.
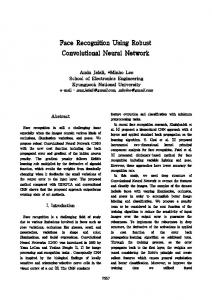
RESULTS AND DISCUSSIONS The proposed localization algorithm requires at least one extracted object, but preferably more than one objects for considering relationships. For this reason, it is important to investigate how many objects can be extracted with the proposed R-CNN. The left side of Figure 7 shows the results of the detection rate using the 42 images from the validation dataset in the case of the Faster and parallel Faster R-CNNs. The figure clearly shows that the proposed parallel approach achieves better detection rates. Especially for the classes of ‘Exit’, ‘Vending machine’ and ‘Lock’, the detection rate is significantly higher. These are those objects that are very unique around the area, and thus, the reliable detection of these objects improve the localization. The right side of Figure 7 shows the distribution of the number of the detected objects with respect to the number of images. Note that the parallel Faster R-CNN outperforms the Faster R-CNN. There were no cases when no objects were identified. More than one objects are detected in the 90%, and more than two are segmented in the 80% of the cases. Figure 8 demonstrates three typical localization solutions. The left side of the figure presents the images used by the algorithm and the detected regions and objects with various colors. The right side of the figure shows the most likely location or locations with blue dots on the blueprints of two floors based on the similarity measure presented earlier. A correct solution can be seen in the first row of the figure. In this case, large number of objects were detected with unique relationships. The middle part shows an example, when two main locations were obtained due to the small number of extracted objects. As the water fountain is not a typical object, because only one can be found at each floor, consequently, the algorithm was able to locate two possible places. The multiple locations were found in many other cases due to the same structure of the floors. In the last row, multiple locations are found, even multiple objects were identified, due to the very common pattern of object locations. Note that the R-CNN is mostly identified objects when they appeared in the front of the image. The objects in the background are barely detected. Table 2 presents the various results based on the 42 images. Correct solution was found in the 40.5% of the cases; the failure rate is 14.3%; the rest 45.2% is ambiguous. Note that the ambiguous cases can be detected, and thus, the system is fail-safe in the case of 85.7%. Furthermore, if multiple solutions are derived, then the user can be asked to provide additional image at the same position, but, say, from another angle to determine exact solution. The positioning accuracy is about 5-10 m when the correct position is found. The position graph approach also allows deriving the approximate direction of the image; it is about at the 45-60º accuracy level when the correct position is resolved. The examination of the weights in Equation 1 suggests that the most relevant similarity term is the second one that describes the similarity of the position and image graph without the directions. However, it also encapsulates the leftright relationship due to the facts that the objects are connected from left to right. This measure also contains the complexity of the scene; i.e. how many objects are located around. If the position graph is large, thus has many edges, a smaller number of objects can be extracted from the images than when the similarity between the graphs is lower, leading to multiple solutions.
Figure 7 Performance of the versions of R-CNN
Figure 8 Three typical positioning solutions: one solution (up), floor ambiguity (middle), multiple locations (bottom)
Table 2 Solution types and rates
Solution Types Rate
Exact Wrong 40.5% 14.3%
Multiple Floor Ambiguous 23.8% 21.4%
CONCLUSION This study is the first attempt to use R-CNN to extract visual clues as objects from images, and then to use these clues for indoor localization. The advantage of using deep neural networks is that they can be trained on large, general datasets, and thus, the learnt classes can be extracted from any image. We tried to use one pre-trained network, however, it did not provide the desired result. In order to increase the object detection rate, a parallel Faster R-CNN was proposed and trained for ten typical indoor classes, such as doors, lights. This network structure was able to detect one or more objects for the 90% of the images based on the validation dataset. The position and image graph concept, presented here describes the relationship between the extracted objects. These graphs are used for localization based on measuring the similarity of the image graph and the stored position graphs. A test was conducted to evaluate the performance of the proposed system. The results suggest that correctness of the final solution depends on several factors: the number, uniqueness and success rate of the detected objects, the object complexity of the environment, and the image distortion due to the image formation. In tests, 40.5% of the images were localized correctly. 23.8% of the images resulted in correct but multiple solutions. Most of the indoor localization techniques, including WiFi, GSM fingerprinting, require the measurement of the environment prior to the system goes live. In many cases, the user also has to carry somewhat special equipment, such as UWB or RFID units. The proposed method offers a significantly simpler solution, compared to the aforementioned approaches, as the prior environment mapping is easy, and then the image processing for localization is a fast process. REFERENCE [1] Kupper, A., 2005, Location-Based Services: Fundamentals and Operation, Wiley, p. 386 [2] Liu, H., Darabi, H., Banerjee, P., and Liu, J., 2007, Survey of Wireless Indoor Positioning Techniques and Systems, IEEE Transactions on Systems, Man, and Cybernetics, Part C (Applications and Reviews), Vol 36, Issue 6, pp. 1067-1080 [3] Koppanyi, Z., and Toth, C. K., 2014, Indoor Ultra-Wide Band Network Adjustment Using Maximum Likelihood Estimation, ISPRS Annals of the Photogrammetry, Remote Sensing and Spatial Information Sciences, Volume II-1, 2014 [4] Russakovsky, O., Deng, J., Su, H., Krause, J., Satheesh, S., Ma, S., Huang, Z., Karpathy, A., Khosla, A., Bernstein, M., Berg, A. C., and Fei-Fei, L., 2015, ImageNet Large Scale Visual Recognition Challenge. IJCV, 2015. [5] Website: http://karpathy.github.io/2014/09/02/what-i-learned-from-competing-against-a-convnet-on-imagenet/, Nov, 2016 [6] Ren, S., He, K., Girshick, R., & Sun, J. (2015). Faster R-CNN: Towards real-time object detection with region proposal networks. In Advances in neural information processing systems, pp. 91-99. [7] Ross, G., Donahue, J., Darrell, T., Malik, J., 2014, Rich feature hierarchies for accurate object detection and semantic segmentation, Proceedings of the IEEE conference on computer vision and pattern recognition. 2014. [8] Ross, G., 2015, Fast R-CNN, Proceedings of the IEEE International Conference on Computer Vision. 2015. [9] Krizhevsky, A.; Sutskever, I.; Hinton, G. E. Imagenet classification with deep convolutional neural networks. Advances in Neural Information Processing Systems. 2012, 1: 1097–1105.
[10] Jia, Y., Shelhamer, E., Donahue, J., Karayev, S., Long, J., Girshick, R., Guadarrama, S., and Darrell, T., 2014, Caffe: Convolutional Architecture for Fast Feature Embedding , MM '14 Proceedings of the 22nd ACM international conference on Multimedia, pp. 675-678 [11] Website: http://host.robots.ox.ac.uk:8080/pascal/VOC/voc2007/, Nov, 2016