Dec 9, 1988 - Polyinosinic-Polycytidylic Acid on Bleomycin-. Induced Lung Fibrosis in Hamsters. Morphologic and Biochemical Evidence. SHRI N. GIRI, BVSc ...
American Journal of Pathology, Vol. 133, No. 3, December 1988 Copyright © American Association of Pathologists
A meliorating Efect of an Interferon Inducer Polyinosinic-Polycytidylic Acid on BleomycinInduced Lung Fibrosis in Hamsters Morphologic and Biochemical Evidence
SHRI N. GIRI, BVSc, PhD, and DALLAS M. HYDE, PhD
From the Departments of Veterinary Pharmacology and Toxicology and Anatomy, School of Veterinary Medicine, University of California, Davis, California
The effects of polyinosinic-polycytidylic acid (Poly I: C), an inducer of interferons, on bleomycin (Bleo)-induced lung fibrosis was studied in hamsters. Poly I:C (10 mg/kg intraperitoneally) was administered for two days and immediately before intratracheal instillation of bleomycin (7.5 U/kg) or an equivalent volume ofsaline and thereafter daily for 13 days. The lung hydroxyproline in control, Poly I:C, Bleo, and Bleo + Poly I:C groups averaged 791, 752, 1177, and 766 jAg/ lung. As compared to control, the prolyl hydroxylase activity in the Bleo group was increased by 83% whereas in Bleo + Poly I:C group, the activity was increased by 42%. Protein in the bronchoalveolar lavage supernatant in Poly I:C, Bleo and Bleo + Poly I:C groups were 72, 286, and 206% of the control, respec-
tively. There was no difference in total leukocyte counts between Bleo + Poly I:C and Bleo groups, but the differential cell counts were changed. The numbers of neutrophils, monocytes, lymphocytes, and eosinophils were 50, 84, 91, and 10% of Bleo group, respectively. Morphometric estimates of the volume of parenchymal lesion within the lung showed that hamsters in Bleo + Poly I:C group had significantly less volume of lesion (1.0 cucm) than the Bleo group (1.6 cucm). In addition, the fibrotic lesions in Bleo + Poly I:C group were multifocal and primarily proximal acinar in location, had fewer extracellular fibers, neutrophils and monocytes. Poly I:C treatment ameliorated bleomycin-induced lung collagen accumulation. (Am J Pathol 1988, 133:525-536)
FIBROTIC LUNG DISEASES, regardless of the cause, are characterized by an excessive accumulation of collagen in the lung.' These diseases are characterized by derangements of the alveolar wall comprised of accumulations of mesenchymal cells and connective tissue. 2 At present, there is no effective treatment for lung fibrosis and this is partly attributed to our lack of understanding of the regulation of collagen metabolism. However, numerous studies have demonstrated that the metabolic functions of the fibroblasts responsible for collagen synthesis and deposition are affected by various factors including inflammation,3 pharmacologic agents,4 proteases,5 lipid,6 nutritional,7 and immunologic status8 of the animals. A variety of animal models have been developed to produce interstitial pulmonary fibrosis (IPF). In this regard intratracheal instillation of bleomycin, an anti-
neoplastic drug, is frequently employed to produce experimental models of lung fibrosis.9-" The lung fibrosis produced in these models provide a reasonable similarity to IPF seen in humans.9 0"12 A large number of compounds have been tested for their ability to prevent or ameliorate lung fibrosis induced by bleomyA preliminary report of this research was presented at the 27th Annual Meeting of the Society of Toxicology at Dallas, Texas, February 15-19, 1988, and published in abstract form (1988, Toxicologist 8: 1OA). Supported by National Heart Lung and Blood Institute Grant No. 5R01 HL-27354-07. Accepted for publication August 4, 1988. Address reprint requests to Professor Shri N. Giri, Department of Veterinary, Pharmacology and Toxicology, School of Veterinary Medicine, University of California, Davis, CA 95616.
525
526
GIRI AND HYDE
cin.10,13-15 It is unfortunate that systemic toxicity resulting from the long-term uses of these compounds have precluded their uses in therapeutic situations. We have previously demonstrated that treatment with recombinant murine interferon gamma (IFN-y) caused a significant reduction in the number of fibroblasts per volume oflesion in lung and collagen accumulation in the bleomycin-mouse model of lung fibrosis;'6"7 however, lack ofcommercial availability of IFN-,y did not allow an extensive evaluation of this lymphokine against pulmonary fibrosis in the animal model. Therefore, we have taken an alternative approach, by investigating the effect of treatment with polyinosinic-polycytidylic acid (Poly I:C), an inducer of interferons, 18,19 on the lung collagen accumulation in the bleomycin-hamster model of lung fibrosis. The data presented in this paper clearly demonstrate that treatment with Poly I:C completely ameliorated the lung collagen accumulation in the bleomycin-hamster model of pulmonary fibrosis.
Materials and Methods Male Golden Syrian hamsters weighing 90-120 g were purchased from Simonsen, Inc. (Gilroy, CA). The animals had free access to Purina Lab Chow and water ad libitum. Bleomycin sulfate (Blenoxane®) was a generous gift from Bristol Laboratories (Division of Bristol Myers Co, Syracuse, NY). L-Proline, [3,4-3H] (specific activity 50 Ci/mmol) was purchased from ICN Radiochemicals (Irvine, CA) and L-[3H(G)] hydroxyproline (specific activity 5.0 Ci/mmol) from New England Nuclear (Boston, MA). Hydroxyproline was obtained from Cal Biochem (San Diego, CA). Sodium salt of polyinosinic-polycytidylic acid (Poly I:C) and dimethylaminobenzaldehyde (purity > 99%) were from Sigma Chemical Co. (St. Louis, MO). All other reagents were of analytical grade and purchased from standard commercial sources. Treatment of Animals The hamsters were acclimated for at least 1 week in the Animal Housing Facility before starting the experiment. Poly I:C and bleomycin (Bleo) sulfate solutions were made in sterile isotonic saline just before administration. Hamsters were randomly assigned to four treatment groups as follows: Group 1 (control), intratracheal instillation of isotonic saline (5 ml/kg) and saline (5 ml/kg IP) daily for 15 days; Group 2 (Poly I: C), intratracheal instillation of sterile isotonic saline (5 ml/kg) and Poly I:C (10 mg/kg IP) in an equivalent volume of isotonic saline daily for 15 days; Group 3 (Bleo), intratracheal instillation of bleomycin (7.5
AJP l December 1988
unit/kg in 5 ml) and an equivalent volume ofisotonic saline (intraperitoneally) for 15 days; and Group 4 (Bleo + Poly I:C), intratracheal instillation of bleomycin (7.5 unit/kg in 5 ml) and Poly I:C (10 mg/kg IP) daily for 15 days. Poly I:C or saline was administered intraperitoneally for 2 days before intratracheal instillation of saline or bleomycin under pentobarbital anesthesia (80-90 mg/kg IP), as described in our earlier paper.20 The dose of Poly I:C (10 mg/kg) was the same as used by Deloria et al in mice. Bronchoalveolar Lavage All hamsters were anesthetized with sodium pentobarbital on day 14 after intratracheal instillation of saline or bleomycin. The lungs were prepared for lavage by cannulating the trachea with Teflon tubing attached to a syringe. The lung lavage was carried out with 12 ml of isotonic saline delivered in 4 ml aliquots. The fluid was transferred into a graduated tube placed on ice and its volume recorded. Recovery of bronchoalveolar lavage fluid (BALF) ranged from 85 to 90%. An aliquot ofthe fluid was portioned for total and differential cell count. The remainder was centrifuged at 270g for 5 minutes at 4 C in a refrigerated centrifuge. The supernatant was gently aspirated and stored at -20 C in several aliquots for various biochemical measurements. Leukocyte Counts Total leukocyte numbers in the BALF were determined by a Coulter counter (Model F, Coulter Electronics, Inc., Hialeah, FL), according to the User's Manual. A background count was made using pure Isoton II just before the actual counts were made. One hundred microliters of the remaining lavage fluid + Zapoglobin were diluted with 10 ml of Isoton II for the bleomycin treated hamsters, 300 ul of the fluid were diluted with 10 ml of Isoton II for the controls. Three more drops of Zapoglobin were added to the diluted fluid, mixed, and then run on the Coulter counter in triplicate. Cell counts were averaged and the background count was subtracted to get the adjusted average. The adjusted averages were multiplied by the dilution factor and the amount of lavage fluid recovered (in ml) to obtain total cell counts. Differential cell counts were obtained using slides prepared on a Shandon cytospin using 100 ,ul of lavage fluid. Slides were stained with a modified Wright's stain and coverslipped using a xylene-based mounting medium. Differential cell counts were done on a Zeiss microscope at X630. Neutrophils, monocytes, macrophages, lymphocytes, eosinophils, and basophils were
Vol. 133 * No. 3
ANTIFIBROTIC EFFECr OF INTERFERON INDUCER IN VIVO
counted, until a total of 500 cells were counted for each slide.
Morphometric Histopathology Hamsters designated for morphometric histopathology studies were divided among the four groups (six in each) and anesthetized as described above. After bronchoalveolar lavage and thoracotomy, the heart was ligated at the base for isolation of the pulmonary vasculature. The trachea was cannulated and lungs and heart were removed en bloc and weighed. The lungs were fixed by airway instillation of cacodylate buffered glutaraldehyde-paraformaldehyde fixative (400 mOsm) at a pressure of 30 cm H20 for a minimum of one hour. The cannula was removed, the trachea was tied off, and the lung and heart stored in fixative. The volume of the fixed lung was determined by its buoyant weight in saline after dissection of the heart and adjacent mediastinal tissue.22 Blocks of tissue were cut from at least two sagittal slabs (2-3 mm thick) from the right cranial, right caudal, and left lung lobes of each lung. Each block was cut with about a 1 sq cm face. These blocks were dehydrated in a graded series of ethanol and embedded in paraffin. Five-micron thick sections were cut from the paraffin blocks and stained with hematoxylin and eosin (H & E). Two sections for each of the three lobes were used to estimate the volume density ofparenchymal lesion within the lung using point counting techniques and a square lattice grid at a final magnification of X160.23 All tissue on the slides was counted. The volume of parenchymal lesion in the lung was then calculated by multiplying the volume density of parenchymal lesion by the volume density of parenchyma in the lung and by total lung volume. A lesion was defined as a cluster of four or more inflammatory cells in either interstitium or airways. From selected blocks, adjacent sections were cut and stained with sirius red for specific staining of collagenous fibers.24 Electron Microscopy One slab from each lobe was used to select a random block of about a 0.5 sq cm face for embedding in plastic. One-micron thick sections were cut and stained with toluidine blue. Representative lesions were selected from these sections for further observation by electron microscopy. One square millimeter regions were cut from the larger plastic blocks, mounted on BEEM capsules, sectioned at 50-80 nm thick and stained with uranyl acetate and lead citrate. These sections were examined on a Zeiss EM 10 electron microscope.
527
Biochemical Measurement After the bronchoalveolar lavage, the abdominal cavity was opened and the lungs were perfused with isotonic saline through the right side of the heart. All lung lobes from each animal were excised, cleaned of the extraneous tissue, washed in ice-cold saline several times (5 times) until the wash was completely free from blood. The lung lobes were quickly frozen in liquid nitrogen and stored at -20 C until assayed for the collagen content and prolyl hydroxylase activity. Determination of Lung Collagen Frozen lungs were thawed, then each hamster's lung was homogenized in 0.1 M KCI, 0.02 M Tris (pH 7.6) with a Polytrong (Brinkmann Instruments, Inc., Westbury, NY) in a total volume of 10 ml. An aliquot of the homogenate (1 ml) was precipitated with 50% ice-cold TCA to yield a 10% final concentration. After 10 minutes on ice, samples were centrifuged, the supernatant discarded, and the precipitate hydrolysed in 6 N HCI overnight (16-18 hours) at 1 10 C. To monitor the recovery of hydroxyproline, [3H]-hydroxyproline (2.5 X 10⁵ dpm) was added to each hydrolysed sample. The hydroxyproline content of each sample was measured by a technique developed by Woessner.25 Recovery of [3H]-hydroxyproline ranged from 70 to 90% and it was used to correct the amount of hydroxyproline for each sample. Prolyl Hydroxylase Assay Prolyl hydroxylase substrate (procollagen) was first prepared from tibias obtained from 10-day-old chick embryo and 1 mCi of L-(3,4-3H] proline according to the procedure described earlier.26 The method for prolyl hydroxylase assay was essentially the same as described by Hutton et al.27 Briefly, an aliquot of the frozen homogenate was thawed and rehomogenized in presence 0.05% Triton X. The incubation mixture for the assay in a total volume of 2 ml consisted offerrous ammonium sulfate (5 X 10⁻⁵ M), a-ketoglutaric acid (5 X 10⁻⁵ M), [3H]-proline procollagen (250,000 dpm), homogenate (200-400 ,l), ascorbic acid (2.5 X 10⁻⁴ M), and Tris-HCl buffer (0.1 M, pH 7.8) to make up the volume. The reaction was started by the addition of ascorbic acid and continued for 30 min at 37 C in a Dubnoff metabolic shaker. The reaction was terminated by adding 0.2 ml of 50% TCA. The tritiated water of the enzymatic reaction was separated by vacuum distillation of the whole reaction mixture. A 1 ml aliquot of tritiated water from each distillation was mixed in 10 ml of Ready-Solv (Beckman Instru-
528
0
GIRI AND HYDE
AJP 9 December 1988 __ I 9 r _
8-
z
NEUTROPHILS MONOCYTES MACROPHAGES
LYMPHOCYTES EOSINOPHILS
-A
l
ID
6-
total lavage fluid volume recovered per lung. The values are reported as the mean ± standard error of the mean (SEM) and analyzed among appropriate groups using Duncan's multiple-range test with a P < 0.05 considered the level of significance.3
0
x
4U I U.
0 LII
21
U
z
L ....-....pan... .LN _WY CONTROL POLY I C
li- rIP
En
1 BLEO
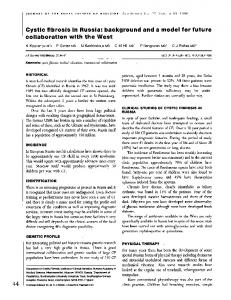
BLEO + POLY IC (12) (12) (10) (11) Figure 1-Absolute number of different cell types recovered in the bronchoalveolar lavage fluid of different groups of hamsters at 14 days after intratracheal injection of saline or bleomycin (Bleo). Control = saline (intratracheal) + saline (intraperitoneally); Poly l:C = saline (intratracheal) + Poly l:C (intraperitoneally); Bleo = bleomycin (intratracheal) + saline (intraperitoneally); Bleo + Poly l:C = bleomycin (intratracheal) + Poly l:C (intraperitoneally). See the text for details. Each bar graph represents the mean ± SEM. The number of animals for each group is shown in parenthesis. *Significantly increased (P < 0.05) over all other groups; +over control; and tover Poly l:C and control groups.
ments, Inc., Fullerton, CA) and counted in a Beckman scintillation spectrometer (Model LS 5801). The cpm of each sample was automatically converted to dpm by a quench curve programmed in the counter.
The quench curve was prepared with ['4C]-toluene and varying amount of chloroform. The counting efficiency of the samples for tritium ranged from 3740%. The enzyme assay under these conditions gave a linear release of product in relation to the amount of sample used and the time of incubation. Determination of Protein in BALF-Supernatant The protein conte-nt in the supernatant of BALF after appropriate dilutions was measured by the procedure of Lowry et al.28
Presentation and Statistical Analysis of the Data The data for collagen and prolyl hydroxylase activity are expressed per total lung. Expression of the data on a per lung basis rather than per milligram wet weight, per milligram protein or DNA avoids the artifactual lowering ofthe values in bleomycin treated animals29'30 because this treatment is associated with the leakage of plasma proteins and infiltration of leukocytes into the lung and they cannot be completely washed out by in situ perfusion of the lung.20 Similarly, total and differential cell counts and protein in the BALF-supernatant are expressed on the basis of
Results Cell Types Recovered in the BALF The total cell counts in the BALF at 14 days after intratracheal instillation of saline control group (6.0 X 10⁶ ± 1.8 X 10⁶) or bleomycin (8.8 X 10⁶ ± 0.7 * 106) were different among various groups, with significantly less cells in Poly I:C (5.6 X 10⁶ ± 0.2 X 10⁶) group than the Bleo group but not Bleo + Poly I:C group (7.1 X 10⁶ ± 0.8 X 10⁶). The number of differential cells recovered in the BALF of hamsters following different treatments are summarized in Figure 1. The number of neutrophils in Bleo treated group was significantly higher than that of control, Poly I:C and Bleo + Poly I:C groups. The hamsters in the latter group had significantly higher neutrophil counts in the BALF than hamsters in the control group. The monocyte numbers in the BALF of control and Poly I:C groups were not different from each other but they were significantly less in both groups than Bleo or Bleo + Poly I:C group. There was no difference in the monocyte numbers between the last two groups. The number of macrophages and lymphocytes recovered in the BALF of different groups were not different from each other. The eosinophil numbers, however, were significantly higher in Bleo group than any other group. Protein Content in BALF-Supernatant The protein content of the BALF-supernatant following various treatments is shown in Figure 2. The protein content in the BALF-supernatant of the hamsters in control and Poly I:C groups averaged 1157 ± 60 and 840 ± 31 ug/lung, respectively. This value in the Bleo treated group of hamsters was increased by almost three-fold (3311 ± 194,g/lung) as compared with control and four-fold compared with Poly I:C groups. The hamsters in Bleo + Poly I:C group had a significantly higher amount of protein (2383 ± 243,tg/lung) in their BALF-supernatant than control and Poly I:C groups but the value was significantly lower than that of Bleo group.
Lung Collagen The changes in the total lung collagen content expressed as hydroxyproline after various treatments are
Vol. 133 * No. 3
ANTIFIBROTIC EFFECT OF INTERFERON INDUCER IN VIVO
shown in Figure 3. The amount of hydroxyproline in control and Poly I:C groups ofhamsters averaged 791 ± 44 and 752 ± 71 ,Ag/lung, respectively. There was no difference in the hydroxyproline content between these two groups. The hydroxyproline content in Bleo treated group of hamsters was significantly increased to 177 ± 166 Ag/lung as compared with control. It is interesting that administration of Poly I:C 2 days before and 13 days after intratracheal instillation of bleomycin completely ameliorated the bleomycin-induced increase in the lung collagen content and consequently the hydroxyproline value in the Bleo + Poly I:C group of hamsters was 766 ± 75 ,tg/lung and this value was not different from the values obtained in control and Poly I:C groups of hamsters.
Lung Prolyl Hydroxylase Activity The lung prolyl hydroxylase activities in hamsters after various treatments are summarized in Figure 4. The prolyl hydroxylase activities in Poly I:C, Bleo, and Bleo + Poly I:C groups of hamsters at 13 days after intratracheal instillation of saline or bleomycin were 83, 183, and 142% of the control, respectively. The hamsters in the Bleo group had significantly higher levels of prolyl hydroxylase activity than hamsters in control, Poly I:C, or Bleo + Poly I:C groups. Although the prolyl hydroxylase activity in the latter group was significantly less than that of Bleo group, it remained significantly elevated as compared with control and Poly I:C groups.
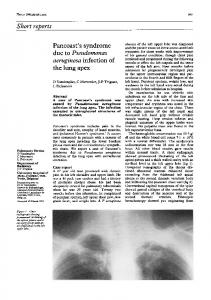
Morphology and Morphometry Lungs ofhamsters in the control or Poly I:C groups showed normal lung structure and no lesion (Figure 4, 0
1000 0
800 -
0.
z
600 0
0
400
I
200"I
Lo-
KNN
CONTROL
H POLY IC
BLEO
(6)
(6)
(6)
v
)
BLEO + POLY IC (6)
Figure 3-Lung hydroxyproline in different groups of hamsters 14 days after intratracheal injection of saline or bleomycin. See the legend to Figure 1
for explanation of treatment for different groups. Each bar graph represents the mean + SEM. The number of animals for each group is shown in parenthesis. *Significantly increased (P < 0.05) over all other groups.
5). In lungs of hamsters in the Bleo + Poly I:C group, lesions were restricted to the interstitium and comprised a significantly smaller volume as compared with the Bleo group where there was also occasional alveolar fibrosis (Table 1). Using the specific collagen stain sirius red, lesions in the Bleo + Poly I:C group showed less stainable collagen than did lesions in the Bleo group. Characteristic morphology of the Bleo group included extensive epithelial necrosis (Figure 6), fibroblast accumulation in interalveolar septa (Figure 7), and aggregations of spindle-shaped, fibroblastlike cells in alveolar spaces (Figure 8). The presence of alveolar fibroblasts was only observed in the Bleo group of hamsters. Common to all of these lesions were inflammatory cells comprised predominantly of neutrophils and alveolar macrophages. In the Bleo + Poly I:C group epithelial necrosis was observed infrequently (Figure 9), while type II epithelial cells were observed more commonly.
3-
z
:1 E
1*
0) -J
*
0-
z
14001 1200
z
529
20
1+
-
2
0
z I-
0
10.
a.
0 CZ
C
u
CONTROL
POLY IC
BLEO
(12)
(12)
(12)
BLEO + POLY IC
(12) Figure 2-Protein content in the cell-free supematant of bronchoalveolar lavage fluid of different groups of hamsters 14 days after intratracheal injection of saline or bleomycin. See the legend to Figure 1 for explanation of treatment for different groups. Each bar graph represents the mean + SEM. The number of animals for each group is shown in parenthesis. *Significantly increased (P < 0.05) over all other groups; +over Poly l:C and control groups.
5
0 CONTROL
POLY IC
BLEO
(6)
(6)
(6)
BLEO + POLY IC (6)
Figure 4-Lung prolylhydroxylase activity in different groups of hamsters 14 days after intratracheal injection of saline or bJeomycin. See the egend to Figure 1 for explanation of treatment for each group. Each bar graph represents the mean + SEM. The number of animals for each group is shown in parenthesis. *Significantly increased (P < 0.05) over all other groups; +over Poly l:C and control groups.
in JJV
vs>t~ ~ ;
*S0q'bt;'~ ~ ~ ~,q . . . . '
1,4TD A MNU YIIP uIRI AINDJ
AJP * Dcembr 1988
* * .S 4. .. . J S J~~4.4..
:~~~~~~~~
LV
,
; ;