la tendance de la mortalité cellulaire, initialement accrus, diminuaient fortement en cours d'expérience. Après 12 ...... free medium, with additional one day fast-.
Reprod. Nutr. Dev. 40 (2000) 441–465 © INRA, EDP Sciences
441
Original article
Induction of apoptosis and NF-κB by quercetin in growing murine L1210 lymphocytic leukaemic cells potentiated by TNF-α Arkadiusz ORZECHOWSKIa*, Katarzyna GRZELKOWSKAa, Wioletta ZIMOWSKAa, Jerzy SKIERSKIb, Tomasz PLOSZAJa**, Katarzyna BACHANEKa, Tomasz MOTYLa, Wojciech KARLIKa, Marcin FILIPECKIc a
Department of Physiology, Biochemistry, Pharmacology and Toxicology, Faculty of Veterinary Medicine, Warsaw Agricultural University, Nowoursynowska 166, 02-787 Warsaw, Poland b Flow Cytometry Laboratory, Drug Institute, Warsaw, Poland c Department of Plant Genetics and Breeding in Horticulture, Warsaw Agricultural University, Warsaw, Poland (Received 12 April 2000; accepted 8 September 2000)
Abstract — Polyphenol quercetin induced apoptosis in proliferating murine L1210 lymphocytic cells. DNA damage, as well as apoptosis and withdrawal from the cell cycle were transient. The above mentioned death promoting activity of quercetin was enhanced by physiological concentrations of TNF-α. At the same time, indices of cell viability dropped. However, the extent and tendency of the initially enhanced cell mortality steadily diminished throughout the experiment. After 12 h the G2/M phase reappeared. After 24 h all indices almost returned to control levels indicating either the selection of subpopulation of unaffected leukaemic cells or cells developing resistance to the treatment. A DNA ladder of oligonucleosomes was observed for apoptogenic treatments. We conclude that quercetin unmasked cell death, promoting the activity of TNF-α. However, after 12 and 24 h of exposure, surviving cells could complete the cell cycle and finally recover. At the same time, increased NF-κB activation was demonstrated by immunoblotting of the immunoreactive RelA/p65 subunit in nuclear extracts. Exposure to TNF-α or quercetin was crucial for increased activity of NF-κB, which may implicate an increasing resistance to their cytotoxicity. quercetin / TNF-α / leukaemia / apoptosis / NF-κB
* Correspondence and reprints E-mail: orzechowski @ alpha.sggw.waw.pl ** Fellowship winner of the Foundation for Polish Science in 1999.
442
A. Orzechowski et al.
Résumé — L’induction de l’apoptose et du NF-κB par la quercétine dans des cellules leucémiques lymphocytaires L1210 murines proliférantes est potentialisée par le TNF-α. La quercétine induit l’apoptose dans des cellules lymphocytaires murines L1210 proliférantes. Les altérations causées à l’ADN, de même que l’apoptose et les modifications du cycle cellulaire, sont transitoires. L’activation de la mort cellulaire par la quercétine était augmentée par des concentrations physiologiques de TNF-α. En même temps, les indices de viabilité cellulaire étaient diminués. Cependant, le degré et la tendance de la mortalité cellulaire, initialement accrus, diminuaient fortement en cours d’expérience. Après 12 heures, la phase G2/M réapparaissait. Après 24 heures, tous les indices revenaient presque aux niveaux de base, indiquant la sélection d’une sous population de cellules leucémiques non affectées, ou de cellules développant une résistance au traitement. Des oligonucléosomes visibles sous la forme d’une échelle d’ADN étaient observés lors des traitements apoptogéniques. En conclusion, la quercétine révèle la mort cellulaire, promouvant l’activité du TNF-α. Cependant, après 12 ou 24 heures d’exposition, les cellules survivantes pouvaient terminer leur cycle cellulaire. Une augmentation de l’activation du NF-κB a été démontrée par immunodétection de la sous-unité RelA/p65 dans les extraits nucléaires. L’exposition au TNF-α ou à la quercétine était déterminante pour l’augmentation de l’activité NF-κB, ce qui pourrait impliquer une résistance accrue à leur cytotoxicité. quercétine / TNF-α / cellule lymphocytaire / apoptose / NF-κB
1. INTRODUCTION Natural phenolic compounds including flavonoids are found in fruits, vegetables, tea, and red wine [22]. They are important constituents of the human diet. They include quercetin, resveratrol, catechine and epigallocatechin. These and many other flavonoids possess marked antioxidant activity [28, 50, 53, 69, 84] and have therapeutic potential for some diseases, including ischemic heart disease, brain ischemia and reperfusion injury, arteriosclerosis, rheumatoid arthritis, gastro-protection and cancer [13, 22, 37, 50, 70, 75, 90–92]. The broadmodulating effects of flavonoids as antioxidants i.e. inhibitors or activators of ubiquitous enzymes (ornithine decarboxylase, protein kinase C – PKC, phosphatidylinositol 3-kinase – PI-3K, mitogen-activated protein kinases – MAPK, calmodulin, lipooxygenase and cyclooxygenases) [23, 24, 94] and promoters of vasodilatation and platelet disaggregation can serve as starting material for drug development [43]. Among the flavonoids found in fruits and vegetables quercetin has attracted special research attention since its biological effects include anticarcinogenic activity [37, 45]. Polyphenol
quercetin and derivatives are superoxide anion (O2–) scavengers and inhibitors of xanthine oxidase [14] with quercetin aglycon being among the most potent antioxidant flavonoid [86]. The protective effect of flavonoids against lipid peroxidation products has been demonstrated by a number of authors [17, 32, 33, 46]. Polyphenol extracts from green tea and quercetin exert a protective effect on tumorigenesis, possibly by increasing the activity of detoxifying enzymes and/or competitive inhibition of various carcinogens [20, 97]. At present little is known about the molecular mechanisms of specific genes coding for proteins responsible for the observed beneficial health effects of flavonoids. The candidates for playing the key role in the regulation of cell life and death at the transcriptional level include NF-κB and AP-1 transcription factors. There is contrasting evidence for the induction of AP-1 and NF-κB by the phenolic antioxidants butylated hydroxyanisol (BHA) and t-butylhydroquinone (tBHQ). They either activate NF-κB (measured by the electrophoretic mobility shift assay) with the formation of H2O2 [60], or phenoxyl radicals and/or their derivatives [38] or inhibit NF-κB DNA
Induction of NF-κB activity
binding [5]. Phenolics trigger c-Jun N-terminal kinase (JNK1) and/or extracellular signal regulated protein kinase (ERK2) in a dose-dependent fashion [94]. Since JNKs are strongly and preferentially activated by stress stimuli, this signalling pathway as one of the stress responses, is functionally involved in cellular survival and/or apoptosis [34]. It is probable that the effect of quercetin is also dose-dependent on the regulation of MAPKs and leads to the induction of gene expression and cell survival. Alternatively, with the presence of quercetin, the activation of the ICE/Ced-3 protease (caspase-1) pathway by TNF-α can lead to cell death by apoptosis and/or necrosis [68]. Tumor necrosis factor alpha (TNF-α) is known to be one of the most potent cytokines that induce cell death [4]. TNF-α, whose activity is dependent on the generation of intracellular ROS [42], activates at least two inflammatory stimuli linked to apoptosis: cell survival and mitogenesis, with differential activation and promoter binding of the redox regulated transcription factors AP-1 and NF-κB [65]. On the contrary, AP-1 and NF-κB binding sites are located in the promoter region of a large variety of genes and are important for the inducible expression of genes involved in cellular response mechanisms. It is generally accepted that association of TNF-α with TNF-αR1 triggers a cascade of events initiated by TRAF2 (TNF-associated factor 2) and RIP (receptor interacting protein), which mediate the interactions necessary for the assembly of the NF-κB-activating complex and the death-inducing signalling complex (DISC). The death effector domain (DED) of the adaptor molecule FADD (Fas associated death domain) interacts with the homologous CARD (caspase-recruitment domains) of procaspase-8 and –10 and activates them. The CARD domain of the next adaptor protein CRADD in turn interacts with the homologous CARD domain of procaspase-2. Several other caspases (–1, –4, –5, –9) and APAF-1 (apoptosis activating factor 1) are activated by similar oligomeri-
443
sation [78]. NF-κB induction is a result of the action of the multiprotein complex called signalsome, which contains NIK (NF-κB inducing kinase), IKAP (IKK complex-associated protein) and NEMO (IKK-γ) [88]. This complex activates IKK-α or IKK-β (IκB kinases), which specifically phosphorylate serine residues (S32 and S36) of IκBα. Other possible signalsomes can exist, since IκBβ is phosphorylated on two equivalent serine residues, S19 and S23, whereas IκBε is phosphorylated on S157 and S161. During hypoxia and reoxygenation, an alternative pathway to NF-κB activation can be triggered, which involves phosphorylation of tyrosine at position 42 on IκBα and activation of phosphatidylinositol 3-kinase [64]. Rapidly phosphorylated IκB is ubiquitinated and degraded by the 26 S proteosome. Released NF-κB translocates to the nucleus, binds to κB elements in promoters of specific NF-κB dependent genes, and activates transcription. Cytokines (IL-1, TNF-α) that generate superoxide (O2–) and hydrogen peroxide are crucial for the activation of the transcription factor NF-κB and direct or indirect induction of the oxidant/antioxidant response elements (ORE/ARE) [9, 66]. Since quercetin and other dietary flavonoids are suggested to be beneficial for health in terms of colorectal tumor cell elimination in vitro [63], and since they also exhibit prooxidant behaviour under certain conditions [18], we decided to study the action of quercetin and TNF-α given separately and/or in combination in the cell culture of L1210 mouse lymphocytic leukaemic cells kept in the exponential phase of growth. Our previous investigations [25, 51] demonstrated that L1210 leukaemic cells are “primed” to apoptosis and could serve as a convenient object to study the mechanisms of programmed cell death. The objective of this study was to explore the effect of TNF-α and/or quercetin on survival and/or apoptosis of L1210 cells.
444
A. Orzechowski et al.
2. MATERIALS AND METHODS 2.1. Materials Dulbeco modified Eagle medium (DMEM) with Glutamax, L-glutamine, phosphate buffered saline (PBS-D), fetal calf serum (FCS), fungizone, gentamicin sulphate, anti PPLO, penicillin-streptomycin, agarose ultra pure were obtained from Gibco BRL. 4,6-diamidino-2-phenolidole (DAPI), Hoechst 33342 were from Molecular Probes Europe BV (Leiden, The Netherlands). Rabbit polyclonal anti-NF-κB RelA/p65 antibody was purchased from Santa Cruz Biotechnology (Santa Cruz, CA, USA). Sodium dodecyl sulphate (SDS) 10% (w/v), Sequi-Blot PVDF Membrane 0.2 µm and all reagents for immunoblotting, were from Bio-Rad Laboratories, propidium iodide, sulforhodamine, bovine serum albumin (BSA), dimethyl sulphoxide (DMSO), trypan blue, EDTA/trypsin, tumor necrosis factor alpha (TNF-α), (3-[4,5-dimethylthiazol2-yl]-2-5-diphenyltetrazolium bromide) (thiazolyl blue – MTT), isopropyl alcohol, Tris, EDTA, Triton X-100, NaCl, Hanks balanced salt solution, RNAse A from bovine pancreas, Lambda DNA EcoRI HindIII Digest and quercetin aglycon and all other reagents were from Sigma Chemical Co. (St.-Louis, MO, USA). [Methyl-3H]thymidine (5 mCi.mmol–1) was obtained from Amersham International (Aylesbury, UK). Universal scintillation liquid “Aquasol” was obtained from New England Nuclear Corp. (Boston, MA, USA). Sterile conical flasks as well as sterile disposable pipettes and plastic dishes were purchased from Corning-Costar Corp. (Cambridge, MA, USA).
10% (v/v) heat inactived FCS, 0.2 (w/v) L-glutamine, gentamicin (50 µg . mL –1), penicillin-streptomycin (25 U.mL–1), anti PPLO agent (12 µg.mL–1), and fungizone (0.5 µg . mL –1 ) in an atmosphere of 5% CO2/95% humidified air at 37 oC, and routinely subcultured every day by addition of a fresh medium. Average doubling times for cells in these conditions were about 12 h. Leukaemic cells grow in suspension. Although some are attached to the surface, gentle repetitive pipetting is sufficient to collect the cells for analytical purposes. TNF-α was prepared as stock solution (500 ng.mL–1, w/v in 0.1% BSA/PBS-D). Quercetin aglycon was dissolved in DMSO (w/v) to give final concentration of stock solution 10 or 100 mmol.L–1 (mM), respectively (was added up to a maximum concentration of 0.1% v/v dimethyl sulphoxide). DMEM solutions of reagents were prepared aseptically and held frozen in –20 °C until the experiment. For the experiment the cells were spun (200 g, 10 min, 4 °C) and washed twice with PBS-D every time followed by centrifugation (200 g, 10 min, 4 °C). Then the cells were suspended in freshly prepared medium (10% FCS/DMEM), transferred to conical flasks and test agents were added separately or in combination: DMSO (0.1%), TNF-α (1 and 5 ng.mL–1), Quercetin (10 and 100 µmol.L–1 – [µM]). The following treatments were chosen: Control (10% FCS/DMEM), Control Q (10% FCS/DMEM + 0.1% DMSO), TNF-α1 (1 ng.mL–1), TNF-α5 (5 ng.mL–1), Q10 (Quercetin 10 µM), Q100 (Quercetin 100 µM), TNF-α1 + Q10, TNF-α1 + Q100, TNF-α5 + Q10, TNF-α5 + Q100 for 6, 12 and 24 h, respectively. 2.3. Assessment of cell viability
2.2. Cell culture Studies were performed on a mouse lymphocytic leukaemic L1210 cell line supplied by the American Type Culture Collection (Rockville, MD, USA). Cell cultures were maintained in DMEM supplemented with
The mitochondrial function was assayed by the ability of cells to convert soluble MTT (3-[4,5-dimethylthiazol-2-yl]-2-5diphenyltetrazolium bromide) into an insoluble purple formazan reaction product with minor modifications to the protocol
Induction of NF-κB activity
described by Jacobson et al. [30]. For this assay, the cells were plated into 96-well plates at 5 × 10³ cells per well in 100 µL complete medium with or without experimental agents, and for the last 4 h of incubation (37 °C) 10 µL of MTT solution (5 mg.mL–1 in DMEM without phenol red, sterilised by filtration) was added. The bulk conversion of MTT in culture was measured. The reaction was stopped by adding 100 µL of pure isopropyl alcohol; after further overnight incubation at 4 °C, the absorbance (570–630 nm) was measured with an ELISA Reader type Elx808, BIO-TEK Instruments (USA) and % survival was defined as [(experimental – blank)/(control – blank)] × 100, where the blanks were the values obtained in wells containing both the control, experimental media and MTT without the cells. In all cases, the cells were examined by phase-contrast microscopy before addition of MTT to visually assess the degree of cell death. Similar results were obtained by using cells counted with a Bürker hemocytometer, where the viability was determined by the trypan blue dye exclusion method after 6, 12 and 24 h of incubation (data not shown). 2.4. Microscopy Morphologic evaluation of TNF-α and quercetin treated leukaemic cells was performed by DNA and protein labelling, with DAPI and sulforhodamine, respectively. Additionally, both propidium iodide followed by Hoechst 33342 staining to distinguish live, necrotic, early- and late-apoptotic cells was accomplished. Microscopy was performed using a fluorescence microscope BX-60 Olympus equipped with a PM20 automatic photomicrographic system (Fig. 1). 2.5. Quantification of DNA fragmentation Exponentially growing cells (10% FCS/ DMEM) were labelled with 1 µCi.mL–1 of
445
[Methyl-3H]-thymidine for 24 h prior to the experiment. Afterwards the cells were washed twice with PBS-D. The labelled cells, grown in conical flasks, were exposed to experimental factors for 6, 12 or 24 h of the incubation period. The cells were washed twice with PBS-D, harvested by centrifugation in sterile Eppendorf tubes, and the pellets were suspended in lysis buffer containing Tris 15 mM, EDTA 20 mM, Triton X-100 0.5%, pH 8.0. After 30 min on ice, the samples were centrifuged at 20 000 g for 30 min, and the supernatants were collected in sterile Eppendorf tubes. The pellets were dissolved by triturating in lysis buffer containing 15 mM Tris, 20 mM EDTA, 1% SDS heated to 56 °C. The supernatants and cell lysates were held frozen at –80 °C until assayed. The radioactivity (c.p.m.) present in the supernatant from lysis with buffer containing Triton X-100 and in the pellet dissolved by lysis buffer including 1% SDS was determined by liquid scintillation counting in a Packard TRI-CARB 1600 CA β-counter. The specific DNA fragmentation was calculated as the activity of supernatant/activity of the pellet. 2.6. Analysis of DNA fragmentation by agarose gel electrophoresis The method for agarose-gel electrophoresis of whole cells described by Wolfe et al. [87] was adopted with minor modifications. Briefly, approximately 1 × 10⁶ cells were aseptically washed twice with PBS-D. Thereafter, the cells were harvested with PBS-D, centrifuged (800 g, 10 min, 4 °C), the supernatant was aspired, and the cell pellet was held in sterile Eppendorf tubes until assay (4 °C). The cells were resuspended by triturating in 15 µL sterile deionised water, vortexed for 1 s. Approximately 6 µL of RNAse A solution (10 mg.mL–1 in 10 mM Tris, 15 mM sodium acetate, pH 7.5, preheated for 15 min in 95 °C) was added to each tube, the samples were mixed by spin and incubated at 56 °C for 1 h. Afterwards,
446
A. Orzechowski et al.
(A)
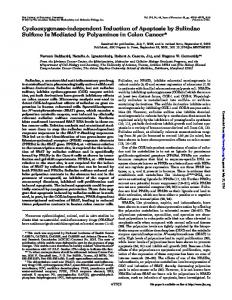
(B) Figure 1. The photos showing mouse L1210 leukaemic cells stained with: (A) DAPI and sulforhodamine; (B) HO 33342 and PI. Pictures were taken with a fluorescent microscope by the excitation of fluorochromes with a beam of UV light.
Induction of NF-κB activity
9 µL of loading buffer (12% Ficoll 400 in TAE, 0.25% bromophenol blue and 0.25% xylene cyan blue) was added and the samples were spun again. While running and digestion, the gels were prepared by dissolving 1.8 g agarose in TAE buffer 1.8% (w/v) (10 mM Tris, 10 mM sodium acetate, 1 mM EDTA) and melted in a microwave oven. Melted agarose was poured into a mould, the comb was inserted, and left to set. With a scalpel, a strip of gel across the top of the sample wells was cut out (10 cm × 1 cm × 0.5 cm) and half of it was dissolved again in 2.5 mL TAE. One milliliter of 10% SDS (w/v) was added to liquid gel to give the final content of 2% followed by the addition of 20 µL of proteinase K (20 mg.mL–1) after cooling to 55 °C. The solution was then immediately poured into the gap above the wells. When the gel became solid, 15 µL of each sample was transferred into each well. One microliter of λ DNA EcoRI HindIII Digest (125–21 226 bp) mixed with 10 µL TAE and 5 µL of loading buffer was applied to each gel to provide a size marker. Electrophoresis of DNA was initially performed with 2 V.cm–1 (20 V) for 1 h, followed by 3 h with 8 V.cm–1 (80 V) with TAE as a running buffer. After electrophoresis, the gels were stained for 20 min with ethidium bromide (1 µg.mL–1) followed by 5 min washing with deionised water. The gels were then UV illuminated and photographed by a Biometra BioDoc II video imaging system (USA). 2.7. Flow cytometry For FACS analysis the cells collected from each experiment were washed twice with PBS-D and suspended in Hanks balanced salt solution followed by fixation in 70% ethanol. EtOH suspension of the cells was held in –20 °C until determination of the cell cycle and apoptosis with a BectonDickinson FACS VANTAGE flow cytometer, equipped with a two-wavelength laser system Innova-Enterprise: blue (488 nm)
447
and UV (351 nm). With this method, the cells were separated and suspended in Hanks balanced salt solution, and then stained with 1 µg . mL –1 DAPI (DNA labelling) and 10 µg.mL–1 sulforhodamine 101 (protein labelling) and dissolved in 10 mM piperazine-N, N-bis-2-ethanesulfonic acid buffer containing 100 mM NaCl, 2 mM MgCl2 and 0.1% Triton X-100 (pH 6.8). DAPI was excited in the UV range and emitted a blue (424 nm) fluorescent light, whereas sulforhodamine was excited in the UV range and emitted a red (630 nm) fluorescent light. Both exciting beams are spatially separated (distance = 150 mm) so the fluorescence spectra can be easily separated with halfheight and appropriate dichromatic mirrors. Data acquisition and analysis was done using B-D software (Cell-Quest). The cell cycle analysis was done using Mac-Cycle software from Phoenix Flow Systems (San Diego, CA, USA). As a rule, 1 × 10⁴ cells were collected and analysed in each sample. 2.8. Nuclear protein extracts Nuclear extracts were prepared as described by Delgado et al. [19]. In brief, 1 × 10 7 cells from each treatment were resuspended in 400 µL of ice-cold 10 mM HEPES, pH 7.9, containing 10 mM KCl, 0.1 mM EDTA, 0.1 mM EGTA, 1 mM DTT, 0.5 mM PMSF, 10 µg.mL–1 of aprotinin, 10 µg.mL–1 leupeptin, 10 µg.mL–1 pepstatin, and 1 mM sodium azide. After storage at 4 °C for 10 min, Nonidet P-40 was added to the final concentration of 0.5%, the cells were vortexed gently for 15 s, and centrifuged for 40 s at 12 000 g. The nuclei pellet was washed once with the above buffer and resuspended in 100 µL of ice-cold 20 mM HEPES, pH 7.9, containing 0.4 M NaCl, 1 mM EDTA, 1 mM EGTA, 25% glycerol, 1 mM DTT, 0.5 mM PMSF, 10 µg.mL–1 aprotinin, 10 µg.mL–1 leupeptin, 10 µg.mL–1 pepstatin and 1 mM sodium azide. After incubation on ice for 30 min
448
A. Orzechowski et al.
with vigorous vortexing every 10 min, the nuclear proteins were collected by centrifugation for 10 min at 12 000 g. 2.9. Western blot analysis Equal amounts of nuclear protein (100 µg) were subjected to SDS-PAGE under reducing conditions. Electrotransfer of the proteins to PVDF membranes (0.2 µm) was carried out for 1 h at 100 V, followed by blocking in TBS buffer (20 mM Tris, 500 mM NaCl, pH 7.5) supplemented with 5% non-fat powdered milk. The membranes were then probed with the primary antibody (1 µg.mL–1) for 16 h at 4 °C, washed three times in TBS containing 0.05% Tween-20, and they were incubated with goat anti-rabbit antibody conjugated with horseradish peroxidase. The blots were developed using the enhanced chemiluminescence (ECL) detection system (Amersham) according to the manufacturer’s protocol. The gel photographs were scanned and analysed with a JX-330 Sharp scanner coupled with a computer (Compaq ProLinea 4/66D) and Diversity OneTM version 1.3 (pdi, New York, NY, USA) software. 2.10. Statistical evaluation The results were statistically evaluated with ANOVA and Tukey multiple range tests using the GraphPad PrismTM version 2.00 software (GraphPad Software Inc., San Diego, CA, USA). In order to show the quantitative differences between the treatments for the presentation of the results arbitrary units: % of control [experimental value/control value × 100], either Control or Control Q (if quercetin was present) were used. Each experiment was made in triplicate and was repeated at least twice. Dimethyl sulphoxide (DMSO) applied to dissolve quercetin aglycon even though it possesses antioxidative properties, was present in the media up to a maximum
concentration of 0.1% (v/v). The abovementioned solvent did not influence the rate of apoptosis when applied at such a low concentration (Control Q). Protein content was assayed by the bicinchoninic acid method (BCA, Pierce Chemical Co., Rockford, IL, USA).
3. RESULTS 3.1. Apoptosis of L1210 mouse lymphocytic leukaemic cells Spontaneous apoptosis evaluated on the basis of diminished DNA contents in cultured L1210 cells by the use of flow cytometer amounted to 13.25%, 11.65%, and 7.73% of whole cell population for 6, 12 and 24 h of incubation, respectively (Fig. 2). An additional peak in front of the G1/S phase represents the cells with reduced level of nuclear DNA, an indicator of apoptotic cell death. This peak is also called a sub-G1 peak but its appearance on the histogram is not always evident. If cells are not partially washed out of DNA fragments or nuclei are not deeply fragmented the sub-G1 peak may overlap with the ascending fragment of the G1 peak giving a “hummock”. Regardless of the appearance of the sub-G1 peak on histograms, the deformations (hummocks) on the ascending portion of the G1 peaks are well recognized on histograms after treatment with the Q100, TNF1 + Q100 and TNF5 + Q100 at the 6th hour, as well as on the histograms after treatment with the Q100, TNF5 + Q100 after 12 h of study and represent apoptotic cells. There is no evidence of the sub-G1 peaks or “hummocks” after 24 h of the incubation (Fig. 3). Quercetin at the concentration of 10 µM had no statistically significant effect on the rate of apoptosis, while at 100 µM cell apoptosis by quercetin (measured as portion of apoptotic cells) was augmented by 57.72% (P < 0.05), 40.88% or 13.89% for 6, 12 and 24 h of incubation, respectively (Fig. 2). Tumor necrosis factor alpha (TNF-α) both
Induction of NF-κB activity
449
at 1 or 5 ng.mL–1 did not significantly influence apoptosis in L1210 leukaemic cells. However, when present with quercetin (100 µM), this cytokine caused a substantial increase of apoptosis (by 109.95% (P < 0.05), 79.95% (P < 0.05) and 39.16% for 6, 12 and 24 h for 1 ng.mL–1 of TNF-α, and by 113.05% (P < 0.05), 72.21% (P < 0.05) and 38.06% for 6, 12 and 24 h for 5 ng.mL–1 of TNF-α. Interestingly, the extent of apoptosis was inversely proportional to the time of incubation. It was observed that the longer the time of exposure, the higher the values representing living rather than apoptotic cells. The additive effect of quercetin and TNF-α on the elimination of leukaemic L1210 cells was initially dramatic, but transient, and disappeared inevitably and steadily with the flow of time (Fig. 2). 3.2. DNA fragmentation
Figure 2. The effect of TNF-α1 (1 ng.mL–1), TNF-α5 (5 ng.mL–1), Q10 (Quercetin 10 µM), Q100 (Quercetin 100 µM), TNF-α1 + Q10, TNF-α1 + Q100, TNF-α5 + Q10, TNF-α5 + Q100 on apoptosis in L1210 leukaemic cell cultures incubated for 6, 12 and 24 h. The cells were analysed by FACS and selected as a sub-G1 fraction of the whole population of cells. The cells were stained, identified and calculated as described in the experimental section. The values that differ from controls are indicated with an asterisk (*) for P < 0.05. Experiments made in duplicate were repeated three times with similar results.
It is obvious that one, but not prerequisite, symptom of apoptosis is a specific internucleosomal cleavage of DNA, giving fragments which have a limited number of base pairs (200 bp or multiplicity of this number). In fact, a number of chromatographic techniques have emerged making use of this feature and allowing the separation and detection of fragmented DNA in the form called the “DNA ladder”. We used an easy and fast method of DNA analysis of whole cell lysates by agarose gel electrophoresis. As presented in Figure 4, a DNA ladder was observed in each lane, but the luminescence of DNA fragments (by ethidium bromide) was slightly higher in lanes showing consequences of simultaneous supplementation with quercetin (100 µM) and TNF-α (either 1 or 5 ng.mL–1). Furthermore, the results of DNA analyses present in the electrophoregrams were verified by calculating the index of specific fragmentation of DNA (Fig. 5). This formula was based on the radioactivity (d.p.m.) of [3H]-methyl-thymidine released into the cytoplasm from decayed DNA of cells undergoing the process of caryorhexis
450
Figure 3.
A. Orzechowski et al.
Induction of NF-κB activity
451
Figure 3. Histograms showing the distribution of cells belonging to subsequent G1, S, or G2/M phases after 6, 12 and 24 h of incubation. In some cases when apoptosis was enhanced a sub-G1 peak appeared. The cells were subjected to preparation and analysis by FACS according to the experimental protocol.
or caryolysis (specific DNA fragmentation [SDF] = radioactivity of cytoplasmic cell fraction (supernatant)/radioactivity of nuclear fraction (pellet)). The comparison of the pictures on electrophoregrams (Fig. 4) and figures representing SDF (Fig. 5) and apoptosis (Fig. 2) clearly demonstrates differences related to the time of incubation and method used. At the 6th hour of the experiment, SDF was elevated by 268.88%, 480.37% and 554.00% for Q100, TNF-α1 + Q 100 , and TNF-α 5 + Q 100 , respectively (P < 0.001). The decrease in the value of SDF concomitant to the permanent presence of DNA fragments on gels indicates that programmed cell death occurred mainly during the first 6 h of the experiment. Since diffusible DNA fragments were found on the gels at the 6th, 12th and 24th hour, but specific DNA fragmentation was almost
undetectable at the 12th and 24th hour, the absence of any further DNA cleavage after the 6th hour, we suppose, limited the source of radioactivity (labelled thymidine) in cytosol (similar to the observations from FACS analyses previously mentioned for apoptosis). According to this notice, DNA electrophoresis of whole-cell lysates is a good indicator of the presence of remnants of oligonucleosomal DNA fragmentation (200 bp fragments and multiplicity), whereas DNA fragmentation determined by the release of labelled thymidine is also an indicator of non-specific DNA fragmentation such as random decay of DNA. This random fragmentation is visible on agarose gels as the smears of DNA. In fact, the higher the radioactivity of labelled thymidine released from DNA, the greater the amount of low molecular weight DNA, but not
452
A. Orzechowski et al.
Figure 4. The effect of experimental factors on the presence of DNA fragments in cultures incubated for 6 h, 12 h and 24 h. Agarose gel electrophoregrams illustrate DNA fragments with characteristic laddering. Approximately 1 × 10 6 cells from each treatment were taken for analyses. The cells were washed twice with PBS-D and subjected for further preparation as described in materials and methods. Lanes signed with subsequent capital letters indicate different treatments. The experiments were repeated three times with similar results.
Induction of NF-κB activity
453
necessarily oligonucleosomes. Most likely during cell elimination other intracellular modifications than oligonucleosomal fragmentation led to the cell death by apoptosis. One should bear in mind that once released, thymidine might be utilised by the cells synthesising DNA. Therefore, it should not be surprising that after 12 and 24 h, SDF dropped so profoundly that the results were not significantly different from the control values (Fig. 5). Altogether, it is plausible to say that after 12 and 24 h the rate of apoptosis was markedly reduced. 3.3. Viability of L1210 mouse leukaemic cells
Figure 5. The effect of experimental factors on DNA fragmentation in cultures incubated for 6, 12 and 24 h. Specific fragmentation of DNA (SDF) was calculated on the basis of radioactivity of [3H]-methyl-thymidine released from the nucleus to the cytosol (see Materials and Methods). Statistical significance of differences between the means is indicated by different small letters (P < 0.05). Values that differ statistically from controls are marked with asterisks *, **, ***, for P < 0.05, P < 0.01, P < 0.001, respectively. The experiments were repeated three times in duplicate with similar results.
Two different methods (despite routine verification by trypan blue exclusion) were chosen in order to determine cell viability. The proliferation assay indicates the intensity of incorporation of labelled thymidine into DNA, a feature of growing viable cells. This was the case in our study (medium supplemented with 10% FCS). The second index, the MTT assay is based on the activity of mitochondrial enzymes that are responsible for cellular respiration, another feature of living systems that are dependent on a continuous supply of energy. Yellowish soluble MTT (3-[4,5-dimethylthiazol2-yl]-2-5-diphenyltetrazolium bromide) is converted in viable cells into insoluble purple formazan, which is then determined. Both, thymidine incorporation and/or formazan concentration are directly proportional to the viability of cells. As could be easily recognised from Figure 6, the MTT assay indicated lower respiration rates of cells treated, regardless of the kind of treatment. The deepest decrease in tetrazolium salt reduction was however observed at the 6th hour of incubation: for quercetin at 10 and 100 µM (–16.36% and –15.66% respectively, P < 0.05), and especially low in combinations with TNF-α (–28.32%, –23.41%, –42.73%, –38.93% for TNF-α1 + Q10, TNF-α1 + Q100, TNF-α5 + Q10, and
454
A. Orzechowski et al.
TNF-α5 + Q100, respectively, P < 0.001). After 12 h, the intensity of formazan formation slowly increased, still being below the rate observed for control cultures (–19.11%, –14.09%, –18.14%, –17.41%, –21.69% for Q10, Q100, TNF-α1 + Q100, TNF-α5 + Q10 (P < 0.05), and TNF-α5 + Q100, respectively (P < 0.001)). MTT conversion increased throughout the experiment to a modest extent that after 24 h, differences in formazan formation between the treatments and controls were insignificant (Fig. 6). Quercetin reducing power caused the formation of formazan in the absence of cells. Regardless of the quercetin concentration, the level of formazan in the control system (without the cells) did not change throughout the experiment – confirming that there was not spontaneous decay of quercetin during the 24 h. The modifications in the rate of DNA synthesis were inversely proportional to the observations previously mentioned for apoptosis and DNA. It became evident for instance, that cells treated simultaneously with quercetin (100 µM) and TNF-α (1 or 5 ng . mL –1 ) were characterised by the reduced rate of DNA synthesis either at the 6th, the 12th or 24th hour of incubation (Fig. 7). This might indicate that the activity of quercetin on cell viability is dose dependent and the consequences for the cells seem to be quite opposite at low and high doses. These observations are in agreement with the results obtained by others [38, 39]. The analysis of cell mortality (trypan blue exclusion) corresponds to the findings obtained from the proliferation assay. Since at the onset of the experiment the number of cells was the same for each treatment, the loss of viable cells beyond the number accounted for by apoptosis would result from secondary necrosis. The balance between the population of L1210 cells before and after the treatment with TNF-α suggests that cell death induced by this cytokine occurred in a very limited number of L1210 cells. Quercetin, in turn, at 100 µM significantly diminished the population of
Figure 6. The effect of experimental factors on the viability of L1210 cells measured by the conversion of MTT into formazan due to mitochondrial respiration. Statistical significance of differences between the means is signed by different small letters (P < 0.05). Values that differ statistically from controls are marked with asterisks *, **, ***, for P < 0.05, P < 0.01, P < 0.001, respectively. The experiments were repeated three times in quadruplicate with similar results.
Induction of NF-κB activity
455
viable cells at the 6th hour, to a lesser extent at the 12th, and at the 24th hour of incubation. The consequences of simultaneous supplementation of the media with TNF-α and quercetin were thus detrimental for cell viability. A significant decrease in viable cells was found in relation to controls for combination of TNF-α and quercetin (100 µM), especially for 6 h and to a lesser extent for 12 h; and did not reach statistical significance at 24 h of incubation, respectively. 3.4. Cell cycle of L1210 mouse lymphocytic leukaemic cells
Figure 7. The effect of experimental factors on the viability of L1210 cells measured by the incorporation of [3H]-methyl-thymidine into DNA. Statistical significance of differences between the means is signed by different small letters (P < 0.05). Values that differ statistically from controls are marked with asterisks *, **, ***, for P < 0.05, P < 0.01, P < 0.001, respectively. The experiments were repeated three times in duplicate with similar results.
DNA frequency distribution throughout the cell cycle in control cultures (Control (10% FCS/DMEM); Control Q (10% FCS/ DMEM + 0.1% DMSO) was typical and did not change after 6, 12 or 24 h of incubation (Fig. 3). Significant differences, however, were observed between the treatments and outset time points of cell collections for S, G2/M and G1 phases (Fig. 8). The analyses of histograms that were representative for each experiment (6, 12 and 24 h) provided information about the absolute and relative changes, which occurred during the cell cycle. The most evident modifications were found after 6 h of treatment. Quercetin aglycon at 100 µM caused a significant reduction in cells entering the G2/M and S phase and the sub-G1 peak appeared at the same time (Fig. 3). Furthermore, when the media were additionally supplemented with TNF-α this response was more eminent, so that the G2/M peak almost disappeared while the “neck” representing S phase was substantially reduced for TNF-α1 + Q10, TNF-α1 + Q100, TNF-α5 + Q10, and TNF-α5 + Q100 (Fig. 3). In quantitative terms, the above-mentioned conditions led to G1 arrest, leaving cells that could not complete S and G2/M phases. Other indices such as the proliferation assay, MTT assay, and the trypan blue exclusion method confirmed low viability of cells found during G1 arrest; whereas the rate of apoptosis and DNA
456
A. Orzechowski et al.
Figure 8. The effect of experimental factors on cell cycle phases (S, G2/M, G1) in cultures incubated for 6, 12 and 24 h, respectively. The number of murine L1210 lymphocytic leukaemic cells belonging to the S, G2/M. and G1 phase is expressed as a % of the control value (10% FCS/DMEM or 0.1% DMSO in 10% FCS/DMEM). The cells were analysed by FACS as described in the experimental section. A highly significant elevation of cells in the G1 phase with a concomitant drop of cells in the G2/M phase (P < 0.01) was found in cultures incubated for 6 h. This tendency was significantly reduced (12 h) and almost disappeared after 24 h of experiment.
fragmentation evaluated either by agarose electrophoresis or labelled thymidine release from DNA were both significantly elevated (Figs. 4 to 7). Longer incubation with the experimental factors (12 and 24 h) appeared to be less apoptogenic and cytotoxic. In contrast to the 6-hour period, the G2/M peak reappeared after 12 h; therefore the number of cells entering the S phase increased despite the fact that histograms still showed sub-G1 peaks (Fig. 3). Nevertheless, due to simultaneous disappearance of the sub-G1 peaks in histograms and improved indices of
cell viability obtained from the analyses of cells after 24 h, we suppose that the fast adaptation of L1210 murine leukaemic cells to a the experimental environment took place and initial sensitivity to quercetin and TNF-α was overcome. 3.5. Activity of NF-κB We decided to investigate the fate of the RelA/p65 subunit of NF-κB, which is known to move from cytosol to the nucleus in cases
Induction of NF-κB activity
of cellular stress [21, 35, 49, 61]. Conditions favouring the activation of NF-κB (i.e. TNF-α or IL-1) lead to the dissociation and release of the RelA/p65 protein. Through the Western blot analyses performed on nuclear extracts isolated from L1210 cells, we found higher representation of the p65 subunit of NF-κB in nuclear extracts of cells treated with 100 µM quercetin (Fig. 9, P < 0.01). Moreover, an observed stimulation was elevated after 12 and 24 h of incubation (Fig. 9). These results clearly demonstrated that the activation of NF-κB may represent a compensatory signalling response designed to prevent L1210 from cell death induced by quercetin. After 6 h of incubation, the redistribution of the RelA/p65 subunit into nuclei was also found to be significantly higher in cells treated with TNF-α alone (5 ng.mL–1), although an additive effect of quercetin and TNF-α was observed, as well (Fig. 10).
4. DISCUSSION With regards to the data presented it appears clearly that despite its antioxidative properties [31] quercetin is able to induce
457
Figure 9. Western blot analysis of the NF-κB p65 subunit in nuclear extracts of L1210 cells treated with 100 µM quercetin aglycon for 6, 12 and 24 h. The experiments were repeated two times in duplicate with similar results.
apoptosis in mouse lymphocytic leukaemic L1210 cells (Figs. 2 and 3). In particular, apoptosis was induced by 100 µM of quercetin. Moreover, programmed cell death was markedly augmented by the addition of TNF-α, regardless of the concentration of this cytokine used (Figs. 2 and 3). However, both reduced viability and increased intensity of apoptosis in mouse L1210 leukaemic cells were transient and appeared to be negatively correlated with the time of incubation. The analysis of data obtained from the FACS, MTT assay, proliferation assay and hemocytometer showed that TNF-α synergies with the quercetin effect in terms of
Figure 10. Bottom. Western blot analysis of NF-κB RelA/p65 subunit in nuclear extracts of L1210 cells untreated (lane 1) or treated with experimental factors during 6 h (for the kind of treatment, see description in table which represents the results of densitometric analysis of bands in subsequent lanes: 2 to 9). Top. Densitometric quantitation of NF-κB RelA/p65 bands expressed in arbitrary units with a control value set as 1 (fold increase of O.D. × mm2). Statistical significance of differences between the means is signed by different small letters (P < 0.05). Values that differ statistically from controls are marked with asterisks *, **, ***, for P < 0.05, P < 0.01, P < 0.001, respectively. The experiments were repeated three times in duplicate with similar results.
458
A. Orzechowski et al.
cytotoxicity (since the sum of the effects was related to cell death) was substantially elevated when these factors were added together. Surprisingly, the addition of TNF-α alone to the culture of L1210 leukaemic cells had a negligible effect on the rate of cell elimination either at 1 or 5 ng.mL–1. In contrast, cultures of L1210 leukaemic cells, which included TNF-α, when supplemented with quercetin at 100 µM became a subject to diminished viability, enhanced apoptosis and extensive cell death. Mortality of L1210 cells depended on the absolute concentration of the above-mentioned factors, since at a lower concentration (10 µM), quercetin did not affect the indices of viability nor the mortality of cultured cells. It seems necessary to mention that 100 µM of quercetin aglycon reduced the viability of mouse lymphocytic leukaemic L1210 cells by a mechanism at present not well understood. More spectacularly, apoptotic cell death was initiated relatively quickly; after 6 h the rate of cell elimination was extensive (Fig. 2). Since the activity of the NF-κB transcription factor was significantly elevated by quercetin and was not reversed after the addition of TNF-α (Fig. 10), the possible mechanism could be briefly described as follows. At certain levels quercetin might be an indirect NF-κB inducer by targeting several kinases (i.e. MAP kinases), which activate NF-κB. Upstream activators include NIK, MEKK1, MEKK2, MEKK3, TAK1, protein kinase Cζ, and S6 kinase [40, 52, 55, 73, 98]. Since quercetin is known to activate certain, (JNK, ERK) whereas it inhibits other (PKC) kinases, it has been previously described as the inhibitor of TNF-α induced NF-κB activation in synovial or glomerular cells [29, 70]. It therefore appears, that quercetin-induced NF-κB activation is characterised by cell specificity. Furthermore, in aforementioned experiments, synovial and glomerular cells were studied in serum free medium, with additional one day fasting as pre-treatment period to induce the quiescence of the cells. Apparently, in our studies, where growth medium was used,
serum mitogens and survival factors seem to change the reactivity of NF-κB. In this experiment it is plausible to point out quercetin as both the main source of apoptotic signal and accelerated dissociation of IκB and activation of NF-κB. Actually, phenolic antioxidants at high doses also activate ICE/Ced-3 caspases [38, 39]. An NF-κB RelA/p65 subunit acts as a signal from cytosol, which initiates transcription mechanisms leading to the enhanced expression of genes responsible for cell resistance to stress and apoptosis. In these circumstances the activation of NF-κB by quercetin supports the evidence of developing resistance of L1210 leukaemic cells to apoptogenic action of this polyphenol and toxic effect of TNF-α. Furthermore, the addition of quercetin at a higher concentration (100 µM) led to enhanced vulnerability of L1210 cells to the action of TNF-α at low doses (1 or 5 ng.mL–1) (Fig. 2). The unmasking cytotoxic effect of TNF-α by quercetin might suggest activation of downstream genes that became a key event in preventing the TNF-α mediated cytotoxicity in L1210 cells. Until now, antiproliferative effects of quercetin were ascribed to the inhibition of both protein tyrosine kinase C and phosphorylase kinase [79], lactate transport [85] and calmodulin [56]. Several cell lines studied have shown growth inhibition under the influence of quercetin [1, 2]. Our results indicate a higher incidence of cell death in the presence of quercetin, the additional possible mechanism of cell toxicity which seems to be quite similar to that reported by Serrano et al. [76] for other phenolic compounds such as gallic acid and its esters, which inhibit protein tyrosine kinases (PTKs). In our studies, quercetin also suppressed serum dependent proliferation of L1210 cells as determined by [3H]-thymidine uptake (Fig. 7). This phenolic compound suppressed cell progression from G1 into S and G2/M phases (Fig. 3). Yoshida et al. [93] also demonstrated quercetin-induced accumulation of cells in the late G1 phase of
Induction of NF-κB activity
human leukaemic T-cells. Similar findings were obtained by Kawada et al. [36] on the basis of studies with 100 µM quercetin in cultured rat stellate and Kupfer cells. In their studies, the action of quercetin aglycon was associated with suppressed inositol phosphate metabolism, tyrosine phosphorylation, reduced level of cell cycle protein cyclin D1 and mitogen-activated (MAP) kinase activation in PDGF/BB stimulated stellate cells. Our findings may partially explain the contradicting evidence from experiments on dietary quercetin [43, 91]. In certain cases quercetin aglycon could promote tumorigenesis and tumor growth [47] possibly by oxidative DNA damage in the presence of Cu2+ [89]. We suggest that anticarcinogenic activity of quercetin aglycon is dose dependent and is influenced by the presence of cytotoxic agents as well as serum survival factors (cytokines, oxygen free radicals – OFR) [48, 67]. Ciolino et al. [12] demonstrated that quercetin in growthpromoting conditions is a powerful ligand of the aryl hydrocarbon receptor (AhR) that activates AhR binding to the xenobioticresponsive element (XRE) of the CYP1A gene family, which encode cytochrome P450 (additional source of OFR). Additionally, phenolics stay in the first line of antioxidant defence donating electrons to OFR with a resultant formation of phenoxyl radicals [8]. Prooxidant phenoxyl radicals cooxidise NADH and GSH, which in turn are no longer able to inhibit NF-kB activation [11]. It appears that apoptosis may be initiated by phenolics; therefore prior to the signal supporting cell viability by activation of NF-κB transcription factor, quercetin could terminate cell survival of susceptible L1210 cells. There is also compelling evidence that in this experiment quercetin and TNF-α might stimulate vital functions of cells in other contexts. Since low doses of quercetin (up to 10 µM, data not shown) and physiological doses of TNF-α (1 and 5 ng.mL–1) seemed to act positively on some indices of cell viability (proliferation assay,
459
reduced apoptosis), our results agreed with the results of work from several other laboratories, which have demonstrated that oxidants or antioxidants at non-toxic levels can stimulate several early response events that are characteristic of growth factors [3, 41, 62, 71, 80]. Some authors [48] have proposed that TNF-α also might protect against cell death by inducing a controlled moderate level of oxidative stress, which then activates cytoprotective pathways. Quercetin in certain cell types inhibits the induction of pro-inflammatory cytokines [29, 70]. It also cannot be excluded that some cytokines promote the release of growth factors, which could interfere with cell viability by autocrine route [27, 58, 81, 82]. Similarly, but by an unknown mechanism, quercetin aglycon enhanced the susceptibility of L1210 leukaemic cells to TNF-α. The other possible scenario is the interaction of quercetin with an extracellular matrix, since stabilising TNF-α receptors and release of growth factors from the surface of cells also enhances cell death by TNF-α [77]. In fact, some studies have established that flavonoids interact with laminin – a protein in the extracellular matrix [6]. Hydrogen peroxide (H2O2), similarly to quercetin has been reported to stimulate the activity of the mitogen-activated protein kinases (MAPKs) ERK and JNK, and the expression of the proto-oncogenes c-fos and c-jun [83]. Cell elimination or survival is then a matter of balance between the protein products of genes controlling cell life and death. The key roles in the decision of an individual cell whether to dye or to remain alive, may be the modulation of antioxidant defences [7]. Quercetin has been suggested to be beneficial for health, however, studies have shown that many antioxidants can also exhibit prooxidant behaviour [8, 18]. Plant polyphenols including quercetin aglycon may interfere with the cellular redox state by the inhibition of glutathione reductase [96] and the efflux of glutathione S-conjugates [97]. The final
460
A. Orzechowski et al.
effect of plant phenolics on the viability of cells is therefore variable. At low concentrations quercetin and derivatives seem to exert stimulatory action on cell viability and survival, whereas at high doses (100 µM and higher) they are apoptogenic and cytotoxic [1, 2, 38, 39, 63]. From the dietary point of view, it remains to be established what doses could be considered as beneficial for health. In one of our papers [99] we described the action of AAPH on the culture of L1210 mouse lymphocytic leukaemic cells. The water soluble azo-compound AAPH is frequently used to study the effectiveness of antioxidants against the attack of oxygen free radicals to biomembranes [54]. While AAPH induces apoptosis, the L1210 leukaemic cells that survived oxidative stress after 24 h of incubation expressed the highest level of the Bcl-2 protein. Bcl-2 is an antiapoptotic protein present at various intracellular sites of OFR generation, which may represent a defence mechanism against peroxidation and OFR-induced apoptosis [26, 57, 74]. Lower Bcl-2 was accompanied by higher incidence of apoptosis. From studies on the expression of the Bcl-2 protein in surviving L1210 leukaemic cells treated with AAPH, we have drawn several conclusions. In general, we agreed that this oxidant leads to the selection of cells, eliminating those weakly protected by the antioxidative mechanisms. In the view of present data, despite the selection of the cells by quercetin a new finding may be made – leukaemic L1210 cells that survived were also able to resist quercetin and TNF-α toxicity and adapt to the microenvironment. In fact, De Moissac et al. [15] has described the activation of NF-κB induced by cycloheximide and TNF-α as mediated by Bcl-2 through the degradation of the cytoplasmic inhibitor IκBα. Moreover, this mechanism requires the conserved BH4 domain that links Bcl-2 to the NF-κB signalling pathway for suppression of apoptosis [16]. Just recently, other authors [100] have claimed
the Bcl-2 homologue as a direct transcriptional target of NF-κB. Since the surviving cells exposed to quercetin expressed the activation of NF-κB (Fig. 10), it raises the possibility of a functional link between Bcl-2 and NF-κB in the examined cells under cell life-threatening conditions. In our experiment, FACS analyses additionally uncovered quantitative differences between the proportions of cells belonging to subsequent cell cycle phases. It was shown that after 6 h of treatment with quercetin and TNF-α, the cell cycle was stopped at the G1 phase (G1 arrest) whereas cells in the S and G2/M phase underwent apoptosis. After 12 h of treatment this picture changed, although treatment with 100 µM quercetin, G1 arrest and apoptosis were still noticed. Following the next 12 h (24 h of incubation), relations between the cell cycle phases reflected those of the controls. This means that the cells previously inhibited by quercetin, and quercetin and TNF-α, and retarded in the G1 phase (6 h) could complete this step and enter the S and G2/M phases (12 and 24 h). This observation outlines the high potential of leukaemic cells to resist and overcome cytotoxic properties of experimental factors. According to recent advances in the interpretation of events that occur during programmed cell death, generation and spreading of ROS within the cell are consequences of the increased permeability of the mitochondrial membrane [59, 95]. Evidence that antioxidants may enhance apoptosis in certain tumor cell lines is available from novel studies carried out with ascorbate [72] and vitamin E or pyrrolidinedithiocarbamate (PDTC) [10]. The latter study was extended in vivo against colorectal cancer with the use of cytotoxic chemotherapy. The mechanism of accelerated apoptotic elimination observed in this trial was, however a p53 independent induction of p21 (powerful inhibitor of the cell cycle). A similar action of apigenin (quercetin derivative) was observed by Lepley and Pelling [44] during cell culture study.
Induction of NF-κB activity
In conclusion, we would like to stress that although cytotoxicity stimulated by antioxidants depends greatly on the underlying mechanism of action of a particular agent responsible for apoptosis and/or necrosis, the antioxidative characteristic of quercetin in this experiment was associated with apoptogenic activity, synergism with TNF-α cell death promoting activity, and the ability to induce “intracellular emergency status” by stimulation of NF-κB, which helped L1210 leukaemic cells to resist and overcome a hostile microenvironment. Our data support the opinion that quercetin is an effective apoptogenic factor for leukaemic cells but caution should be taken with regard to the development of new strategies of treatment and cure with quercetin of tumor diseases.
[7]
[8]
[9]
[10]
[11]
ACKNOWLEDGEMENTS This work was supported by a grant No 5 P06K 029 15 from the State Committee for Scientific Research.
REFERENCES [1]
[2]
[3]
[4}
[5]
[6]
Agullo G., Gamet L., Besson C., Demigne C., Remesy C, Quercetin exerts a preferential cytotoxic effect on active dividing colon carcinoma HT29 and Caco-2 cells, Cancer Lett. 87 (1994) 55–63. Agullo G., Gamet Payrastre L., Fernandez Y., Anciaux N., Demigne C., Remesy C, Comparative effects of flavonoids on the growth, viability and metabolism of a colonic adenocarcinoma cell line (HT29 cells), Cancer Lett. 105 (1996) 61–70. Bae Y.S., Kang S.W., Seo M.S., Baines I.C., Tekle E, Chock P.B., Rhee S.G., Epidermal growth factor (EGF)-induced generation of hydrogen peroxide, J. Biol. Chem. 272 (1997) 217–221. Baker S.J., Reddy E.P., Modulation of life and death by the TNF receptor superfamily, Oncogene 17 (1998) 3261–3270. Bowie A., O’Neill L.A.J., Oxidative stress and nuclear factor-κB activation, Biochem. Pharmacol. 59 (2000) 13–23. Bracke M., Pestel G., Castronovo V., Flavonoids inhibit malignant tumor invasion in vitro,
[12]
[13]
[14]
[15]
[16]
[17]
[18]
461
in: Alan R. (Ed.), Plant flavonoids in biology and medicine, Vol. 2, Liss, Inc., NY, 1988, pp. 219–233. Briehl M.M., Baker A.F., Siemakowski L.M., Morreale J., Modulation of antioxidant defences during apoptosis, Oncology Res. 9 (1997) 15–25. Chan T., Galat G., O’Brien P.J., Oxygen activation during peroxidase catalysed metabolism of flavones or flavonones, Chemico-Biological Interact. 122 (1999) 15–25. Chen C., Yull F.E., Kerr D., Differential serine phosphorylation regulates IκB-α inactivation, Biochem. Biophys. Res. Comm. 257 (1999) 798–806. Chinery R., Brockman J.A., Peeler M.O., Shyr Y., Beauchamp R.D., Coffey R.J., Antioxidants enhance the cytotoxicity of chemotherapeutic agents in colorectal cancer: A p53-independent induction of p21WAF1/CIP1 via C/EBPb, Nat. Med. 3 (1997) 1233–1241. Cho S., Urata Y., Iida T., Goto S., Yamaguchi M., Sumikawa K., Kondo T., Glutathione downregulates the phosphorylation of IκB: Autoloop regulation of the NF-κB-mediated expression of NF-κB subunits by TNF-α in mouse vascular endothelial cells, Biochem. Biophys. Res. Commun. 253 (1998) 104–108. Ciolino H.P., Daschner P.J., Yeh G.C., Dietary flavonols quercetin and kaempherol are ligands of the aryl hydrocarbon receptor that affect CYP1A1 transcription differentially, Biochem. J. 340 (1999) 715–722. Cook N.C., Samman S., Flavonoids – chemistry, metabolism, cardioprotective effects, and dietary sources, Nutr. Biochem. 7 (1996) 66–76. Cos P., Calomme M., Hu J.P., Cimanga K., Poel B.V., Pieters L., Vlietinck A.J., Berghe D.V., Structure-activity relationship and classification of flavonoids as inhibitors of xanthine oxidase and superoxide scavengers, J. Natur. Prod. 61 (1998) 71–76. De Moissac D., Shareef M., Greenberg A.H., Kirshenbaum L.A., Bcl-2 activates the transcription factor NF-κB through the degradation of the cytoplasmic inhibitor IkBα, J. Biol. Chem. 273 (1998) 23946–23951. De Moissac D., Zheng H., Kirshenbaum L.A., Linkeage of the BH4 domain of Bcl-2 and the nuclear factor κB signaling pathway for suppression of apoptosis, J. Biol. Chem. 274 (1999) 29505–29509. De Whalley C.V., Rankin S.M., Hoult J.R., Jessup W., Leake D.S., Flavonoids inhibit the oxidation modification of low density lipoproteins by macrophages, Biochem. Pharmacol. 39 (1990) 1743–1750. Decker E.A., Phenolics: Prooxidants or antioxidants, Nutr. Rev. 65 (1997) 396–398.
462
A. Orzechowski et al.
[19] Delgado M., Munoz-Elias E.J., Gomariz R.P., Ganea D., Vasoactive intestinal peptide and pituitary adenylate cyclase-activating polypeptide prevent inducible nitric oxide synthase transcription in macrophages by inhibiting NF-κB and IFN regulatory factor 1 activation, J. Immunol. 162 (1999) 4685–4696. [20] Dreher D., Junod A.F., Role of oxygen free radicals in cancer development, Eur. J. Cancer. 1 (1996) 30–38. [21] Faure V., Courtois Y., Goureau O., Tyrosine kinase inhibitors and antioxidants modulate NF-κB and NOS-II induction in retinal epithelial cells, Am. J. Physiol. (Cell Physiol.) 44 (1998) C208–C215. [22] Formica J.V., Regelson W., Review of the biology of Quercetin and related bioflavonoids, Food Chem. Toxicol. 33 (1995) 1061–1080. [23] Gamet-Payrastre L., Manenti S., Gratacap M.P., Tulliez J., Chap H., Payrastre B., Flavonoids and the inhibition of PKC and PI 3-kinase, Gen. Pharmacol. 32 (1999) 279–286. [24] Gryglewski R.J., Korbut R., Robak J., Swies J., On the mechanisms of antithrombotic action of flavonoids, Biochem. Pharmacol. 36 (1987) 317–322. [25] Grzelkowska K., Motyl T., Malicka E., Ostrowski J., Trzeciak L., Filipecki M., Effect of orotic acid on TGF-β1-induced growth inhibition of L1210 leukaemic cells, Int. J. Hematol. 61 (1995) 23–33. [26] Hockenberry D.M., Oltvai Z.N., Yin X.M., Milliman C.L., Korsmeyer S.J., Bcl-2 functions in an antioxidant pathway to prevent apoptosis, Cell 75 (1993) 241–251. [27] Hong Y.H., Peng H.B., Fata V.L., Liao J.K., Hydrogen peroxide-mediated transcriptional induction of macrophage colony-stimulating factor by TGF-β1, J. Immunol. 159 (1997) 2418–2423. [28] Ioku K., Tsushida T., Takei Y., Nakatami N., Terao J., Antioxidative activity of quercetin and quercetin monoglucosides in solution and phospholipid bilayers, Biochim. Biophys. Acta 1234 (1995) 99–104. [29] Ishikawa Y., Sugiyama H., Stylianou E., Kitamura M., Bioflavonoid quercetin inhibits interleukin-1-induced transcriptional expression of monocyte chemoattractant protein-1 in glomerular cells via suppression of nuclear factorκB, J. Am. Soc. Nephrol. 10 (1999) 2290–2296. [30] Jacobson M.D., Burne J.F., Raff M.C., Programmed cell death and Bcl-2 protection in the absence of a nucleus, EMBO J. 13 (1994) 1899–1910. [31] Kana I., Tsushida T., Takei Y., Nakatani N., Terao J., Antioxidative activity of quercetin and quercetin monoglucosides in solution and phospholipid bilayers, Biochim. Biophys. Acta 1234 (1995) 99–104.
[32] Kaneko T., Baba N., Protective effects of flavonoids on endothelial cells against linoleic acid hydroperoxide-induced toxicity, Biosci. Biotechnol. Biochem. 63 (1999) 323–328. [33] Kaneko T., Kaji K., Matsuo M., Protection of linoleic acid hydroperoxide-induced cytotoxicity by phenolic antioxidants, Free Radic. Biol. Med. 16 (1994) 405–409. [34] Karin M., Delhase M., JNK or IKK, AP-1 or NF-κB, which are the targets for MEK kinase 1 action?, Proc. Natl. Acad. Sci. USA 95 (1998) 9067–9069. [35] Kaul N., Chol J., Forman H.J., Transmembrane redox signalling activates NF-κB in macrophages, Free Radic. Biol. Med. 24 (1998) 202–207. [36] Kawada N., Seki S., Inoue M., Kuroki T., Effect of antioxidants, resveratrol, quercetin, and N-acetylcysteine, on the functions of cultured rat hepatic stellate cells and Kupfer cells, Hepatology 27 (1998) 1265–1274. [37] Knekt P., Jarvinen R, Seppanen R., Heliovaara M., Teppo L., Pukkala E., Aromaa A., Dietary flavonoids and the risk of lung cancer and other malignant neoplasms, Am. J. Epidemiol. 146 (1997) 223–230. [38] Kong A.N.T., Yu R., Lei W., Mandlekar S., Tan T.H., Ucker S., Differential activation of MAPK and ICE/Ced3 protease in chemical-induced apoptosis, Restor. Neurol. Neurosci. 12 (1998) 63–70. [39] Kong A.N.T., Mandlekar S., Yu R., Lei W, Fasanmande A., Pharmacodynamics and toxicodynamics of drug action: signalling in cell survival and cell death, Pharmaceut. Res. 16 (1999) 790–798. [40] Lallena M.J., Diaz-Meco M.T., Bren G., Paya C.V., Moscat J., Activation of IkappaB kinase beta by protein kinase C isoforms, Mol. Cell. Biol. 19 (1999) 2180–2188. [41] Lang C.H., Nystrom G.J., Frost R.A., Regulation of IGF binding protein-1 in Hep G2 cells by cytokines and reactive oxygen species, Am. J. Physiol. 39 (1999) G719–G727. [42] Larrick J.W., Wright S.C., Cytotoxic mechanism of tumor necrosis factor-α, FASEB J. 4 (1990) 3215–3223. [43] Leibovitz B.E., Mueller J.A., Bioflavonoids and polyphenols: medical applications, J. Optim. Nutr. 2 (1993) 17–35. [44] Lepley D.M., Pelling J.C., Induction of p21/ Waf1 and G(1) cell cycle arrest by the chemopreventive agent apigenin, Mol. Carcinogen. 19 (1997) 74–82. [45] Levy J., Teurstein I., Marbach M., Tyrosine protein kinase activity in the DMBA induced rat mammary tumor: inhibition of quercetin, Biochem. Biophys. Res. Commun. 123 (1984) 1227–1233.
Induction of NF-κB activity [46] Luiz da Silva E., Tsushida T., Terao J., Inhibition of mammalian 15-lipooxigenase-dependent lipid peroxidation in low-density lipoprotein by quercetin and quercetin monoglucosides, Arch. Biochem. Biophys. 349 (1998) 313–320. [47] Mac Gregor J., Genetic and carcinogenic effects of plant flavonoids: an overview, in: Friedman M. (Ed.), Nutritional and toxicological aspects of food safety, Plenum Press, NY, 1984, pp. 497–526. [48] Mattson M.P., Furukawa K., Anti-apoptotic actions of cycloheximide: blockade of programmed cell death or induction of programmed cell life?, Apoptosis 2 (1997) 257–264. [49] Mattson M.P., Goodman Y., Hong Luo, Weiming Fu, Furukawa K., Activation of NF-κB protects hippocampal neurones against oxidative stressinduced apoptosis: evidence for induction of manganese superoxide dismutase and suppression of peroxynitrite production and protein tyrosine nitration, J. Neurosci. Res. 49 (1997) 681–697. [50] Miyagi Y., Miwa K., Inoue H., Inhibition of human low-density lipoprotein oxidation by flavonoids in red wine and grape juice, Am J. Cardiol. 80 (1997) 1627–1631. [51] Motyl T., Kasterka M., Grzelkowska K., Ostrowski J., Filipecki M., Malicka E., Ploszaj T., Phorbol Ester (12-O-tetradecanoylphorbol 13-acetate) prevents ornithine decarboxylase inhibition and apoptosis in L1210 leukaemic cells exposed to TGF-β1, Int. J. Biochem. Cell Biol. 28 (1996) 1327–1335. [52] Nakano H., Shindo M., Sakon S., Nishinaka S., Mihara M., Yagita H., Okumura K., Differential regulation of IkappaB kinase alpha and beta by two upstream kinases, NF-kappaB-inducing kinase and mitogen-activated protein kinase/ERK kinase kinase-1, Proc. Natl. Acad. Sci. USA 95 (1998) 3537–3542. [53] Nakayama T., Ono K., Hashimoto K., Affinity of antioxidative polyphenols for lipid bilayers evaluated with liposome system, Biosci. Biotechnol. Biochem. 62 (1998) 1005–1007. [54] Niki E., Oikawa M., Takahashi M., Oxidative cell damage induced by radicals and inhibited by antioxidants, Free Radic. Brain Physiol. Disord. 3 (1995) 35–43. [55] Ninomiya-Tsuji J., Kishimoto K., Hiyama A., Inoue J., Cao Z., Matsumoto K., The kinase TAK1 can activate the NIK-1 kappaB as well as the MAP kinase cascade in the IL-1 signalling pathway, Nature 398 (1999) 252–256. [56] Nishino H., Nishino A., Iwashima A., Quercetin inhibits action of 12-O-tetradeconylphorbol-13acetate, a tumor promoter, Oncology 41 (1984) 120–123. [57] Offen D., Ziv I., Panet L., Wasserman L., Stein R., Melamed E., Barzilai A., Dopamine-induced apoptosis is inhibited in PC12 cells expressing Bcl-2, Cell. Mol. Neurobiol. 17 (1997) 289–304.
463
[58] Ohba M., Shibanuma M., Kuroki T., Nose K., Production of hydrogen peroxide by transforming growth factor-β1 and its involvement in induction of erg-1 in mouse osteoblastic cells, J. Cell Biol. 126 (1994) 1079–1083. [59] Petit P.X, Susin S.A., Zamzani N., Mignotte B., Kroemer G., Mitochondria and programmed cell death: back to the future, FEBS Lett. 396 (1996) 7–13. [60] Pinkus R., Weiner L.M., Daniel V., Role of oxidants and antioxidants in the induction of AP-1, NF-κB, and glutathione S-transferase gene expression, J. Biol. Chem. 271 (1996) 13422–13429. [61] Post A., Holsboer F., Behl C., Induction of NFκB activity during haloperidol-induced oxidative toxicity in clonal hioppocampal cells: suppression of NF-κB and neuroprotection by antioxidants, J. Neurosci. 18 (1998) 8236–8246. [62] Rao G.N., Protein tyrosine kinase activity is required for oxidant-induced extracellular signalregulated protein kinase activation and c-fos and c-jun expression, Cell. Signal. 9 (1997) 181–187. [63] Richter M., Ebermann R., Marian B., Quercetininduced apoptosis in colorectal tumor cells: possible role of EGF receptor signaling, Nutr. Cancer 34 (1999) 88–99. [64] Roberts M.L., Cowsert L.M., Interleukin-1 beta and reactive oxygen species mediate activation of c-Jun NH2-terminal kinases, in human epithelial cells, by two independent pathways, Biochem. Biophys. Res. Commun. 251 (1998) 166–172. [65] Roebuck K.A., Oxidant stress regulation of IL-8 and ICAM-1 gene expression: differential activation and binding of the transcription factors AP-1 and NF-κB (review), Int. J. Mol. Med. 4 (1999) 223–230. [66] Roebuck K.A., Carpenter L.R., Lakshminarayanan V., Page S.M., Moy J.N., Thomas L.L., Stimulus-specific regulation of chemokine expression involves differential activation of the redox-responsive transcription factors AP-1 and NF-κB, J. Leukoc. Biol. 65 (1999) 291–298. [67] Rolfe M., James N.H., Roberts R.A., Tumor necrosis factor α (TNF-α) suppresses apoptosis and induces DNA synthesis in rodent hepatocytes: a mediator of the hepatocarcinogenicity of peroxisome proliferators?, Carcinogenesis 18 (1997) 2277–2280. [68] Ruemmele F.M., Dionne S., Levy E., Seidmen E.G., TNF-α-Induced IEC-6 cell apoptosis requires activation of ICE caspases whereas complete inhibition of the caspase cascade leads to necrotic cell death, Biochem. Biophys. Res. Commun. 260 (1999) 159–166. [69] Santos A.C., Uyemura S.A., Lopes J.L.C., Bazon J.N., Mingatto F.E., Curti C., Effect of naturally occuring flavonoids on lipid peroxidation and membrane permeability transition in mitochondria, Free Radic. Biol. Med. 24 (1998) 1455–1461.
464
A. Orzechowski et al.
[70] Sato M., Miyazaki T., Kambe F., Maeda K., Seo H., Quercetin, a bioflavonoid, inhibits the induction of interleukin 8 and monocyte chemoattractant protein-1 expression by tumor necrosis factor-α in cultured human synovial cells, J. Rheumatol. 24 (1997) 1680–1684. [71] Satoh T., Sakai N., Enokido Y., Uchiyama Y., Hatanaka H., Survival factor-insensitive generation of reactive oxygen species induced by serum deprivation in neuronal cells, Brain Res. 733 (1996) 9–14. [72] Satoh K., Kadofuku T., Sakagami H., Copper, but not iron, enhances apoptosis-inducing activity of antioxidants, Anticancer Res. 17 (1997) 2487–2490. [73] Schouten G.J., Vertegaal A.C., Whiteside S.T., Israel A., Toebes M., Dorsman J.C., van der Eb A.J., Zantema A., IkappaB alpha is a target for the mitogen-activated 90 kDa ribosomal S6 kinase, EMBO J. 16 (1997) 3133–3144. [74] Schraufstatter I.U., Hyslop P.A., Jackson J.H., Cochrane C.G., Oxidant-induced DNA damage of target cells, J. Clin. Invest. 82 (1988) 1040–1050. [75] Schutenko Z., Henry Y., Pinard E., Seylaz J., Potier P., Berhet F., Girard P., Sercombe R., Influence of the antioxidant quercetin in vivo on the level of nitric oxide determined by electron paramagnetic resonance in rat brain during global ischemia and reperfusion, Biochem. Pharmacol. 57 (1999) 199–208. [76] Serrano A., Palacios C., Roy G., Cespon C., Villar M., Nocito M., Gonzalez-Porque P., Derivatives of gallic acid induce apoptosis in tumoral cell lines and inhibit lymphocyte proliferation, Arch. Biochem. Biophys. 350 (1998) 49–54. [77] Smith M.R., Kung Hsiang-fu, Durum S.K., Colburn N.H., Cun Yi, TIMP-3 induces cell death by stabilising TNF-α receptors on the surface of human colon carcinoma cells, Cytokine 9 (1997) 770–780. [78] Srinivasula S.A., Ahmad M., Lin J.H., Poyet J.L., Fernandez-Alnemri T., Tsichlis P.N., Alnemri E.S., CLAP, a novel caspase recruitment domain-containing protein in the tumor necrosis factor receptor pathway, regulates NFκB activation and apoptosis, J. Biol. Chem. 274 (1999) 17946–17954. [79] Srivastava A.K., Inhibition of phosphorylase kinase and tyrosine protein kinase activities by quercetin, Biochem. Biophys. Res. Commun. 13 (1985) 1–5. [80] Takase H., Oemar B.S., Pech M., Luscher T.F., Platelet-derived growth factor-induced vasodilatation in mesenteric resistance arteries by nitric oxide: blunted response in spontaneous hypertension, J. Cardiovasc. Pharmacol. 33 (1999) 223–228.
[81] Thannickal V.J., Fanburg B.L., Activation of an H2O2-generating NADH oxidase in human lung fibroblasts by transforming growth factorβ1, J. Biol. Chem. 270 (1995) 30334–30340. [82] Thannickal V.J., Hassoun P.M., White A.C., Fanburg B.L., Enhanced rate of H2O2 release from bovine pulmonary artery endothelial cells induced by transforming growth-β1, Am. J. Physiol. 265 (1993) L622–L630. [83] Tournier C., Thomas G., Pierre J., Jacquemin C., Pierre M., Saunier B., Mediation by arachidonic acid metabolites of the H2O2-induced stimulation of mitogen-activated protein kinases (extracellular-signal-regulated kinase and c-Jun NH2-terminal kinase), Eur. J. Biochem. 244 (1997) 587–595. [84] van Acker S.A.B.E., van den Berg D.J., Tromp M.N.J.L., Griffioen D.H., van Bennekom W.P., van der Vijgh W.J.F., Bast A., Structural aspects of antioxidant activity of flavonoids, Free Radic. Biol. Med. 20 (1996) 331–342. [85] Wang H., Shah V., Lanks K.W., Use of oxidizing dyes in combination with 2-cyanocinnamic acid to enhance hyperthermic cytotoxicity in L929 cells, Cancer Res. 47 (1987) 3341–3343. [86] Williamson G., Plumb G.W., Yasushi U., Price K.R., Rhodes M.J.C., Dietary quercetin glycosides: antioxidant activity and induction of the anticarcinogenic phase II marker enzyme quinone reductase in Hepaclc7 cells, Carcinogenesis 17 (1996) 2385–2387. [87] Wolfe J.T., Pringle J.H., Cohen G.M., Assays for the measurement of DNA fragmentation during apoptosis, in: Cotter T.G., Martin S.J. (Eds.), Techniques in apoptosis. A user guide, Portland Press Ltd, 59 Portland Place, London W1N 3AJ, UK, 1996, pp. 58–60. [88] Woronicz J.D., Gao X., Cao Z., Rothe M., Goeddel D.V., IkappaB kinase-beta: NF-kappaB activation and complex formation with B kinase-alpha and NIK, Science 278 (1997) 866–869. [89] Yamashita N., Tanemura H., Kawanishi S., Mechanism of oxidative DNA damage induced by quercetin in the presence of Cu(II), Mutat. Res. 425 (1999) 107–115. [90] Yang C.S., Lee M.J., Chen L., Yang G.Y., Polyphenols as inhibitors of carcinogenesis, Environ. Health Perspect. 105 (1997) 971–976. [91] Yang G., Liu Z., Seril D.N., Liao J., Ding W., Kim S., Bondoc F., Yang C.S., Black tea constituents, theaflavins, inhibit 4-(methylnitrosamino)-1-(3-pyridyl)-1-butanone (NNK)induced lung tumorigenesis in A/J mice, Carcinogenesis 18 (1997) 2361–2365. [92] Yang G., Liao J., Kim K., Yurkow E.J., Yang C.S., Inhibition of growth and induction of apoptosis in human cancer cell lines by tea polyphenols, Carcinogenesis 19 (1998) 611–616.
Induction of NF-κB activity [93] Yoshida M., Yamamoto M., Nikaido T., Quercetin arrests human leukaemic T-cells in late G1 phase of the cell cycle, Cancer Res. 52 (1992) 6676–6681. [94] Yu R., Jie-J.J., Jauh-L.D., Krisnhamurthy G., Tse-Hua T., Kong A.N.T., Activation of mitogen-activated protein kinases by green tea polyphenols: potential signalling pathways in the regulation of antioxidant-responsive element-mediated Phase II enzyme gene expression, Carcinogenesis 18 (1997) 451–456. [95] Zamzani N., Hirsch T., Dallaporta B., Petit P.X., Kroemer G., Mitochondrial implication in accidental and programmed cell death: apoptosis and necrosis, J. Bioenerg. Biomembr. 29 (1997) 185–193. [96] Zhang K., Wong K.P., Inhibition of the efflux of glutathione S-conjugates by plant polyphenols, Biochem. Pharmacol. 52 (1996) 1631–1638.
465
[97] Zhang K., Yang E.B., Tang W.Y., Wong K.P., Mack P., Inhibition of glutathione reductase by plant polyphenols, Biochem. Pharmacol. 54 (1997) 1047–1053. [98] Zhao Q., Lee F.S., Mitogen-activated protein kinase/ERK kinase kinases 2 and 3 activate nuclear factor-κB through IκB kinase-α and IκB kinase-β, J. Biol. Chem. 274 (1999) 8355–8358. v [99] Zimowska W., Motyl T., Skierski J., Balasinska B., Ploszaj T., Orzechowski A., Filipecki M., Apoptosis and Bcl-2 protein changes in L1210 leukaemic cells exposed to oxidative stress, Apoptosis 2 (1997) 529–539.. [100] Zong W.X., Edelstein L.C., Chen C., Bash J., Gelinas C., The prosurvival Bcl-2 homolog Bfl1/A1 is a direct transcriptional target of NF-kB that blocks TNF-α-induced apoptosis, Genes Dev. 13 (1999) 382–387.
To access this journal online: www.edpsciences.org
466
A. Orzechowski et al.