Neuron, Vol. 44, 321–334, October 14, 2004, Copyright 2004 by Cell Press
Induction of Spine Growth and Synapse Formation by Regulation of the Spine Actin Cytoskeleton Karen Zito,1 Graham Knott,2 Gordon M.G. Shepherd,1 Shirish Shenolikar,3 and Karel Svoboda1,* 1 Howard Hughes Medical Institute Cold Spring Harbor Laboratory Cold Spring Harbor, New York 11724 2 Institut de Biologie Cellulaire et Morphologie Universite´ de Lausanne Rue du Bugnon 9 CH 1005, Lausanne Switzerland 3 Department of Pharmacology and Cancer Biology Duke University Medical Center Durham, North Carolina 27710
Summary We explored the relationship between regulation of the spine actin cytoskeleton, spine morphogenesis, and synapse formation by manipulating expression of the actin binding protein NrbI and its deletion mutants. In pyramidal neurons of cultured rat hippocampal slices, NrbI is concentrated in dendritic spines by binding to the actin cytoskeleton. Expression of one NrbI deletion mutant, containing the actin binding domain, dramatically increased the density and length of dendritic spines with synapses. This hyperspinogenesis was accompanied by enhanced actin polymerization and spine motility. Synaptic strengths were reduced to compensate for extra synapses, keeping total synaptic input per neuron constant. Our data support a model in which synapse formation is promoted by actin-powered motility. Introduction Motility of spines may facilitate synapse formation and synaptic plasticity (reviewed by Bonhoeffer and Yuste, 2002). Spines are highly dynamic during development both in vitro (Dailey and Smith, 1996; Dunaevsky et al., 1999) and in vivo (Lendvai et al., 2000; Majewska and Sur, 2003). Periods of high motility coincide with synapse formation, and it has been suggested that dendritic motility is important for the establishment of synaptic connections (Ziv and Smith, 1996). In fact, sensory deprivation paradigms that decrease spine motility also disrupt formation of appropriate synaptic circuits (Lendvai et al., 2000). One model suggests that, during synaptogenesis, spine motility permits the sampling of large numbers of potential presynaptic partners; connections are later stabilized via activity-dependent mechanisms (Jontes and Smith, 2000). Spine motility is driven by the actin cytoskeleton (Matus, 2000). Three types of motility have been described: (1) small, rapid changes in spine shape over seconds (Fischer et al., 1998; Korkotian and Segal, 2001b); (2) *Correspondence:
[email protected]
elongation and shortening of spines over minutes (Dailey and Smith, 1996; Dunaevsky et al., 1999; Lendvai et al., 2000; Korkotian and Segal, 2001a; Portera-Cailliau et al., 2003); (3) emergence and retraction of spines over longer times (Maletic-Savatic et al., 1999; Engert and Bonhoeffer, 1999; Trachtenberg et al., 2002; Grutzendler et al., 2002). Little is known about the structure of the spine actin cytoskeleton. Spine actin is mostly in filamentous form, and the time constant of actin turnover is on the order of 40 s (Star et al., 2002). This rapid rate suggests that actin turnover underlies the small, rapid spine shape changes. The relationships between the cytoskeleton and spine growth and retraction are poorly understood. Extrinsic and intrinsic signals likely both influence the rate of motility of dendritic spines. Extracellular signaling molecules can affect the size, shape, or density of dendritic spines (Halpain et al., 1998; McKinney et al., 1999; Ethell et al., 2001; Wong and Wong, 2001; Penzes et al., 2003). In addition, manipulation of many intrinsic spine proteins has been demonstrated to influence spine size, shape, or density (Hayashi and Shirao, 1999; Pak et al., 2001; Penzes et al., 2001; Sala et al., 2001; Ackermann and Matus, 2003; Hering and Sheng, 2003; Meng et al., 2003; Murai et al., 2003; Pak and Sheng, 2003; Passafaro et al., 2003; Sala et al., 2003); one common theme has been the involvement of the Rho family GTPases as downstream effectors on the actin cytoskeleton (Nakayama et al., 2000; Tashiro et al., 2000; Luo, 2002; Ishikawa et al., 2003; Govek et al., 2004). Yet it remains unclear how each protein affects the spine actin cytoskeleton and how these effects are transduced into changes in spine size, shape, or density. NeurabinI (NrbI; Nakanishi et al., 1997) and Spinophilin/NeurabinII (NrbII; Allen et al., 1997; Satoh et al., 1998) are two related proteins with roles in spine morphogenesis. Knockouts of NrbII show increased spine densities during development (Feng et al., 2000), and expression of NrbI in cultured cells causes filopodial outgrowth (Oliver et al., 2002). Both proteins contain N-terminal actin binding domains, PP1 binding domains, PDZ domains, and C-terminal coiled-coil domains. The coiled-coil domain supports homodimerization as well as heterodimerization of NrbI/NrbII (MacMillan et al., 1999; Oliver et al., 2002). Both proteins have been shown to bind F-actin and to promote F-actin crosslinking (Nakanishi et al., 1997; Satoh et al., 1998). Here we used NrbI and NrbI deletion mutants to explore the relationship between spine actin dynamics, spine motility, spine morphogenesis, and synapse formation. We demonstrate that binding to the spine actin cytoskeleton concentrates NrbI in dendritic spines. We show that one NrbI mutant stimulates F-actin polymerization and spine motility, leading to increased spine morphogenesis and synapse formation. Finally, we show that cells with extra synapses downregulate individual response sizes to keep total synaptic input constant.
Neuron 322
ble, indicating that latB treatment did not grossly change spine size. These experiments indicate that an intact actin cytoskeleton is required for GFPNrbI localization in spines. NrbI contains an F-actin binding domain at its N terminus (Figure 3A). Deletion of the actin binding domain in NrbI(286-1095) resulted in a dispersed distribution (Figure 3B), demonstrating that the actin binding domain is necessary for spine localization. In addition, we examined the localization of a truncated mutant of GFPNrbI, GFPNrbI(1-287), containing the actin binding domain but lacking the PP1 binding, PDZ, and coiled-coil domains. This deletion mutant still retained the ability to concentrate in dendritic spines (Figure 3B), thus a short N-terminal fragment of NrbI containing the F-actin binding domain is sufficient to direct localization of GFPNrbI to spines.
Figure 1. GFPNrbI Is Concentrated in Dendritic Spines (A and B) Examples of GFPNrbI fluorescence of dendrites and spines from two transfected hippocampal CA1 neurons. (C and D) Alexa594 fluorescence of the dendritic segments shown in (A) and (B). (E and F) Combined dual color image. Yellow color indicates colocalization of GFPNrbI and Alexa594. GFPNrbI was typically concentrated in the spine head (white arrows). Long, thin filopodial-like protrusions contained strong GFPNrbI staining (white arrowheads). Scale bars, 5 m.
Results The Actin Cytoskeleton Directs Spine Localization of NrbI To probe the role of the spine actin cytoskeleton in spine morphogenesis and synapse formation, we manipulated the expression of the neuronal actin binding protein neurabinI (NrbI) and its mutants. We began by examining the expression of a GFP-tagged NrbI (GFPNrbI) in CA1 pyramidal neurons of hippocampal slice cultures. Cells transfected with GFPNrbI were filled with a red dye (Alexa594) and imaged with two-photon microscopy. GFPNrbI was concentrated in dendritic spines of CA1 pyramidal neurons (Figures 1A–1F). All spines contained GFPNrbI in their spine heads (white arrows in Figures 1A–1F), resembling the distribution of the endogenous protein (Nakanishi et al., 1997; Muly et al., 2004). In addition, long, thin filopodia-like protrusions showed strong GFPNrbI staining (white arrowheads, Figures 1A–1F). As F-actin is concentrated in dendritic spines (Matus et al., 1982), we sought to determine if F-actin binding was required for the localization of GFPNrbI to spines. We used latrunculin B (latB) to transiently disrupt the F-actin cytoskeleton and examined the effects on GFPNrbI distribution. Application of latB (5 M) rapidly (⬍10 min) and reversibly decreased GFPNrbI fluorescence in dendritic spines (Figures 2A and 2B) and increased GFPNrbI fluorescence in dendritic shafts (Figures 2A and 2C). Neurons expressing GFPactin showed a similar shift in fluorescence. In contrast, fluorescence distributions in neurons expressing GFP alone were sta-
NrbI(1-287) Increases Spine Density and Length Previous studies have suggested that NrbI and NrbII may be involved in determining spine numbers and shape (Feng et al., 2000; Oliver et al., 2002). To define a possible role of the actin binding domain of NrbI in spine morphogenesis, we examined the effects of fulllength NrbI and NrbI deletion mutants (Figure 3A) on CA1 pyramidal dendritic spines. Neurons were transfected at 3 days in vitro (DIV), and spine morphology was examined 5–8 days later. We observed a dramatic spine morphogenesis in cells expressing GFPNrbI(1-287) as compared to cells expressing GFPNrbI(1-1095) or GFPNrbI (286-1095) (Figure 3B). To quantify morphology, transfected cells and nearby untransfected neighbors were loaded with Alexa594 through a whole-cell pipette (Figures 3C and 3D) and imaged. Measurements of spine density and length revealed no differences between neurons expressing NrbI(1-1095) and NrbI(286-1095) and control cells. However, expression of GFPNrbI (1-287) caused a dramatic increase in both spine density (1.5-fold) and length (1.6-fold; Figures 3E and 3F). Since GFPNrbI(1-287) is shorter than both GFPNrbI (1-1095) and GFPNrbI(286-1095), we were concerned that higher expression levels for GFPNrbI(1-287) may be responsible for the phenotypic difference. However, several lines of evidence argue against this interpretation. First, we quantified protein expression levels and found that typical cells chosen for analysis expressed the fusion proteins at similar levels in spines (see Experimental Procedures). Second, we observed that the hyperspiny phenotype of GFPNrbI(1-287) was especially pronounced in cells with modest expression levels (Supplemental Figures S1A and S1B [http://www.neuron. org/cgi/content/full/44/2/321/DC1/]). The cells chosen for analysis had normal somatic morphology and dendritic branching patterns compared to neighboring untransfected cells (Supplemental Figures S1C and S1D). Thus, expression of GFPNrbI(1-287), comprising little more than the actin binding domain of NrbI, induced spine morphogenesis in CA1 pyramidal neurons. Actin Binding Domain of NrbI Is Sufficient to Stimulate Spine Morphogenesis We wondered if the ability of NrbI(1-287) to promote spine morphogenesis was solely due to its interaction with the actin cytoskeleton or if perhaps other factors
NrbI Actin Binding in Spine and Synapse Growth 323
Figure 2. Spine Localization of NrbI Requires the Intact Actin Cytoskeleton (A) Time-lapse images of neurons transfected with GFPNrbI, GFPactin, and GFP. Latrunculin B (latB, 5 M) was added to the circulating ACSF after two baseline images and was washed out 10 min later. Time stamps are in minutes. Scale bar, 5 m. (B) Time course of spine fluorescence before, during, and after latB treatment. (C) Time course of dendritic fluorescence before, during, and after latB treatment. Numbers per group are as follows: GFP, 14 spines, 8 dendrites; GFPNrbI, 12 spines, 13 dendrites; GFPactin, 17 spines, 10 dendrites.
Figure 3. Expression of GFPNrbI(1-287) Increases Spine Length and Density (A) Schematic of NrbI and deletion mutants. NrbI(1-1095) is the full-length protein. (B) Dendrites and spines of CA1 pyramidal neurons expressing GFPNrbI(1-1095), GFPNrbI(286-1095), or GFPNrbI(1-287). Scale bar, 5 m. (C and D) Transfected cells (GFP signal, green) were filled with a red dye (Alexa594 signal, red). Yellow color indicates colocalization of GFP signal with red dye fill. Untransfected neighboring cells were filled with Alexa594 and quantified as controls (E). Scale bar, 50 m. (E) GFPNrbI(1-287)-expressing cells had significantly higher spine densities than untransfected cells (p ⬍ 0.0001). Spine densities of GFPNrbI(11095) and GFPNrbI(286-1095) cells were not significantly different from spine densities in untransfected neighbors. (F) GFPNrbI(1-287) but not GFPNrbI(1-1095) and GFPNrbI(286-1095) expressing cells had longer spines than untransfected neighbors (p ⬍ 0.0001). Number of cells and number of spines per group: GFPNrbI(1-287), 18 cells, 3797 spines; untransfected, 18 cells, 2841 spines; GFPNrbI(1-1095), 3 cells, 404 spines; GFPNrbI(286-1095), 3 cells, 554 spines.
Neuron 324
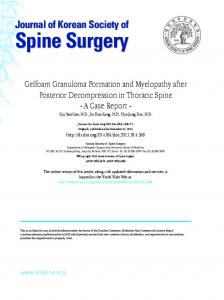
Figure 4. Actin Binding Domain Is Sufficient for Spine Morphogenesis (A) Raw data for a FRAP experiment of GFPNrbI. Colored boxes in the first panel show regions where fluorescence intensity was measured. Time stamps are in seconds. One spine (red box, red arrows) was bleached between 40 and 50 s. Scale bar, 2 m. (B) Fluorescence intensity values corresponding to the boxes in (A). Red, bleached spine; blue, unbleached neighboring spine; green, background. (C) FRAP of GFPactin (open triangles), GFPNrbI(1-1095) (open squares), GFPNrbI(1-287) (open circles), and GFPNrb287mut (solid circles). Number of cells and number of spines per group: GFPactin, 5 cells, 16 spines; GFPNrbI(1-1095), 8 cells, 26 spines; GFPNrbI(1-287), 8 cells, 27 spines; GFPNrb287mut, 3 cells, 15 spines. (D) Alignment of the N termini of NrbI and NrbII. Sequence identities and strong similarities are highlighted in red. The boxed region was deleted to make Nrb287mut. (E) Combined dual color image of a cell expressing GFPNrb287mut (green), filled with Alexa594 (red). Yellow color indicates colocalization of GFPNrb287mut and Alexa594. GFPNrb287mut was concentrated in the spine head (white arrows) and in thin, filopodial-like protrusions (white arrowheads). Scale bar, 5 m. (F) GFPNrb287mut-expressing cells had significantly higher spine densities than untransfected cells (p ⬍ 0.01). (G) GFPNrb287mut-expressing cells had longer spines than untransfected neighbors (p ⬍ 0.001). Number of cells and number of spines per group: GFPNrb287mut, 8 cells, 1829 spines; untransfected, 8 cells, 1375 spines.
were involved. We used fluorescence recovery after photobleaching (FRAP) to characterize the NrbI isoforms (Figures 4A and 4B). If binding to F-actin alone directs NrbI localization to dendritic spines, the time course of FRAP for GFPNrbI should be similar to or faster than that for GFPactin, depending on the offrate of GFPNrbI from F-actin. Instead, GFPNrbI(1-1095) recovered significantly more slowly than GFPactin [Figure 4C; ⫽ 78 ⫾ 12 s for GFPNrbI(1-1095) versus 42 ⫾ 6 for GFPactin], providing evidence for additional binding partners that stabilize NrbI(1-1095) in spines. The kinetics of recovery for NrbI(1-287) were even slower than for NrbI(1-1095) [Figure 4C; ⫽ 136 ⫾ 18 s for GFPNrbI
(1-287), p ⬍ 0.02]. This implies that the stabilizing partner for NrbI(1-1095) binds NrbI somewhere in the first 287 amino acids and that the truncated protein has a stronger affinity for this protein than does the fulllength protein. Our FRAP data suggest an additional binding partner for neurabinI, which helps to stabilize NrbI in dendritic spines. Where exactly does this partner bind? In order to pinpoint regions of potential interest, we mapped conserved domains between NrbI and NrbII. Alignment of the N termini of NrbI and NrbII revealed five regions of high conservation (Figure 4D); four of these were within the previously defined actin binding domain
NrbI Actin Binding in Spine and Synapse Growth 325
(amino acids 1–144; Nakanishi et al., 1997). One, NrbI(196-210), was outside this domain. We used sitedirected mutagenesis to delete amino acids 196–210 from GFPNrbI(1-287) to create GFPNrb287mut. Similar to GFPNrbI and GFPNrbI(1-287), GFPNrb287mut was highly concentrated in dendritic spines of CA1 pyramidal neurons (Figure 4E), confirming that GFPNrb287mut retained the ability to bind the spine actin cytoskeleton. Does deletion of amino acids 196–210 from NrbI(1-287) abolish binding of the putative partner? To address this question, we measured the time course of FRAP for GFPNrb287mut. GFPNrb287mut fluorescence recovered significantly faster than GFPNrbI(1-1095) or GFPNrbI (1-287) (Figure 4C, filled symbols), suggesting loss of interaction with the additional binding partner(s) that stabilized NrbI(1-1095) and NrbI(1-287) in spines. In fact, the recovery of GFPNrb287mut was similar to GFPactin (Figure 4C; ⫽ 25 ⫾ 2 s). Thus, the stabilizing partner for NrbI binds at amino acids 196–210. Could the stabilizing partner play a role in the spine morphogenesis phenotype? Similar to GFPNrbI(1-287), GFPNrb287mut had significantly higher spine densities than untransfected cells (1.2-fold; Figure 4F) and increased spine lengths (1.3-fold; Figure 4G). However, the changes were much smaller than those observed for GFPNrbI(1-287) (Figures 3E and 3F), demonstrating that deletion of amino acids 196–210 from GFPNrbI (1-287) decreased its ability to induce spine morphogenesis but did not abolish it completely. Thus, although the actin binding domain of NrbI is sufficient to stimulate spine morphogenesis, binding to the stabilizing partner in spines potentiates the effect. NrbI(1-287) Causes Actin Polymerization How does expression of NrbI(1-287) lead to growth of dendritic spines? We wondered if NrbI(1-287) could change the actin cytoskeleton so as to favor the growth of dendritic protrusions. We assayed the dynamics and organization of the actin cytoskeleton in dendritic spines using FRAP of GFPactin (Figures 5A and 5B). FRAP of actin is characterized by three time constants (Star et al., 2002). The recovery time for freely diffusing monomer is short (⬍1 s, shorter than our sampling interval). The recovery time due to cycling of F-actin is significantly longer (⬎10 s). A small stable pool of actin (with very long time constants) has also been reported. FRAP can also assess the proportion of actin existing in “mobile” (fmobile, monomeric, freely diffusing), “dynamic” (fdynamic, F-actin polymer), or “stable” forms (fstable, Figure 5C; Supplemental Experimental Procedures [http://www. neuron.org/cgi/content/full/44/2/321/DC1/]; Star et al., 2002). We measured FRAP of GFPactin alone and in cells cotransfected with NrbI(1-287). The rate of turnover of F-actin was not significantly different in the presence of NrbI(1-287) [Figure 5D; dynamic ⫽ 48 ⫾ 10 s for GFPactin ⫹ NrbI(1-287) versus 42 ⫾ 6 s for GFPactin]. However, we did observe a dramatic shift in the proportions of spine actin in the monomeric as opposed to the filamentous form (Figure 5E). For GFPactin alone, fmobile ⫽ 0.46 and fdynamic ⫽ 0.51. In the presence of NrbI(1-287), these distributions shifted to fmobile ⫽ 0.28 and fdynamic ⫽ 0.68. The stable fraction was small under both conditions (Figure
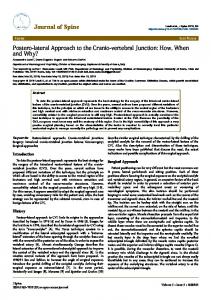
5E). Thus, NrbI(1-287) caused a shift of the equilibrium from monomeric to filamentous actin. A potential complication of these measurements would be if simultaneous expression of NrbI(1-287) affected the expression level of GFPactin. Assuming the existence of a mechanism to set the filamentous spine actin at a constant steady-state level, a decrease in the overall actin expression level could then lower the monomeric actin level and cause an apparent increase in the proportion of actin in the filamentous form. However, we consider this explanation unlikely. First, the fluorescence level was not significantly different between cells with and without NrbI(1-287) (see Experimental Procedures). Second, in previous experiments it has been observed that expression levels of GFPactin can vary by more than an order of magnitude without an effect on fdynamic (Star et al., 2002). NrbI(1-287)-Induced Spines Make Synapses Previous studies and models have suggested that stabilization of a nascent spine requires contact with a presynaptic element (Ziv and Smith, 1996; Jontes et al., 2000; Trachtenberg et al., 2002). Does the NrbI(1-287)induced increase in spine density (Figure 3E) also reflect an increase in the number of synapses? To address this question, we performed serial section electron microscopy (SSEM) and 3D reconstructions on dendrites from cells expressing NrbI(1-1095) and NrbI(1-287) that had been previously imaged (Figures 6A and 6B; Supplemental Figure S2 [http://www.neuron.org/cgi/content/ full/44/2/321/DC1/]). In a dendritic segment (length ⫽ 74 m) reconstructed from an NrbI(1-1095) cell, we detected 31 spines and 24 synapses (10 shaft synapses, 14 spines with one synapse; Figure 6A; Supplemental Figure S2 [http://www. neuron.org/cgi/content/full/44/2/321/DC1/]). In a 15 m dendritic segment reconstructed from an NrbI(1-287) cell, we observed 13 spines and 9 synapses (one shaft synapse, six spines with one synapse, and one spine with two synapses; Figure 6B). Thus, there was a 2-fold increase in both spine density and synapse density for NrbI(1-287) dendrites versus NrbI(1-1095) dendrites. The fraction of spines with synapses was significantly higher on dendrites from NrbI(1-287)-expressing cells (0.54 ⫾ 0.12) than from NrbI(1-1095)-expressing cells (0.45 ⫾ 0.09; p ⬍ 0.02). These observations are consistent with the interpretation that spines from NrbI(1-287)-expressing neurons have synapses, perhaps even at higher rates than normal. Thus, overexpression of a truncated NrbI(1287) stimulated the formation of new spine synapses. Spines from the reconstructed dendrites provided a high-resolution look at GFPNrbI localization (Figures 6C–6H). We observed no obvious difference in the distribution of GFPNrbI(1-1095) and GFPNrbI(1-287) in dendrites and spines. Concentrated DAB labeling corresponding to GFPNrbI was always seen associated with dendritic spines, completely filling the spine (Figure 6C) or in the spine neck (Figure 6D). It was not possible to classify synapses as either symmetric or asymmetric, and therefore inhibitory or excitatory. In a few cases we observed what appeared to be a new filopodium extending from a site of concentrated NrbI staining (Figure 6E). The PSD regions of dendritic shaft synapses
Neuron 326
Figure 5. GFP-NrbI(1-287) Causes Actin Polymerization (A) Raw data for a FRAP experiment of GFPactin. Colored boxes in the first panel show regions where fluorescence intensity was measured. Time stamps are in seconds. One spine (red box, red arrows) was bleached between 40 and 50 s. Scale bar, 2 m. (B) Fluorescence intensity values corresponding to the boxes in (A). Red, bleached spine; blue, unbleached neighboring spine; green, background. (C) Schematic illustrating the interpretation of FRAP experiments (adapted from Star et al., 2002; Supplemental Experimental Procedures [http://www.neuron.org/cgi/content/full/44/2/321/DC1/]). (D) FRAP of GFPactin in the absence (open triangles) or presence (open squares) of NrbI(1-287). Number of cells and number of spines per group: GFPactin ⫹ synNrbI(1-287), 5 cells, 23 spines. GFPactin data is the same as in Figure 4C. (E) Fraction of GFPactin in mobile, dynamic, or stable forms in the absence (open bars) or presence (shaded bars) of NrbI(1-287). In the presence of NrbI(1-287), there was significantly more GFPactin in the dynamic, filamentous form (p ⬍ 0.01) and significantly less GFPactin in the mobile form (p ⬍ 0.01).
also showed strong GFPNrbI staining (Figure 6F). Sometimes intense DAB labeling was observed in regions of the dendrite that closely apposed a presynaptic bouton even in the absence of a synaptic contact (Figures 6G and 6H). Compensation in Synaptic Strength Keeps Total Synaptic Input Constant in Cells Expressing NrbI(1-287) Since cells overexpressing GFPNrbI(1-287) have increased spine and synapse densities and similar dendritic arbors (Supplemental Figures S1C and S1D [http:// www.neuron.org/cgi/content/full/44/2/321/DC1/]), they likely have more synapses overall. What are the consequences of an increase in the number of synapses? If individual synapses in control and NrbI(1-287) transfected cells have on average the same strength, one would expect increased synaptic input for transfected neurons. To probe synaptic input, we simultaneously recorded from a pair of transfected and neighboring untransfected neurons while stimulating presynaptic neurons using laser scanning photostimulation (LSPS; Figures 7A and 7B; Supplemental Figure S3). LSPS provides an estimate of the total local synaptic input to the recorded neurons (Shepherd et al., 2003) and offers an advantage over conventional extracellular electrical stimulation in that many more presynaptic sites can be
tested. Remarkably, the average response sizes for NrbI(1-287) cells and untransfected neighbors were indistinguishable (Figure 7C). Thus, despite the increase in the number of synapses in the NrbI(1-287) neurons, the total synaptic input was not changed. These measurements suggest that in NrbI(1-287) cells individual synaptic strengths were downregulated to compensate for more synapses. To test this, we recorded spontaneous miniature excitatory postsynaptic currents (mEPSCs). mEPSC amplitudes were reduced in cells expressing NrbI(1-287) compared to controls (Figures 7D and 7E), consistent with a downregulation. A decrease in mEPSC amplitude is expected to cause a decrease in the frequency of detected mEPSCs because the smallest responses will disappear into the recording noise (Zhou et al., 2000). However, we observed that frequencies of detected mEPSCs were unchanged for NrbI(1-287) (Figure 7F), despite the decrease in amplitude, implying a higher frequency of smaller mEPSCs in cells expressing NrbI(1-287) compared to controls, and consistent with a larger number of relatively smaller synapses. This result implies that the increased density of synaptic inputs for NrbI(1-287) cells was accompanied by a downregulation of the strength of individual synapses to keep total synaptic input constant. Spines in NrbI(1-287) neurons were longer and thinner than spines in control neurons. These spines could har-
NrbI Actin Binding in Spine and Synapse Growth 327
Figure 6. NrbI(1-287)-Induced Spines Make Synapses (A) EM reconstruction of 19 m of dendrite from a cell expressing GFPNrbI(1-1095), displayed at two viewing angles. The cell was imaged on a two-photon microscope immediately prior to fixation and staining for GFP. Basal dendrites close to the cell body were chosen for serial section analysis. Yellow box shows imaged region corresponding to the reconstructed region. The portion of dendrite shown is only part of the entire 74 m dendritic segment reconstructed (Supplemental Figure S2 [http://www.neuron.org/cgi/ content/full/44/2/321/DC1/]). (B) EM reconstruction of 15 m of dendrite from a cell expressing GFPNrbI(1-287), displayed at two viewing angles. The cell was imaged on a two-photon microscope immediately prior to fixation and staining for GFP. Basal dendrites close to the cell body were chosen for serial section analysis. Yellow box shows imaged region corresponding to the reconstructed region. (C) Electron micrograph of GFPNrbI(1-287) staining in the head of a dendritic spine. Scale bar, 0.5 m for (C)–(H). (D) GFPNrbI(1-1095) staining in the neck of a spine with a perforated synapse. (E) GFPNrbI(1-1095) staining in a filopodia-like structure. (F) A dendritic shaft synapse with strong concentration of GFPNrbI(1-1095) in the vicinity of the PSD. (G and H) Concentrated GFPNrbI(1-1095) staining in the dendrite apposing a presynaptic element ([G], arrowhead) with little evidence of a synapse in this section or any others in this series. The same presynaptic element synapses with a spine head ([H], arrowhead).
bor relatively immature synapses, characterized by few AMPARs and relatively many NMDARs (Durand et al., 1996; Isaac et al., 1995; Liao et al., 1995). Alternatively, the strengths of individual synapses may be downregulated homeostatically, involving changes both in AMPARs and NMDARs (Watt et al., 2000; Turrigiano et al., 1998). To distinguish between these two possibilities, we measured the ratio of AMPAR and NMDAR mediated currents simultaneously in transfected and neighboring untransfected neurons. Glutamatergic currents were evoked by uncaging of glutamate directly onto dendrites in the presence of TTX (1 m) to block spiking. AMPAR currents were measured at ⫺65 mV and NMDAR receptor currents at ⫹40 mV. We found no significant difference in the AMPA/NMDA current ratios for the two groups (Figures 7G and 7H). This lack of difference implies that NMDAR currents are scaled down at a similar level to AMPAR currents, supporting the homeostatic model. Spines Expressing NrbI(1-287) Exhibited Increased Motility How does NrbI(1-287), a truncated protein constituting little more than the actin binding domain of GFPNrbI, stimulate synaptogenesis? Synapse formation requires contact between dendrite and axon, stabilization of the contact, and assembly of the proteins required for synaptic transmission. Contact can be initiated by dendrites through growth of dendritic protrusions. One possibility is that NrbI(1-287) increases the probability that transient contacts are stabilized, leading to a larger number of stable contacts and synapses. A second possibility
is that NrbI(1-287) increases the number of transient contacts while leaving the probability of contact stabilization unchanged. To gain insight into the process of synapse formation, we performed time-lapse imaging of neurons undergoing synapse formation. Neurons expressed either GFP alone or GFP cotransfected with NrbI(1-287) or NrbI (1-1095). After 2 days of expression, neurons expressing NrbI(1-287) already exhibited a dramatic phenotype; although an increase in density of protrusions was not yet apparent, most spines appeared much longer and thinner than in control neurons (Figure 8A; Supplemental Figure S4 [http://www.neuron.org/cgi/content/full/44/2/ 321/DC1/]). We measured spine addition and subtraction and spine motility (Figure 8; Supplemental Figure S5). The spine turnover ratios (the fraction of spines gained or lost per 15 min interval) were similar in NrbI (1-287)-expressing and control neurons (Figure 8B). We further quantified spine turnover by measuring the lifetime of each spine as the time interval over which it was present during the time-lapse imaging session. The distribution of spine lifetimes revealed no significant differences (Figure 8C). Thus, expression of NrbI(1-287) did not affect spine lifetime or turnover ratios. We next measured the motility of individual spines by summing the absolute length of extension and retraction per spine over 15 min intervals. NrbI(1-287) cells exhibited increased spine motility compared to cells transfected with NrbI(1-1095) or GFP alone (Figure 8D). This increase in motility could reflect a dramatic increase in the sampling of the surrounding volume for potential synaptic partners. We quantified this into a metric that we termed the Exploration Index, or the total spine
Neuron 328
Figure 7. Smaller Miniature Current Size Keeps Total Synaptic Input Constant in Cells Expressing GFPNrbI(1-287) (A) Schematic of the recording configuration for measuring synaptic responses. We simultaneously recorded from transfected (green) and neighboring untransfected (blue) neurons while stimulating presynaptic cells using LSPS (Experimental Procedures). Inset shows cell bodies and proximal dendrites from one pair of simultaneously recorded cells. (B) Examples of synaptic responses from untransfected cells (blue) and GFPNrbI(1-287)transfected cells (green). Vertical black line marks time of stimulus. (C) Average synaptic response amplitude from pairs of NrbI(1-287) transfected (y axis) versus untransfected (x axis) cells; each pair is represented by an open circle. There was no significant difference in overall average synaptic response size for NrbI(1-287) and untransfected cells (solid black circle). We analyzed seven GFPNrbI(1-287) cells and seven untransfected neighbors. (D) Cumulative frequency plot of mEPSCs recorded at ⫺65 mV from NrbI(1-287) (green line) and untransfected (blue line) cells. Inset shows representative traces from one NrbI(1-287) and one untransfected cell. We analyzed five GFPNrbI(1-287) cells and five untransfected neighbors. (E) NrbI(1-287) cells (black bar) show a significant decrease in average mEPSC amplitude from control untransfected cells (open bar) (p ⬍ 0.03, paired Student’s t test). (F) NrbI(1-287) cells (black bar) show no significant difference in mEPSC frequency from control untransfected cells (open bar). (G) Examples of direct, glutamate-evoked responses for untransfected cells (blue) and GFPNrbI(1-287)-transfected cells (green). AMPA responses were recorded at ⫺65 mV (lower traces), NMDA responses at ⫹40 mV (upper traces). (H) There was no significant difference in AMPA/NMDA ratio for NrbI(1-287) (black bar) and untransfected cells (open bar). We analyzed four GFPNrbI(1-287) cells and four untransfected neighbors.
length changes per micron of dendrite per 15 min interval; NrbI(1-287) cells showed a highly significant increase (Figure 8E). As NrbI(1-287) expression dramatically affected spine motility and exploration but did not affect spine lifetimes or turnover ratios, our results are consistent with a model whereby an increase in the number of transient contacts leads to the increase in synaptogenesis caused by NrbI(1-287). Discussion Spine motility, driven by actin dynamics, is thought to allow the postsynaptic neuron to explore and sample presynaptic partners (Bonhoeffer and Yuste, 2002). Spine motility also causes spine shape and size changes associated with changes in synaptic efficacy (Matsuzaki et al., 2004). Here we examined actin dynamics and spine motility to characterize changes in the spine actin cytoskeleton that promote spine morphogenesis and synaptogenesis. By manipulating the expression of the neuronal actin binding protein NrbI and NrbI deletion mutants, we obtained evidence that regulation of the spine actin cytoskeleton can be sufficient to stimulate spine morphogenesis and synapse formation. We dem-
onstrated that an NrbI variant, NrbI(1-287), that promoted increased spine F-actin polymerization also initiated spine morphology changes and increased spine motility, resulting in an increased formation of spines and synapses. Furthermore, the cells with extra synapses homeostatically downregulate individual response sizes to keep total synaptic input constant. Spine Actin Dynamics and Spine Motility The motility of dendritic spines is shaped by cell adhesion interactions and the protrusive forces of actin polymerization. Previous studies have shown that proteins known to affect actin cytoskeletal structure and dynamics can alter spine densities and spine shapes (Hayashi and Shirao, 1999; Nakayama et al., 2000; Irie and Yamaguchi, 2002; Ackermann and Matus, 2003; Hering and Sheng, 2003; Meng et al., 2003; Penzes et al., 2003). Here we probed not only changes in spine morphologies, lengths, and densities, but also spine actin dynamics and spine motility. How is the spine actin cytoskeleton regulated to control spine motility? Even in the most stable mushroom spines, the entire actin cytoskeleton turns over in tens of seconds (Figure 5D; Star et al., 2002; Fischer et al.,
NrbI Actin Binding in Spine and Synapse Growth 329
Figure 8. Spines Expressing GFPNrbI(1-287) Exhibited Increased Motility (A) Time-lapse images of CA1 pyramidal neurons transfected with GFP alone, with both GFP and GFPNrbI(1-287), or with both GFP and GFPNrbI(1-1095) following 2 days of expression. Time stamps are in minutes. Scale bar, 5 m. (B) Turnover ratios were not significantly different for NrbI(1-287) cells (open triangles) or NrbI(1-1095) cells (open squares) from GFP alone cells (solid diamonds). Number of cells and number of spines per group are as follows: GFP alone, 4 cells, 268 spines; GFP ⫹ GFPNrbI(1-287), 3 cells, 256 spines; GFP ⫹ GFPNrbI(1-1095), 3 cells, 177 spines. (C) Spine lifetimes were not significantly different for NrbI(1-287) cells (open triangles) or NrbI(1-1095) cells (open squares) from GFP alone cells (solid diamonds). (D) There was a significant increase in spine motility for NrbI(1-287) cells (open triangles) compared to GFP alone cells (solid diamonds) or NrbI(1-1095) cells (open squares). (E) The Exploration Index, a reflection of the total length traversed by all spines per unit length of dendrite, was significantly higher in NrbI(1-287) cells (shaded bar) than in NrbI(11095) cells (solid bar) (p ⬍ 0.02) or GFP only cells (open bar) (p ⬍ 0.01).
1998). Regulation of the growth and retraction of spines therefore must be accomplished by adjustment of the rate or manner in which spine actin is polymerizing, rather than by the absence or presence of spine actin turnover. This could be accomplished through the action of proteins that affect actin cytoskeletal dynamics (e.g., small GTPases: Hall and Nobes, 2000; Nakayama et al., 2000; Penzes et al., 2003) in response to intrinsic or extrinsic signals, such as glutamate, which has been shown to influence both spine actin dynamics (Star et al., 2002) and spine motility (McKinney et al., 1999; Fischer et al., 2000; Wong and Wong, 2001). Expression of NrbI(1-287) caused an increase in spine motility and an increase in F-actin content in spines. How would an increase in F-actin lead to an increase in spine motility? Addition of spine F-actin could result from one of two mechanisms. First, each individual F-actin filament could lengthen. Second, the total number of F-actin filaments could increase through filament nucleation. One popular model for actin-powered motility is the “elastic Brownian ratchet model,” in which the addition of new actin subunits pushes on the membrane (Mogilner and Oster, 1996; Pollard et al., 2000). A larger number of actin filaments would imply larger protrusive
forces and perhaps increased spine growth in the viscoelastic environment of the brain. This picture is consistent with increased rates of spine growth (Figure 8), even without changes in the rate of actin turnover (Figure 5). Spine Motility and Synaptogenesis How does alteration of the spine actin cytoskeleton lead to synaptogenesis? The establishment of synaptic connections can be broken down into three steps: initial transient contact between axon and dendrite, stabilization of appropriate contacts, and assembly of pre- and postsynaptic molecules required for synaptic transmission. The spine actin cytoskeleton could act at any one of these steps to facilitate synapse formation. At the first step, alteration of the spine actin cytoskeleton could lead to synapse formation by increasing the rate of transient contacts between dendrites and axons. In this model, stabilization of transient contacts occurs at normal rates, but because there are more transient contacts, the rate of synapse formation is increased. How might changes in the actin cytoskeleton lead to increased rates of transient contacts? One way could be through increasing the motility of dendritic spines. Another way could be through increasing the rate of
Neuron 330
initiation of new filopodia. Either case would result in increased exploration of surrounding neuropil for potential partners and thus would lead to an increased rate of transient contacts. Our observation of a dramatic increase in spine motility provides support for such a model. At the second step, alteration of the spine actin cytoskeleton could lead to synapse formation through increasing the stability of transient synaptic contacts. In this model, dendritic spines initiate, grow, and retract at the same rate as they do normally, making transient contacts at normal rates. However, there is a higher probability that the establishment of a transient connection will lead to a stable connection. How could changes in the actin cytoskeleton lead to increased stabilization of transient contacts? The spine actin cytoskeleton acts as an anchor point for many synaptic proteins (Allison et al., 1998; Wyszynski et al., 1998). It could be that the actin cytoskeleton is altered in such as way as to increase the stability of these proteins at nascent synapses, thus increasing the probability of contact stabilization. In fact, manipulations that increase synaptic strength have been shown to increase spine F-actin content (Fukazawa et al., 2003). Our observations of increased spine F-actin suggest that such a mechanism could also be contributing to the increased synaptogenesis that we observed. Postsynaptic expression of NrbI(1-287), a protein that promotes actin polymerization, induces spine growth and synapse formation. The additional observation of increased spine motility suggests that the protrusive forces produced by actin polymerization enhance contact formation. However, long-term time-lapse imaging experiments that capture the accumulation of additional spine synapses would be required to rigorously exclude the additional possibility that actin stabilization promotes contact stabilization. Homeostatic Regulation of Neuronal Excitability Our experiments provide new insights into homeostatic mechanisms that act in a cell-autonomous level to regulate excitability. Recent studies have shown that synapses in cortical neurons undergo homeostatic plasticity to control neural activity (Turrigiano and Nelson, 2004). For example, silencing a single neuron by expressing a potassium channel leads to a cell-autonomous upregulation of synaptic input to restore activity to normal levels (Burrone et al., 2002). Other experiments have demonstrated that increasing global activity levels cause a downregulation of synaptic input (Turrigiano et al., 1998). In our experiments, the number of synapses increased in cells expressing NrbI(1-287). Interestingly, we find that cells expressing NrbI(1-287) have the same amount of synaptic input as control cells. Our results imply that neurons compensate for more synapses by downregulating synaptic strength. Therefore, homeostatic mechanisms can downregulate synaptic strength in a cell-autonomous manner in response to increased synaptic input.
tion to of NrbI to dendritic spines is dependent on the spine actin cytoskeleton. These results are consistent with an emerging theme in which binding F-actin directs localization of postsynaptic proteins to spines (Shen et al., 1998; Hayashi and Shirao, 1999; Grossman et al., 2002). Second, our FRAP measurements in dendritic spines revealed that NrbI is considerably more stable than actin in dendritic spines, implying that NrbI is stabilized in spines by binding to scaffolds in addition to actin. The existence of such scaffolds has been demonstrated using latrunculin to depolymerize the spine actin cytoskeleton (Allison et al., 2000; Zhang and Benson, 2001). We identified the region of NrbI that is responsible for NrbI stabilization in spines as amino acids 196–210. None of the known interactions of NrbI (actin [Nakanishi et al., 1997], protein phosphatase I [MacMillan et al., 1999; Oliver et al., 2002], kalirin-7 [Penzes et al., 2001], p70S6K [Burnett et al., 1998], TGN38 [Stephens and Banting, 1999], or NrbII [MacMillan et al., 1999]) map to this site. Therefore, we propose the existence of an additional binding partner for NrbI that stabilizes NrbI in spines. Third, we obtained further evidence for a role of NrbI in spine morphogenesis. Previous experiments in dissociated neuronal cultures suggested that NrbI(1-1095) expression could stimulate an increase in the density and size of dendritic spines (Oliver et al., 2002). In our brain slice culture experiments, however, we observe no effect of NrbI(1-1095) on the density of spines, and a small, but not significant, increase in spine length. Instead, we observed that a NrbI deletion mutant, NrbI(1287), strongly promoted actin polymerization and spine morphogenesis. Disruption of the binding partner interaction at amino acids 196–210 in Nrb287mut resulted in decreased ability to stimulate spine morphogenesis. Although it is not clear exactly how the effects of this truncated protein relate to the function of the endogenous protein, we suggest the following relationship. We propose that the NrbI actin binding domain and the binding partner act together to promote spine morphogenesis and that their actions are negatively regulated by proteins that bind the C-terminal part of NrbI. NrbI can heteromultimerize with NrbII through its C-terminal coiled-coil sequences (Oliver et al., 2002) and has been isolated in complexes with NrbII from brain extracts in PP1 holoenzymes (MacMillan et al., 1999). In addition, NrbII knockout mice have increased spine densities (Feng et al., 2000), implicating NrbII as a negative regulator of spine morphogenesis. It is possible that NrbII acts as a negative regulator of NrbI N-terminalinduced spine morphogenesis through its interactions with the C terminus of NrbI. Our observations that NrbI strongly stained dendritic filopodia (Figures 1 and 6) and that NrbI could be found at sites of contact between dendrites and axons and at the base of short filopodia (Figure 6) further support a role for NrbI in spine morphogenesis, perhaps acting to promote initiation of nascent dendritic filopodia. Experimental Procedures
Implications for Endogenous NrbI Function Our experiments also provide significant new insights into NrbI function. First, we demonstrated that localiza-
DNA Constructs and Mutagenesis GFPNrbI(1-1095) and GFPNrbI(286-1095) have been described (Oliver et al., 2002). GFPNrbI(1-287) was created by ligating the BglII/
NrbI Actin Binding in Spine and Synapse Growth 331
KpnI fragment of full-length NrbI into BglII/KpnI-digested pEGFP-C1 (Clontech). To express GFP alone, we used pEGFP-N1 (Clontech). GFPactin was from Yukiko Goda (Morales et al., 2000). syn-NrbI (1-287) is without a GFP tag under control of the synapsinI promoter (Kugler et al., 2001). We used the QuickChange Site-Directed Mutagenesis Kit (Stratagene) and the oligo 5⬘-CTGAGCCCTCGGACGAA CAGTGAGTCTCCAG-3⬘ to delete amino acids 196–210 of NrbI (1-287). Hippocampal Culture, Transfection, and Immunostaining Hippocampal slices were prepared from P6 or P7 rats as described (Shi et al., 2001; Stoppini et al., 1991). Genes were delivered at 3–5 DIV using biolistic gene transfer (180 psi, Helios gene gun, Bio-Rad; McAllister, 2000). Plasmid DNAs were coated onto 1.6 m gold beads; for a standard preparation, we used 15 g of pEGFP-N1, 18 g of GFPNrbI(1-287), 25 g of GFPNrbI(1-1095), 18 g of GFPactin, 23 g of syn-NrbI(1-287), or 30 g of syn-NrbI(1-1095). Coexpression was achieved by coating the beads with two DNAs and was confirmed by immunostaining. In brief, slices were fixed overnight at 4⬚C in 4% paraformaldehyde, blocked overnight at 4⬚C in 5% goat serum plus 0.3% Triton X-100, incubated overnight at 4⬚C in primary antibody to NrbI (BD Transduction Laboratories, #611088), incubated 1.5 hr at room temperature in secondary antibody (Alexa594 goat anti-mouse, Molecular Probes, #A-11032). Latrunculin Experiments Transfected cells were imaged every 10 min in perfusing artificial cerebrospinal fluid (ACSF) at 5–8 days after transfection. latB (5 M) was added after 12 min baseline for a 10 min period followed by an ACSF wash. Average pixel intensity was measured for the spine or dendrite at each time point, background was subtracted, and data were normalized to the average initial fluorescence value. Double Labeling and Quantification of Spine Lengths and Densities Transfected hippocampal CA1 neurons and untransfected neighbors were loaded with Alexa594 (Molecular Probes) through a patch pipette at 5–8 days after transfection and imaged using a custombuilt two-photon microscope. The microscope was controlled with ScanImage (Pologruto et al., 2003), the objective was from Zeiss (NA 0.9, 63⫻), and the laser was from Coherent (Mira 900F). Excitation wavelengths were 910 nm (GFP) and 810 nm (Alexa594). Cells with excessive overexpression were excluded. For each cell, three segments of secondary basal dendrites and three segments of secondary apical dendrites were sampled. Image stacks consisted of sections (512 ⫻ 512 pixels; ⵑ0.07 m/pixel) collected in 1 m steps. Care was taken to achieve close to identical fluorescence levels across imaged regions and imaging sessions. All images in the figures are projections of 3D stacks. All clear protrusions emanating laterally from the dendritic shaft, irrespective of shape, were counted and measured in the red (Alexa594) images. Data were analyzed using custom MATLAB software (Mathworks). Unless otherwise noted, error bars report standard error of the mean and statistical significance was determined using Student’s t test. Fluorescence Recovery after Photobleaching At 2–5 days after transfection, images were acquired every 10 s (ⵑ12 mW in the back focal plane). After five baseline time points, spines were bleached by increasing zoom to include only the spine of interest and increasing the power to ⵑ50 mW for five continuous frames (total illumination ⵑ2.5 s). Most spines were measured twice; only spines that eventually recovered were included. Average pixel intensity was measured for the spine at each time point, background was subtracted, and data were normalized to the average baseline intensity. Values from three to five spines were averaged for each cell; these values were then averaged across cells. Time constants and mobile and dynamic fractions were calculated by fitting the recovery curve of each cell with a single exponential (Figure 5C; Supplemental Experimental Procedures [http://www.neuron.org/ cgi/content/full/44/2/321/DC1/]): f ⫽ fmobile ⫹ fdynamic 1 ⫺ exp(⫺t/dynamic). To calculate the stable fraction we used
fstable ⫽ 1 ⫺ (fmobile ⫹ fdynamic). Rapid (2 ms) fluorescence measurements during the bleaching pulse used in our FRAP experiments revealed that bleaching of F-actin was more than 99% complete. Quantification of Expression Levels Expression levels of GFP-tagged proteins were compared by measuring fluorescence intensity of single spines at a set power level. We assumed no systematic differences in the depths of imaged dendrites in the brain slice. There was no significant difference in the spine expression levels of GFPNrbI(1-1095) (19 ⫾ 4 fluorescence units; 13 spines from 3 cells), GFPNrbI(1-287) (23 ⫾ 5 fluorescence units; 17 spines from 4 cells), and GFPNrb287mut (35 ⫾ 9 fluorescence units; 15 spines from 3 cells), measured at ⵑ12 mW in the back focal plane. In addition, there was no significant difference in the spine expression levels of GFPactin alone (48 ⫾ 14 fluorescence units; 14 spines from 3 cells) versus GFPactin in the presence of NrbI(1-287) (44 ⫾ 20 fluorescence units; 14 spines from 3 cells), measured at ⵑ6 mW in the back focal plane. Electron Microscopy Immediately after imaging, slices were immersed in a solution of 0.2% gluteraldehyde and 2% paraformaldehyde in 0.1 M phosphate buffer (4⬚C, pH 7.4) and microwaved for 8 s. Slices were then cryoprotected and freeze thawed in liquid nitrogen. After blocking in 0.1% BSA, they were incubated overnight in primary antibody at 4⬚C (anti-GFP, Chemicon, #AB3080), followed by biotinylated secondary antibody for 4 hr before being incubated in avidin biotin peroxidase complex and revealed with DAB. Sections were postfixed in 1% osmium tetroxide in 0.1 M cacodylate buffer, dehydrated in a series of increasing concentrations of alcohol, and then embedded in Epon resin and mounted between glass slides. The previously imaged GFP-labeled dendrites were located under light microscopy. Serial thin sections (65 nm) were cut and placed in formvar-coated, single slot grids. Sections were imaged at a magnification of 15,000⫻ using a Philips CM12 transmission electron microscope. Electron micrographs were aligned and analyzed in Photoshop (Adobe), Imaris (Bitplane), and Neurolucida (Microbrightfield) software. Quantification was based upon 13 spines on 15 m of dendrite from one GFPNrbI(1-287) cell and 31 spines from 74 m of dendrite from one GFPNrbI(1-1095) cell; both dendritic segments were at similar positions along the dendritic tree. Synaptic Electrophysiology and Glutamate Uncaging At 5–7 days after transfection, whole-cell recordings were obtained from transfected cells and untransfected neighbors at room temperature (unless noted) in ACSF (127 mM NaCl, 25 mM NaHCO3, 25 mM D-glucose, 2.5 mM KCl, 4 mM MgCl2, 4 mM CaCl2, and 1.25 mM NaH2PO4, aerated with 95% O2/5%CO2). Cuts were made on both sides of CA1 to reduce spontaneous activity. Neurons were 20–60 m deep in the slice. Access resistances were in the range of 10–25 M⍀. mEPSCs were recorded at 29⬚C at a holding potential of ⫺65 mV in ACSF containing 1 mM MgCl2 (instead of 4 mM), 1 M TTX, and 10 M bicuculline. Intracellular solution consisted of 120 mM CsMeSO3, 20 mM CsCl, 10 mM HEPES, 4 mM Mg2ATP, 0.3 mM Na2GTP, 14 mM phosphocreatine, 4 mM NaCl, 3 mM ascorbate, 0.6 mM EGTA, 50 M Alexa594; pH 7.3 with CsOH. mEPSCs were analyzed with custom MATLAB software using the template-matching method (Clements and Bekkers, 1997). For uncaging analysis of synaptic and direct responses, we recorded simultaneously from GFPNrbI(1-287) cells and untransfected neighbors. A few pairs (2/11) were recorded sequentially. Synaptic and direct stimulation was accomplished by focal photolysis of caged glutamate (Shepherd et al., 2003). In brief, Nitroindolinyl (NI)caged glutamate (Sigma-RBI) was added to recirculating ACSF to a concentrations of 0.37 mM. Once whole-cell recording was established, glutamate was focally uncaged by a 1 ms light stimulus from a UV laser. To measure synaptic responses, we used a 4⫻ objective, laser power ⵑ10 mW, and 256 stimulus sites on a 16 ⫻ 16 grid with 50 m spacing. Intracellular solution consisted of 130 mM KMeSO3, 10 mM HEPES, 4 mM MgCl2, 4 mM Na2ATP, 0.4 mM NaGTP, 10 mM
Neuron 332
Na-phosphocreatine, 3 mM ascorbate, 1 mM EGTA, 3 mM biocytin, 50 M Alexa594; pH 7.3 with KOH. Synaptic responses were measured as the mean amplitude at ⫺65 mV during a 75 ms window directly following the stimulus. To measure direct responses, we used a 60⫻ objective, laser power ⵑ2 mW, and 64 stimulus sites on an 8 ⫻ 8 grid with 20 m spacing. Intracellular solution was cesium based, as for mEPSCs, but with 1 mM EGTA and 3 M biocytin. Direct responses were recorded at room temperature in ACSF containing 1 M TTX and 10 M bicuculline. We collected two maps at ⫺65 mV, two maps at ⫹40 mV, and two maps at ⫹40 mV with 10 M NBQX. AMPA/ NMDA ratios were calculated as the mean response after baseline subtraction at ⫺65 mV (window: 0–15 ms poststimulus) divided by the mean response at ⫹40 mV (window: 70–85 ms poststimulus). Time-Lapse Imaging of Spine Dynamics At 2 days after transfection, slices were perfused at 34⬚C with carbogenated culture medium, and images were acquired every 15 min for 1–1.5 hr. For each transfected CA1 neuron, two segments of secondary basal dendrites and two segments of secondary apical dendrites were imaged. Following imaging, slices were fixed and stained with anti-NrbI antibody to confirm NrbI expression in cotransfected cells. Turnover ratios were calculated as (Ngained ⫹ Nlost)/(2Ntotal), where Ngained is the number of new spines, Nlost is the number of lost spines, and Ntotal is the total number of spines. Motility was calculated as the sum of the absolute values of all spine length changes per dendritic segment per 15 min period, divided by the total number of spines per that segment. Exploration Index was calculated as the sum of the absolute values of all spine length changes per dendritic segment per 15 min period, divided by the dendritic length of that segment. Acknowledgments We thank Barry Burbach, John Wallach, and Catherine Zhang for help with experiments; Tom Pologruto and Volker Scheuss for programming; Carey Oliver and Ryan Terry-Lorenzo for sharing data and reagents prior to publication; and Vincenzo De Paola, Ingrid Ehrlich, Anthony Holtmaat, and Alla Karpova for critical reading of the manuscript. This work was supported by the Helen Hay Whitney Foundation (K.Z. was a Merck Fellow), a Burroughs Wellcome Fund Career Award (K.Z.), the Swiss National Science Foundation (G.K.), HHMI (G.M.G.S. and K.S.), and NIH (K.S.). Received: July 7, 2004 Revised: August 31, 2004 Accepted: September 16, 2004 Published: October 13, 2004 References Ackermann, M., and Matus, A. (2003). Activity-induced targeting of profilin and stabilization of dendritic spine morphology. Nat. Neurosci. 6, 1194–1200. Allen, P.B., Ouimet, C.C., and Greengard, P. (1997). Spinophilin, a novel protein phosphatase 1 binding protein localized to dendritic spines. Proc. Natl. Acad. Sci. USA 94, 9956–9961. Allison, D.W., Gelfand, V.I., Spector, I., and Craig, A.M. (1998). Role of actin in anchoring postsynaptic receptors in cultured hippocampal neurons: differential attachment of NMDA versus AMPA receptors. J. Neurosci. 18, 2423–2436. Allison, D.W., Chervin, A.S., Gelfand, V.I., and Craig, A.M. (2000). Postsynaptic scaffolds of excitatory and inhibitory synapses in hippocampal neurons: maintenance of core components independent of actin filaments and microtubules. J. Neurosci. 20, 4545–4554. Bonhoeffer, T., and Yuste, R. (2002). Spine motility. Phenomenology, mechanisms, and function. Neuron 35, 1019–1027. Burnett, P.E., Blackshaw, S., Lai, M.M., Qureshi, I.A., Burnett, A.F., Sabatini, D.M., and Snyder, S.H. (1998). Neurabin is a synaptic protein linking p70 S6 kinase and the neuronal cytoskeleton. Proc. Natl. Acad. Sci. USA 95, 8351–8356. Burrone, J., O’Byrne, M., and Murthy, V.N. (2002). Multiple forms of
synaptic plasticity triggered by selective suppression of activity in individual neurons. Nature 420, 414–418. Clements, J.D., and Bekkers, J.M. (1997). Detection of spontaneous synaptic events with an optimally scaled template. Biophys. J. 73, 220–229. Dailey, M.E., and Smith, S.J. (1996). The dynamics of dendritic structure in developing hippocampal slices. J. Neurosci. 16, 2983–2994. Dunaevsky, A., Tashiro, A., Majewska, A., Mason, C., and Yuste, R. (1999). Developmental regulation of spine motility in the mammalian central nervous system. Proc. Natl. Acad. Sci. USA 96, 13438–13443. Durand, G.M., Kovalchuk, Y., and Konnerth, A. (1996). Long-term potentiation and functional synapse induction in developing hippocampus. Nature 381, 71–75. Engert, F., and Bonhoeffer, T. (1999). Dendritic spine changes associated with hippocampal long-term synaptic plasticity. Nature 399, 66–70. Ethell, I.M., Irie, F., Kalo, M.S., Couchman, J.R., Pasquale, E.B., and Yamaguchi, Y. (2001). EphB/syndecan-2 signaling in dendritic spine morphogenesis. Neuron 31, 1001–1013. Feng, J., Yan, Z., Ferreira, A., Tomizawa, K., Liauw, J.A., Zhuo, M., Allen, P.B., Ouimet, C.C., and Greengard, P. (2000). Spinophilin regulates the formation and function of dendritic spines. Proc. Natl. Acad. Sci. USA 97, 9287–9292. Fischer, M., Kaech, S., Knutti, D., and Matus, A. (1998). Rapid actinbased plasticity in dendritic spines. Neuron 20, 847–854. Fischer, M., Kaech, S., Wagner, U., Brinkhaus, H., and Matus, A. (2000). Glutamate receptors regulate actin-based plasticity in dendritic spines. Nat. Neurosci. 3, 887–894. Fukazawa, Y., Saitoh, Y., Ozawa, F., Ohta, Y., Mizuno, K., and Inokuchi, K. (2003). Hippocampal LTP is accompanied by enhanced F-actin content within the dendritic spine that is essential for late LTP maintenance in vivo. Neuron 38, 447–460. Govek, E.E., Newey, S.E., Akerman, C.J., Cross, J.R., Van der Veken, L., and Van Aelst, L. (2004). The X-linked mental retardation protein oligophrenin-1 is required for dendritic spine morphogenesis. Nat. Neurosci. 7, 364–372. Grossman, S.D., Hsieh-Wilson, L.C., Allen, P.B., Nairn, A.C., and Greengard, P. (2002). The actin-binding domain of spinophilin is necessary and sufficient for targeting to dendritic spines. Neuromolecular Med. 2, 61–69. Grutzendler, J., Kasthuri, N., and Gan, W.B. (2002). Long-term dendritic spine stability in the adult cortex. Nature 420, 812–816. Hall, A., and Nobes, C.D. (2000). Rho GTPases: molecular switches that control the organization and dynamics of the actin cytoskeleton. Philos. Trans. R. Soc. Lond. B Biol. Sci. 355, 965–970. Halpain, S., Hipolito, A., and Saffer, L. (1998). Regulation of F-actin stability in dendritic spines by glutamate receptors and calcineurin. J. Neurosci. 18, 9835–9844. Hayashi, K., and Shirao, T. (1999). Change in the shape of dendritic spines caused by overexpression of drebrin in cultured cortical neurons. J. Neurosci. 19, 3918–3925. Hering, H., and Sheng, M. (2003). Activity-dependent redistribution and essential role of cortactin in dendritic spine morphogenesis. J. Neurosci. 23, 11759–11769. Irie, F., and Yamaguchi, Y. (2002). EphB receptors regulate dendritic spine development via intersectin, Cdc42 and N-WASP. Nat. Neurosci. 5, 1117–1118. Isaac, J.T., Nicoll, R.A., and Malenka, R.C. (1995). Evidence for silent synapses: implications for the expression of LTP. Neuron 15, 427–434. Ishikawa, Y., Katoh, H., and Negishi, M. (2003). A role of Rnd1 GTPase in dendritic spine formation in hippocampal neurons. J. Neurosci. 23, 11065–11072. Jontes, J.D., and Smith, S.J. (2000). Filopodia, spines, and the generation of synaptic diversity. Neuron 27, 11–14. Jontes, J.D., Buchanan, J., and Smith, S.J. (2000). Growth cone and dendrite dynamics in zebrafish embryos: early events in synaptogenesis imaged in vivo. Nat. Neurosci. 3, 231–237.
NrbI Actin Binding in Spine and Synapse Growth 333
Korkotian, E., and Segal, M. (2001a). Regulation of dendritic spine motility in cultured hippocampal neurons. J. Neurosci. 21, 6115– 6124.
Pak, D.T., and Sheng, M. (2003). Targeted protein degradation and synapse remodeling by an inducible protein kinase. Science 302, 1368–1373.
Korkotian, E., and Segal, M. (2001b). Spike-associated fast contraction of dendritic spines in cultured hippocampal neurons. Neuron 30, 751–758.
Pak, D.T., Yang, S., Rudolph-Correia, S., Kim, E., and Sheng, M. (2001). Regulation of dendritic spine morphology by SPAR, a PSD95-associated RapGAP. Neuron 31, 289–303.
Kugler, S., Meyn, L., Holzmuller, H., Gerhardt, E., Isenmann, S., Schulz, J.B., and Bahr, M. (2001). Neuron-specific expression of therapeutic proteins: evaluation of different cellular promoters in recombinant adenoviral vectors. Mol. Cell. Neurosci. 17, 78–96.
Passafaro, M., Nakagawa, T., Sala, C., and Sheng, M. (2003). Induction of dendritic spines by an extracellular domain of AMPA receptor subunit GluR2. Nature 424, 677–681.
Lendvai, B., Stern, E., Chen, B., and Svoboda, K. (2000). Experiencedependent plasticity of dendritic spines in the developing rat barrel cortex in vivo. Nature 404, 876–881. Liao, D., Hessler, N.A., and Malinow, R. (1995). Activation of postsynaptically silent synapses during pairing-induced LTP in CA1 region of hippocampal slice. Nature 375, 400–404. Luo, L. (2002). Actin cytoskeleton regulation in neuronal morphogenesis and structural plasticity. Annu. Rev. Cell Dev. Biol. 18, 601–635. MacMillan, L.B., Bass, M.A., Cheng, N., Howard, E.F., Tamura, M., Strack, S., Wadzinski, B.E., and Colbran, R.J. (1999). Brain actinassociated protein phosphatase 1 holoenzymes containing spinophilin, neurabin, and selected catalytic subunit isoforms. J. Biol. Chem. 274, 35845–35854.
Penzes, P., Johnson, R.C., Sattler, R., Zhang, X., Huganir, R.L., Kambampati, V., Mains, R.E., and Eipper, B.A. (2001). The neuronal RhoGEF Kalirin-7 interacts with PDZ domain-containing proteins and regulates dendritic morphogenesis. Neuron 29, 229–242. Penzes, P., Beeser, A., Chernoff, J., Schiller, M.R., Eipper, B.A., Mains, R.E., and Huganir, R.L. (2003). Rapid induction of dendritic spine morphogenesis by trans-synaptic ephrinB-EphB receptor activation of the Rho-GEF kalirin. Neuron 37, 263–274. Pollard, T.D., Blanchoin, L., and Mullins, R.D. (2000). Molecular mechanisms controlling actin filament dynamics in nonmuscle cells. Annu. Rev. Biophys. Biomol. Struct. 29, 545–576. Pologruto, T.A., Sabatini, B.L., and Svoboda, K. (2003). ScanImage: Flexible software for operating laser-scanning microscopes. Biomed. Eng. Online 2, 13.
Majewska, A., and Sur, M. (2003). Motility of dendritic spines in visual cortex in vivo: Changes during the critical period and effects of visual deprivation. Proc. Natl. Acad. Sci. USA. 100, 16024–16029.
Portera-Cailliau, C., Pan, D.T., and Yuste, R. (2003). Activity-regulated dynamic behavior of early dendritic protrusions: evidence for different types of dendritic filopodia. J. Neurosci. 23, 7129–7142.
Maletic-Savatic, M., Malinow, R., and Svoboda, K. (1999). Rapid dendritic morphogenesis in CA1 hippocampal dendrites induced by synaptic activity. Science 283, 1923–1927.
Sala, C., Piech, V., Wilson, N.R., Passafaro, M., Liu, G., and Sheng, M. (2001). Regulation of dendritic spine morphology and synaptic function by Shank and Homer. Neuron 31, 115–130.
Matsuzaki, M., Honkura, N., Ellis-Davies, G.C., and Kasai, H. (2004). Structural basis of long-term potentiation in single dendritic spines. Nature 429, 761–766.
Sala, C., Futai, K., Yamamoto, K., Worley, P.F., Hayashi, Y., and Sheng, M. (2003). Inhibition of dendritic spine morphogenesis and synaptic transmission by activity-inducible protein Homer1a. J. Neurosci. 23, 6327–6337.
Matus, A. (2000). Actin-based plasticity in dendritic spines. Science 290, 754–758. Matus, A., Ackermann, M., Pehling, G., Byers, H.R., and Fujiwara, K. (1982). High actin concentrations in brain dendritic spines and postsynaptic densities. Proc. Natl. Acad. Sci. USA 79, 7590–7594. McAllister, A.K. (2000). Biolistic transfection of neurons. Science’s STKE, 10.1126/stke.2000.51.pl1.
Satoh, A., Nakanishi, H., Obaishi, H., Wada, M., Takahashi, K., Satoh, K., Hirao, K., Nishioka, H., Hata, Y., Mizoguchi, A., and Takai, Y. (1998). Neurabin-II/spinophilin. An actin filament-binding protein with one pdz domain localized at cadherin-based cell-cell adhesion sites. J. Biol. Chem. 273, 3470–3475.
McKinney, R.A., Capogna, M., Durr, R., Gahwiler, B.H., and Thompson, S.M. (1999). Miniature synaptic events maintain dendritic spines via AMPA receptor activation. Nat. Neurosci. 2, 44–49.
Shen, K., Teruel, M.N., Subramanian, K., and Meyer, T. (1998). CaMKIIbeta functions as an F-actin targeting module that localizes CaMKIIalpha/beta heterooligomers to dendritic spines. Neuron 21, 593–606.
Meng, Y., Zhang, Y., Tregoubov, V., Falls, D.L., and Jia, Z. (2003). Regulation of spine morphology and synaptic function by LIMK and the actin cytoskeleton. Rev. Neurosci. 14, 233–240.
Shepherd, G.M., Pologruto, T.A., and Svoboda, K. (2003). Circuit analysis of experience-dependent plasticity in the developing rat barrel cortex. Neuron 38, 277–289.
Mogilner, A., and Oster, G. (1996). Cell motility driven by actin polymerization. Biophys. J. 71, 3030–3045.
Shi, S., Hayashi, Y., Esteban, J.A., and Malinow, R. (2001). Subunitspecific rules governing AMPA receptor trafficking to synapses in hippocampal pyramidal neurons. Cell 105, 331–343.
Morales, M., Colicos, M.A., and Goda, Y. (2000). Actin-dependent regulation of neurotransmitter release at central synapses. Neuron 27, 539–550. Muly, E.C., Allen, P., Mazloom, M., Aranbayeva, Z., Greenfield, A.T., and Greengard, P. (2004). Subcellular distribution of neurabin immunolabeling in primate prefrontal cortex: comparison with spinophilin. Cereb. Cortex, in press. Published online June 24, 2004.
Star, E.N., Kwiatkowski, D.J., and Murthy, V.N. (2002). Rapid turnover of actin in dendritic spines and its regulation by activity. Nat. Neurosci. 5, 239–246. Stephens, D.J., and Banting, G. (1999). Direct interaction of the trans-Golgi network membrane protein, TGN38, with the F-actin binding protein, neurabin. J. Biol. Chem. 274, 30080–30086.
Murai, K.K., Nguyen, L.N., Irie, F., Yamaguchi, Y., and Pasquale, E.B. (2003). Control of hippocampal dendritic spine morphology through ephrin-A3/EphA4 signaling. Nat. Neurosci. 6, 153–160.
Stoppini, L., Buchs, P.A., and Muller, D.A. (1991). A simple method for organotypic cultures of nervous tissue. J. Neurosci. Methods 37, 173–182.
Nakanishi, H., Obaishi, H., Satoh, A., Wada, M., Mandai, K., Satoh, K., Nishioka, H., Matsuura, Y., Mizoguchi, A., and Takai, Y. (1997). Neurabin: a novel neural tissue-specific actin filament-binding protein involved in neurite formation. J. Cell Biol. 139, 951–961.
Tashiro, A., Minden, A., and Yuste, R. (2000). Regulation of dendritic spine morphology by the rho family of small GTPases: antagonistic roles of Rac and Rho. Cereb. Cortex 10, 927–938.
Nakayama, A.Y., Harms, M.B., and Luo, L. (2000). Small GTPases Rac and Rho in the maintenance of dendritic spines and branches in hippocampal pyramidal neurons. J. Neurosci. 20, 5329–5338. Oliver, C.J., Terry-Lorenzo, R.T., Elliott, E., Bloomer, W.A., Li, S., Brautigan, D.L., Colbran, R.J., and Shenolikar, S. (2002). Targeting protein phosphatase 1 (PP1) to the actin cytoskeleton: the neurabin I/PP1 complex regulates cell morphology. Mol. Cell. Biol. 22, 4690– 4701.
Trachtenberg, J.T., Chen, B.E., Knott, G.W., Feng, G., Sanes, J.R., Welker, E., and Svoboda, K. (2002). Long-term in vivo imaging of experience-dependent synaptic plasticity in adult cortex. Nature 420, 788–794. Turrigiano, G.G., and Nelson, S.B. (2004). Homeostatic plasticity in the developing nervous system. Nat. Rev. Neurosci. 5, 97–107. Turrigiano, G.G., Leslie, K.R., Desai, N.S., Rutherford, L.C., and Nelson, S.B. (1998). Activity-dependent scaling of quantal amplitude in neocortical neurons. Nature 391, 892–895.
Neuron 334
Watt, A.J., van Rossum, M.C.W., MacLeod, K.M., Nelson, S.B., and Turrigiano, G.G. (2000). Activity coregulates quantal AMPA and NMDA currents at neocortical synapses. Neuron 26, 659–670. Wong, W.T., and Wong, R.O. (2001). Changing specificity of neurotransmitter regulation of rapid dendritic remodeling during synaptogenesis. Nat. Neurosci. 4, 351–352. Wyszynski, M., Kharazia, V., Shanghvi, R., Rao, A., Beggs, A.H., Craig, A.M., Weinberg, R., and Sheng, M. (1998). Differential regional expression and ultrastructural localization of alpha-actinin-2, a putative NMDA receptor-anchoring protein, in rat brain. J. Neurosci. 18, 1383–1392. Zhang, W., and Benson, D.L. (2001). Stages of synapse development defined by dependence on F-actin. J. Neurosci. 21, 5169–5181. Zhou, Q., Petersen, C.C., and Nicoll, R.A. (2000). Effects of reduced vesicular filling on synaptic transmission in rat hippocampal neurones. J. Physiol. 525, 195–206. Ziv, N.E., and Smith, S.J. (1996). Evidence for a role of dendritic filopodia in synaptogenesis and spine formation. Neuron 17, 91–102.