Inductive Scale Development from Twitter Data
Inductive Scale Development from Twitter Data: Applying Contemporary Natural Language Processing Methods in IS Research Research-in-Progress Paper David Agogo Operations and Information Management Department, University of Massachusetts, Amherst
[email protected]
Traci J. Hess Operations and Information Management Department, University of Massachusetts, Amherst
[email protected]
Abstract The availability of big data sources and developments in computational linguistics present an opportunity for IS researchers to pursue new areas of inquiry and to tackle existing challenges. In this paper, a novel way of developing an inductive measurement scale using big data (i.e., tweets) and associated methods (i.e., natural language processing) is proposed and tested. The development of a new scale, the technology hassles and delights scale (THDS), is used to demonstrate how a syntax aware filtering process can identify relevant information from a large corpus of tweets to improve the content validity of the scale. In comparing themes generated from analyzing 146 million tweets with themes generated from semi-structured interviews, a reasonable overlap is observed. Further, the potential for identifying even more relevant themes from within subsets of the tweet dataset is uncovered. Keywords: Inductive scale development, content validity, tweets, technology hassles and delights, affective evaluation, natural language processing, computational social science
Background
In the past two decades, significant advances in computer science and related disciplines have unleashed the power of algorithms and advanced hardware on the classical problem of interpreting spoken and written text. Methods for machine translation, speech recognition and speech synthesis have been widely applied in consumer products such as spoken dialogue systems (SDS) (e.g., Apple’s Siri, Amtrak’s Julie, and Microsoft’s Cortana), and a host of other technologies, including the mining of social media data for various purposes (Hirschberg and Manning 2015). There is also a vast amount of digital data now available for the purpose of understanding human behavior, an emerging area called computational social science (Lazer et al. 2009). This paper aims to demonstrate a potentially useful application in this emerging area for information systems (IS) research, with applicability for social science research in general. Like many other academic disciplines, the IS field has a growing interest in the use of big data (Agarwal and Dhar 2014). The IS field also has devoted a lot of attention to best practices in the development and validation of measurement scales for use in empirical research (e.g., Boudreau et al. 2001; MacKenzie et al. 2011a; Straub et al. 2004). The purpose of this paper is to demonstrate how big data can be used to develop better measurement scales using an IS scale as an example. One form of validity which has lagged the others in attention is content validity. Content validity refers to “the degree to which items in an instrument reflect the content universe to which the instrument will be generalized” (Straub et al. 2004, p. 424). Content validity is a property of a set of items or measures taken together (Anderson and Gerbing 1991), and is difficult to establish, especially when an inductive approach is used to generate items and create scales
Business Analytics Congress, Fort Worth 2015
1
Inductive Scale Development from Twitter Data
(Hinkin 1995, 1998; Rossiter 2002). An inductive approach refers to situations where a theoretical foundation is lacking, and scales are developed inductively by having a sample of participants describe their feelings and behaviors related to systems or organizations (Hinkin, 1995). “An example might be, ‘describe how your organization supports your use of a system’ or ‘describe how you feel when you use the system.’ Responses are then classified into a number of categories by content analysis based on key words or themes.” (Hinkin 1995, pp. 969–970). In this paper, natural language processing (NLP) methods are applied on data collected from the Microblogging website, Twitter, with the objective of identifying frequently occurring themes in affective evaluations of technology, in order to support the development of a content valid measurement scale. Both positive and negative evaluations are considered, thus we refer to this scale as the technology hassles and delights scale (THDS). Further, semi-structured interviews on affective evaluations of technology are also carried out to evaluate the relative performance of both approaches at identifying the most prevalent elements in this domain. By employing both Twitter data and interview data, separately and collectively, towards the development of a measurement scale, we hope to demonstrate the capacity for contemporary big data and big data methods to contribute to scale development practices in IS research. After all, as acknowledged by Agarwal and Dhar (2014, p. 445), the big data opportunity in IS research enables us to “address the same types of questions as we have in the past but with significantly richer data sets”. Beyond the methodological contributions of this paper, the IS scale being developed (THDS), is also important. This scale captures both positive and negative events experienced when interacting with computers and phones, and has the potential to improve our understanding of the process-based factors (Zhang 2013) that lead to affective evaluations of technology (e.g. computer anxiety, technostress, flow and enjoyment). THDS may also shed light on the user experiences that lead to switching from one platform to the other (e.g. from Windows to Mac or from Android to Apple iOS). In the remainder of the paper, a background on scale development and the social media data source are presented, after which the NLP methods used in this paper are introduced. The analysis and results are then reported, followed by a discussion of the next steps in this ongoing research project.
Background on Scale development
The development of valid measurement scales is a prerequisite for carrying out quality empirical social science research. The earliest stages in the scale creation process include conceptual definition of the concept to be measured and item generation (Churchill Jr 1979; Hinkin 1998; MacKenzie et al. 2011b). While established methods exist for later stages of scale development (e.g. reliability analysis, factor analysis, etc.), there is more ambiguity regarding the earliest stages of the process as postulated by domain sampling theory. This theory states that it is not possible to measure the complete domain of interest, thus it is important that the sample of items adequately represents the construct under examination (Ghiselli et al. 1981; Hinkin 1998). Thus, the quality of any scale is highly dependent on the degree to which items generated sample the domain being studied. This concept is referred to as content validity (Nunnally 1978; Straub et al. 2004). Two broad approaches to scale development exist: deductive and inductive, with the former more suitable for areas with well-established theory and the latter an iterative approach best suited for exploratory research. There are marked differences in establishing content validity with these two approaches. In deductive scale development, being informed by theory, items generated can be shown to achieve coverage of the concept domain. However, item generation in inductive scale development is often based on semi-structured interviews with a purposive sample (Hinkin 1995; Rossiter 2002), and may be limited by validity threats. For instance, the quality of the questions created by the researcher can greatly influence the items generated (Clark and Watson 1995). Similarly, memory and response bias of participants may introduce unknown bias to the items generated in the first phase of scale creation. These factors may introduce restrictions to the scales created and ultimately bias research programs that adopt the scales. Thus, generating an inclusive and extensive pool of items is critical to developing valid scales. As articulated by Loevinger, “The items of the pool should be chosen so as to sample all possible contents which might comprise the putative trait according to all known alternative theories of the trait” (1957, p. 659). Given the popularity of social media and the willingness of individuals to share personal information and express their experience of daily situations using these media, it is worth exploring how data from these sources can be utilized in the inductive scale development process.
Business Analytics Congress, Fort Worth 2015
2
Inductive Scale Development from Twitter Data
Extracting Meaning from Social Media Data
This paper employs data obtained from a leading social networking and micro-blogging service, Twitter. Founded in 2006, Twitter is a service that allows users to post and read short messages (maximum of 140 characters). These “tweets”, as they are called, are typically public and visible to anyone online. The success of Twitter can been attributed in part to its wide global reach and support for establishing weak ties, with the “promise of transcending distance, connecting everyone with anyone” (Takhteyev et al. 2012, p. 81). Beyond that, however, Twitter creates ambient awareness between people in social networks, enables a unique push-push-pull communication and provides a platform for virtual exhibitionism and voyeurism for active contributors and passive observers (Kaplan and Haenlein 2011). The support for ambient awareness and virtual exhibitionism/voyeurism make Twitter a unique source of data for researchers seeking an unfettered glimpse into the daily lives of people around the world. Ambient awareness is a form of awareness facilitated by the exchange of fragments of information online which can result in high levels of social presence and media richness between individuals on social media (Kaplan and Haenlein 2011). The public nature of tweets enables users to engage in self-disclosure and selfpresentation by sharing their experiences with the world (i.e., while users can restrict access to their tweets to those who follow them, this is not a common practice) (Kaplan and Haenlein 2011). These motivations have led to extensive use of Twitter to disclose information on personal experiences, attitudes, etc. One important aspect of Twitter is the length restriction imposed by the creators of the service. By restricting the length of a tweet, information shared by users is more likely to be focused on a single idea or topic, which enables easy interpretation by researchers. However, this also leads Twitter users to (1) compress sentences by omitting words and using unusual spellings to fit within character limits, and (2) send out multi-part tweets i.e. multiple tweets on a single subject. In addition, limited context information is made available, since tweets are generally meant to be read at that instant, and the sender assumes that the audience is already part of the conversation. In addition to these idiosyncrasies with Twitter data, there are other issues such as an abundance of spam, automated posts and the relative anonymity of users. Nevertheless, tweets have been reliably used in aggregate to analyze and even predict events/trends such as weather (Lampos and Cristianini 2012), box-office revenues (Asur et al. 2010), consumer confidence and political polls (O’Connor et al. 2010), politics and election outcomes (Beauchamp 2013; Gayo-Avello 2013), public health concerns such as a flu pandemic (Lampos and Cristianini 2010), unemployment (Llorente et al. 2014), as well as a myriad of applications in online marketing. On the individual level, tweets have been used to identify gender, age, regional origin (Rao et al. 2010), political affiliation (Pennacchiotti and Popescu 2011), and post-partum changes in affect (De Choudhury et al. 2013).
Natural Language Processing (NLP) Methods
NLP, also known as computational linguistics, involves the use of computational and statistical methods to learn, understand, and produce human language content. The fundamental building block of linguistic analysis is identifying patterns that occur in language use (Manning and Schütze 1999). Current NLP methods focus on more complex representations of linguistic patterns which are designed to transcend the count-based ‘body of words’ approaches common in early NLP (Hirschberg and Manning 2015). Currently, statistical and machine learning (ML) methods are being used to achieve deeper levels of linguistic analysis (Smith 2011). The NLP methods applied in this paper include tokenization, part-of-speech tagging, and ngram sequences (as described in Table 1). Part of speech tags are assigned based on word definitions and rules devised to interpret the context in which a word appears (e.g. the relationship of a word with adjacent words) (Brill 2000). Several parts-of-speech taggers have been developed for use on different types of text with accuracies maxing out at about 97% (Manning 2011). However, these taggers perform poorly with the informal text obtained on Twitter, which has led to taggers developed specifically for conversational online text. TweetNLP is such a tagger and it achieves up to 93% accuracy when applied to tweets (Owoputi et al. 2013). An example of an actual tweet with tags is shown in Table 2, along with definitions of tags produced by TweetNLP (See Owoputi et al., 2013 for a full list).
The NLP Approach: Syntax-Aware Phrase Extraction By first assigning parts of speech to a tweet, it is possible to extract n-gram pairs containing relevant phrases which capture the core information in each tweet. Based on this, sequences of words that co-occur most often out of a large corpus of tweets can be expected to be indicative of the main themes within that corpus.
Business Analytics Congress, Fort Worth 2015
3
Inductive Scale Development from Twitter Data
Further, by combining syntax rules constituted from part-of-speech information, more nuanced information about the use of language can be obtained. For instance, the verbs or adjectives co-occurring most frequently with a particular noun can be identified and used to infer the way an object is most frequently described. Such methods have been widely used for more advanced purposes such as language translation. Lastly, interpretation is applied to select semantically accurate (i.e. meaningful) phrases out of the anticipated large group of syntactically accurate information collected. Given this introduction to the methods to be used, the scale to be created is now introduced and preliminary results and analysis are presented. NLP Method Part-of-Speech Tagging Tokenization N-gram Sequences
Definition Part-of-speech tagging (POST), is the process of marking up words in text as corresponding to a part of speech based on a set of rules Given a character sequence, tokenization is the process of splitting into pieces called tokens, usually discarding content such as punctuation N-gram refers to a sequence of n items or tokens based on syllables, letters, words, or more complex structures
Relevance to this Study Grammatical syntax added to tweets provides filtering beyond ‘bag of word’ approaches Each tagged tweet is broken into individual (word, POS) pairs Word tokens are combined into n-grams for syntax-aware filtering to occur
Table 1. Definition of NLP Methods Used in this Project Unit of Analysis Tweet POS Tagged Tweet Tweet Tokens {Word, POS} Pair Tokens Tweet Bigrams Tweet Trigrams {Word, POS} Pair Trigrams Tweet 5-grams
Contents {My phone crashed the second it turned midnight} {My phone crashed the second it turned midnight D N V D A O V N} {My}, {phone}, {crashed}, {the}, {second}, {it}, {turned}, {midnight} {My, D}, {phone, N}, {crashed, V}, {the, D}, {second, A},{it, O},{turned, V}, {midnight, N} {My phone}, {phone crashed},{crashed the},{the second},{second it},{it turned},{turned midnight} {My phone crashed},{phone crashed the},{crashed the second},{the second it},{second it turned},{it turned midnight} {{My, D}, {phone, N}, {crashed, V}}, {{phone, N}, {crashed, V}, {the, D}}, {{crashed, V}, {the, D}, {second, A}}, {{the, D}, {second, A},{it, O}}, {{second, A},{it, O},{turned, V}}, {{it, O},{turned, V}, {midnight, N}} {My phone crashed the second}, {phone crashed the second it}, {crashed the second it turned}, {the second it turned midnight}
N: Common noun, O: Pronoun, V: Verb, A: Adjective, R: Adverb, D: Determiner P: Pre- or post-position
Table 2. Illustration of NLP Methods Used
The Need for a Technology Delights and Hassles Scale
The study of affective evaluations towards technology and technology use is an emerging area in the information systems (IS) discipline. It is a critical element of user behavior that is an important part of technology adoption research (Beaudry and Pinsonneault 2010). Social scientists have long held that emotions play a critical role in shaping human decisions as well as subsequent behavior. Despite this, the study of cognitions has dominated IS and only recently have efforts been undertaken to identify pertinent categories of affective concepts (e.g., Loiacono and Djamasbi 2010; Zhang 2013). Recent conceptual work such as the Affective Response Model (ARM) (Zhang 2013) provides the foundation for classifying existing affective evaluations towards technology objects and use and shedding light on how they come about. For instance, experiences during use are a source of enduring positive or negative evaluations of particular technologies or technology in general (Propositions 6 and 7 in Zhang 2013). ARM identifies these factors as processbased factors (Category 5.1 and 6.1 in Zhang 2013). When creating measurement scales in the affective domain, there needs to be clarity about the target, intensity and direction of the characteristic (McCoach et al. 2013). Target refers to the object, behavior, or
Business Analytics Congress, Fort Worth 2015
4
Inductive Scale Development from Twitter Data
idea the feeling is directed at, intensity refers to the degree or strength of the feeling and direction reflects whether the feeling is positive, neutral or negative. In this case, the target is the user experience with hands on use of specific technology objects (mobile phones, tablets and computers), the intensity refers to feelings strong enough to be expressed, and the direction includes both positive and negative expressions. When this scale is created, it will be used to test hypotheses related to at least two important IS research areas (1) usage continuance/switching intentions (Bhattacherjee 2001; Bhattacherjee et al. 2012) and (2) deep structure usage (Burton-Jones and Straub 2006), answering the call to open the black box of constructs (perceived ease of use and usefulness) which drive usage (Benbasat and Barki 2007). This paper takes the perspective that improving our understanding of process-based factors is a new approach that can help shed more light on these principal constructs and may eventually lend itself to theory creation (Goodhue 2007). The purpose of this scale development exercise is to develop a scale of process-based evaluations or appraisals of technology objects and technology usage behavior under the banner of a technology hassles and delights scale (THDS). This work follows in the tradition of early work on a computer hassles scale (Hudiburg 1989, 1992), a measure from the field of psychology that failed to gain traction within IS. By effectively linking THDS to an emerging theoretical space, we hope to change this. Further, leaning on best practices for creating affective scales in the affective domain (McCoach et al. 2013), tweets and semi-structured interviews, will be used. The objective of the analysis is to identify major themes from a corpus of tweets in which people are speaking about three categories of technology: computers, mobile phones and tablets. In parallel, semi-structured interviews will also be used to generate items, and the resultant themes identified will be compared and condensed into a single THDS.
Analysis & Preliminary Results
Collection of Tweets
Pre-Filtering
POS Tagging
Syntax-Aware n-Gram Selection
Tri-grams
n-Gram of Full Tweet (Word,POS)
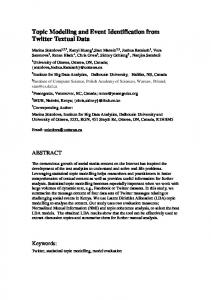
The previously discussed methods are now employed towards identifying the main themes in a corpus of tweets using the steps illustrated in Figure 1 below. Each step is explained in the sections that follow.
Tr-gram Lists Identifying Themes
Figure 1. Steps in NLP Analysis
Collection of Tweets
The dataset used for this study consists of 146,315,059 tweets (Nf) from Jan 1, 2014-March 31, 2015 (455 days). The keywords used to select tweets included: computer, pc, laptop, desktop, phone, iphone, cellphone, smartphone, tablet, ipad. This dataset represents an average of 321,571 tweets per day (range of 226,266-704,067). The maximum number of tweets was on Sept 9, 2014 the day of the iPhone 6 launch. Initial models and data cleansing approaches were developed on a smaller subset (N1=2 million) due to the large processing requirements of repeated analysis using the full dataset and are reported alongside the final analysis with the full dataset.
Pre-Filtering and POS Tagging
The first level of filtering involved excluding tweets that were retweets (i.e., duplicates of someone else’s tweet), not written in English, or were automatic posts (e.g., by game apps). Tweets were filtered using the rich metadata that is part of each tweet (e.g. time of tweet, the application the tweet was sent from, the language encoding of the tweet, etc.). Unfortunately, these tags are not always accurate and may result in a substantial number of false negatives i.e. discarded tweets. The overall size of the dataset makes this a less severe issue. This initial filtering yielded 38,076,612 usable tweets (26% of Nf). TweetNLP (Owoputi et al.
Business Analytics Congress, Fort Worth 2015
5
Inductive Scale Development from Twitter Data
2013) was used to tag the tweets for subsequent analysis. The thirty-eight million usable tweets (26% of Nf) from the pre-filtering stage were tagged. To verify that TweetNLP appropriately tagged keywords of interest, tagger accuracy was verified on a random subset of 2 million tweets. The nine keywords appeared a total of 1,573,477 times, each being tagged as either a proper or common noun in at least 70% of appearances. Details are contained in Table 3 below. Category Keyword Proper Noun Common Noun Determiner Other POS Count Computer
Phone Tablet
“computer” “desktop" “laptop” “pc" “phone” “smartphone" “iphone” “tablet" “ipad”
2% 26% 2% 45% 1% 47% 69% 17% 66%
74% 51% 76% 26% 81% 25% 7% 61% 8%
11% 6% 10% 7% 9% 7% 6% 5% 10%
14% 16% 12% 22% 9% 21% 18% 16% 16%
108,963 16,879 78,310 52,441 974,123 24,189 202,797 31,408 83,332
Table 3. Verification of Tagger Accuracy
Syntax-Aware n-Gram Selection
Following this, 5-grams which met the syntactic requirements were selected from the corpus of tweets. One grammatical syntax structure, the verb phrase, was used to identify themes. The verb phrase has an action word, a verb, at its core (e.g., walking, crash, froze), and also includes a complement or modifiers (e.g., walking slowly back home, crash my computer, my phone froze). At its simplest, a verb phrase can capture the principal action in a sentence (e.g., “My phone crashed” is the verb phrase in the tweet {My phone crashed the second it turned midnight}). A more complete discussion of the different forms of verb phrases is beyond the scope of this paper. Since a single tweet may contain multiple verb phrases, adjacency of the verb phrase to one of the keywords was also a selection criteria. The sequence for selecting 5grams from a sample tweet is shown in Table 3, and all selected 5-grams, all verb-phrases, and the full source tweets were saved separately. From the initial set of 2 million tweets, about half of the tweets (908,367) were found to meet this criteria and were further analyzed. Some additional filtering was done at this stage to exclude spam tweets not previously detected. After refining this algorithm on the smaller dataset, the analysis was run on the full data set, leading to 13,089,522 tweets (34% filtering rate).
Generating Themes from Tri-gram Lists
Broadly, the verb phrases identified through this filtering process were selected as primary themes for preliminary evaluation as either hassles or delights. Different lists of verb phrases were identified for each technology category, i.e., computers, phones, and tablets. Running the full sequence of steps in Table 4 on the full dataset of tweets (Nf) yielded 140,942 (phone), 58,649 (computer), and 20,977 (tablet) unique trigrams that appeared more than once in the dataset. The top two hundred of these tri-grams for each category were analyzed for themes. Where necessary, a random subset of tweets was retrieved to enable better interpretation. Due to space constraints, only themes from phone-related tri-grams are reported. Tri-grams fell under meaningful themes such as operating the device, user clumsiness with the device, etc. as well as clear affective expressions (hate my phone…, love my phone…). In both the computer and tablet categories, meaningful themes were also identified. A cursory scan of the tweets under themes such as user rage and affective expression reveal that more detailed information about the reasons for these affective evaluations can be obtained and is planned as future research. The validation conducted using semistructured interviews is presented in the following section. Step One Step Two
Select Full Tweet Split into 5-grams and select if keyword is present (i.e., phone)
Step Three
Select 5-gram(s) containing verb phrase Select verb phrase
Step Four
{My phone crashed the second it turned midnight} {My phone crashed the second}, DNVDA {phone crashed the second it}, NVDAO {crashed the second it turned}, VDAOV {the second it turned midnight}, DAOVN {My phone crashed the second}, DNVDA {phone crashed the second it}, NVDAO {My phone crashed}, DNV
Table 4: Example Tweet Showing Steps and Extracted Verb
Business Analytics Congress, Fort Worth 2015
6
Inductive Scale Development from Twitter Data
Cross-validation of Themes from Twitter data
In order to cross-validate the themes derived from the NLP analysis, qualitative data from semi-structured interviews was collected independently. Participants were sought from the crowdsourcing platform, Amazon Mechanical Turk, an increasingly common source of data for social science research (Buhrmester et al. 2011; Steelman et al. 2014). A total of 45 participants completed the survey, responding to open ended questions asking them to list the most frequently occurring delights and hassles they had experienced using technology (21 for computers only, the rest for mobile phones and tablets). The sample was 56% female, 62% had a four-year college degree or greater, and had an age range of 19-66 (mean = 36, S.D. = 14). An example question provided is “During daily interaction with mobile technology (smartphones and tablets ONLY), some things happen that annoy and irritate you. Using short sentences, list some examples below.” The responses were coded to identify dominant themes. The themes identified for phone and tablet use are shown in the word cloud in Figure 2 below, with the size of the theme representing the frequency of occurrence and the color indicating the direction of the theme.
Red: Hassle, Green: Delight, Yellow: Both Hassle & Delight; Size represents frequency
Figure 2: Word Cloud Showing Themes from Semi-structured Interviews for THDS Scale Finally, the themes from both the semi-structured interview and the Twitter NLP analysis were compared. Of the top ten themes identified from the semi-structured interviews, half mapped directly to the themes arrived at from Twitter. Of the 29 unique themes identified from the interviews, 13 mapped more or less to 12 of the 19 themes identified from the Twitter data. In addition, this overlap was observed without drilling deeper into the directly relevant themes of affective expressions, user rage and expressed desire towards phones. Thus, there is potential for discovering even more themes by repeating NLP analysis on the subset of 142,868 tweets which fall into these categories, as represented pictorially in Figure 3 below.
Discussion & Next Steps
The foregoing sections introduce a range of NLP techniques and discuss their application to a corpus of tweets for the purpose of extracting themes associated with technology use that can form a process-based experience scale – the THDS. By applying a syntax-aware filtering approach, lists of tri-grams that capture expressions related to specific technologies have been identified. The top 200 tri-grams related to mobile phones were analyzed and condensed into 19 themes. Following that, semi-structured interviews on the same topic were conducted independently and that data was also analyzed to arrive at a set of themes. Finally, themes from both sources were compared and a reasonable amount of overlap was discovered. Further, the potential for even more themes to be identified using further NLP analysis was noted. These findings are reported for a single category of technology, mobile phones.
Conclusion & Future Directions
This project started from a desire to put big data to the test in the context of scale creation, as well as a desire to create a much needed measure of process-based factors associated with technology use. Based on the progress reported thus far, the analysis of Twitter data using basic NLP techniques does yield themes which potentially represent delights and hassles using technology. These themes reasonably overlap with themes derived from semi-structured interviews, the traditional method of generating items for inductive
Business Analytics Congress, Fort Worth 2015
7
Inductive Scale Development from Twitter Data
scale development. Deeper exploration of relevant tweets is needed, after which a more formal comparison of the themes identified in the twitter data and semi-structured interviews will be conducted. Upon completing this work, the extent to which twitter data and semi-structured interviews can be used in combination should be more evident. NLP methods may in fact become a meaningful, inductive tool for scouring large datasets in content areas that are devoid of theory.
% represents proportion of 1,711,038 tweets (in top 200 tri-grams) and proportion of 110 interview statements
Figure 3: Comparison of Themes for Phone Hassles & Delights. Another critical aspect of this ongoing project is the rationale for why Twitter data may provide broader coverage than semi-structured interviews, even after considering the size of the datasets. One possible explanation is the influence of priming implicit in semi-structured interviews. Survey instruments that request recollected information from participants are inherently priming the participant, which may overestimate affective evaluations related to the prime (Russell 2003) and even bias the information retrieval process from memory (Ratcliff and McKoon 1988). On the other hand, extracted tweets which occur unprompted are likely to represent feelings with high levels of activation at the time the tweet was created, and are therefore less likely to be subject to priming or memory biases. Given Twitter users’ desire to create and sustain ambient awareness and virtually exhibit themselves, we expected our Twitter data set to result in a broad set of events with high levels of activation. The large number of tweets which contain explicit affective expressions are evidence of this. People are frequently tweeting about loving their phones, wishing to smash their phones, needing or missing their phones, etc. Finally, an exploration of how these methods may be applied beyond the THDS is necessary. Guidelines for affective scale development (McCoach et al. 2013) or the C-OAR-SE scale development method in
Business Analytics Congress, Fort Worth 2015
8
Inductive Scale Development from Twitter Data
marketing (Rossiter 2002) might be informative in determining the boundaries within which this approach might be suitable. Affective scales need to have a clear target, intensity and direction (Anderson and Bourke 2000; McCoach et al. 2013). The C-OAR-SE method requires the specification of the object, attribute and rater-entity associated with a scale. In the example above, the object was clearly defined (i.e., technology objects in three categories), the attributes were filtered (i.e. hassles or delights) and the rater-entity was individual users (who use Twitter). Future work on this subject will therefore explore how to expand this NLP-based approach to other areas of interest to IS researchers and other fields. This can potentially contribute significantly to broader utilization of big data sources into traditional research practices.
Bibliography
Agarwal, R., and Dhar, V. 2014. “Editorial—big data, data science, and analytics: The opportunity and challenge for is research,” Information Systems Research (25:3), pp. 443–448. Anderson, J. C., and Gerbing, D. W. 1991. “Predicting the performance of measures in a confirmatory factor analysis with a pretest assessment of their substantive validities,” Journal of Applied Psychology (76:5), pp. 732–740 (doi: 10.1037/0021-9010.76.5.732). Anderson, L. W., and Bourke, S. F. 2000. Assessing affective characteristics in the schools, Routledge. Asur, S., Huberman, B., and others. 2010. “Predicting the future with social media,” in Web Intelligence and Intelligent Agent Technology (WI-IAT), 2010 IEEE/WIC/ACM International Conference on (Vol. 1), IEEE, pp. 492–499. Beauchamp, N. 2013. “Predicting and interpolating state-level polling using Twitter textual data,” in New Directions in Analyzing Text as Data Workshop (available at http://www.kenbenoit.net/pdfs/NDATAD2013/Beauchamp_twitterpolls_2.pdf). Beaudry, A., and Pinsonneault, A. 2010. “The Other Side of Acceptance: Studying the Direct and Indirect Effects of Emotions on Information Technology Use,” MIS Quarterly (34:4), pp. 689–A3. Benbasat, I., and Barki, H. 2007. “Quo vadis, TAM?,” Journal of the Association for Information Systems (8:4), pp. 211–218. Bhattacherjee, A. 2001. “Understanding Information Systems Continuance: An Expectation-Confirmation Model,” MIS Quarterly (25:3), pp. 351–370 (doi: 10.2307/3250921). Bhattacherjee, A., Limayem, M., and Cheung, C. M. K. 2012. “User switching of information technology: A theoretical synthesis and empirical test,” Information & Management (49:7), pp. 327–333. Boudreau, M.-C., Gefen, D., and Straub, D. W. 2001. “Validation in Information Systems Research: A State-of-the-Art Assessment,” MIS Quarterly (25:1), pp. 1–16. Brill, E. 2000. “Part-of-speech tagging,” Handbook of Natural Language Processing, pp. 403–414. Buhrmester, M., Kwang, T., and Gosling, S. D. 2011. “Amazon’s Mechanical Turk A New Source of Inexpensive, Yet High-Quality, Data?,” Perspectives on Psychological Science (6:1), pp. 3–5. Burton-Jones, A., and Straub, D. W. 2006. “Reconceptualizing System Usage: An Approach and Empirical Test,” Information Systems Research (17:3), pp. 228–246 (doi: 10.1287/isre.1060.0096). Churchill Jr, G. A. 1979. “A paradigm for developing better measures of marketing constructs,” Journal of marketing research, pp. 64–73. Clark, L. A., and Watson, D. 1995. “Constructing validity: Basic issues in objective scale development.,” Psychological assessment (7:3), p. 309. De Choudhury, M., Counts, S., and Horvitz, E. 2013. “Predicting postpartum changes in emotion and behavior via social media,” in Proceedings of the SIGCHI Conference on Human Factors in Computing Systems, ACM, pp. 3267–3276 (available at http://dl.acm.org/citation.cfm?id=2466447). Gayo-Avello, D. 2013. “A meta-analysis of state-of-the-art electoral prediction from Twitter data,” Social Science Computer Review, p. 0894439313493979. Ghiselli, E. E., Campbell, J. P., and Zedeck, S. 1981. Measurement Theory for the Behavioral Sciences: Origin & Evolution, WH Freeman & Company. Goodhue, D. L. 2007. “Comment on Benbasat and Barki’s ‘Quo Vadis TAM’ article.,” Journal of the Association for Information Systems (8:4) (available at http://aisel.aisnet.org/jais/vol8/iss4/15). Hinkin, T. R. 1995. “A review of scale development practices in the study of organizations,” Journal of management (21:5), pp. 967–988. Hinkin, T. R. 1998. “A brief tutorial on the development of measures for use in survey questionnaires,” Organizational research methods (1:1), pp. 104–121. Hirschberg, J., and Manning, C. D. 2015. “Advances in natural language processing,” Science (349:6245),
Business Analytics Congress, Fort Worth 2015
9
Inductive Scale Development from Twitter Data
pp. 261–266. Hudiburg, R. A. 1989. “PSYCHOLOGY OF COMPUTER USE: XVII THE COMPUTER TECHNOLOGY HASSLES SCALE: REVISION, RELIABILITY, AND SOME CORRELATES,” Psychological Reports (65:3f), pp. 1387–1394. Hudiburg, R. A. 1992. “Factor analysis of the computer technology hassles scale,” Psychological Reports (71:3), pp. 739–744 (doi: 10.2466/pr0.1992.71.3.739). Kaplan, A. M., and Haenlein, M. 2011. “The early bird catches the news: Nine things you should know about micro-blogging,” Business Horizons (54:2), pp. 105–113. Lampos, V., and Cristianini, N. 2010. “Tracking the flu pandemic by monitoring the social web,” in Cognitive Information Processing (CIP), 2010 2nd International Workshop on, IEEE, pp. 411–416. Lampos, V., and Cristianini, N. 2012. “Nowcasting events from the social web with statistical learning,” ACM Transactions on Intelligent Systems and Technology (TIST) (3:4), p. 72. Lazer, D., Pentland, A., Adamic, L., Aral, S., Barabási, A.-L., Brewer, D., Christakis, N., Contractor, N., Fowler, J., Gutmann, M., Jebara, T., King, G., Macy, M., Roy, D., and Alstyne, M. V. 2009. “Computational Social Science,” Science (323:5915), pp. 721–723 (doi: 10.1126/science.1167742). Llorente, A., Cebrian, M., Moro, E., and others. 2014. “Social media fingerprints of unemployment,” arXiv preprint arXiv:1411.3140 (available at http://arxiv.org/abs/1411.3140). Loevinger, J. 1957. “Objective tests as instruments of psychological theory: Monograph Supplement 9,” Psychological reports (3:3), pp. 635–694. Loiacono, E., and Djamasbi, S. 2010. “Moods and Their Relevance to Systems Usage Models within Organizations: An Extended Framework,” AIS Transactions on Human-Computer Interaction (2:2), pp. 55–72. MacKenzie, S. B., Podsakoff, P. M., and Podsakoff, N. P. 2011a. “Construct measurement and validation procedures in MIS and behavioral research: Integrating new and existing techniques,” MIS quarterly (35:2), pp. 293–334. MacKenzie, S. B., Podsakoff, P. M., and Podsakoff, N. P. 2011b. “Construct Measurement and Validation Procedures in MIS and Behavioral Research: Integrating New and Existing Techniques,” MIS Quarterly. (35:2), pp. 293–334. Manning, C. D. 2011. “Part-of-speech tagging from 97% to 100%: is it time for some linguistics?,” in Computational Linguistics and Intelligent Text Processing, Springer, pp. 171–189. Manning, C. D., and Schütze, H. 1999. Foundations of statistical natural language processing,MIT press. McCoach, D. B., Gable, R. K., and Madura, J. P. 2013. Instrument development in the affective domain, Springer (available at http://link.springer.com.silk.library.umass.edu/content/pdf/10.1007/9781-4614-7135-6.pdf). Nunnally, J. 1978. Psychometric methods, New York: McGraw-Hill. O’Connor, B., Balasubramanyan, R., Routledge, B. R., and Smith, N. A. 2010. “From Tweets to Polls: Linking Text Sentiment to Public Opinion Time Series.,” ICWSM (11:122-129), pp. 1–2. Owoputi, O., O’Connor, B., Dyer, C., Gimpel, K., Schneider, N., and Smith, N. 2013. “Improved Part-ofSpeech Tagging for Online Conversational Text with Word Clusters.,” in HLT-NAACL, pp. 380– 390 (available at http://www.aclweb.org/anthology/N/N13/N13-1039.pdf). Pennacchiotti, M., and Popescu, A.-M. 2011. “Democrats, republicans and starbucks afficionados: user classification in twitter,” in Proceedings of the 17th ACM SIGKDD international conference on Knowledge discovery and data mining, ACM, pp. 430–438. Rao, D., Yarowsky, D., Shreevats, A., and Gupta, M. 2010. “Classifying latent user attributes in twitter,” in Proceedings of the 2nd international workshop on Search and mining user-generated contents, ACM, pp. 37–44 (available at http://dl.acm.org/citation.cfm?id=1871993). Ratcliff, R., and McKoon, G. 1988. “A retrieval theory of priming in memory.,” Psychological review (95:3), p. 385. Rossiter, J. R. 2002. “The C-OAR-SE procedure for scale development in marketing,” International journal of research in marketing (19:4), pp. 305–335. Russell, J. A. 2003. “Core affect and the psychological construction of emotion.,” Psychological review (110:1), p. 145. Smith, N. A. 2011. “Linguistic structure prediction,” Synthesis lectures on human language technologies (4:2), pp. 1–274. Steelman, Z. R., Hammer, B. I., and Limayem, M. 2014. “Data collection in the digital age: innovative alternatives to student samples,” Mis Quarterly (38:2), pp. 355–378. Straub, D., Boudreau, M.-C., and Gefen, D. 2004. “Validation guidelines for IS positivist research,” The
Business Analytics Congress, Fort Worth 2015
10
Inductive Scale Development from Twitter Data
Communications of the Association for Information Systems (13:1), p. 63. Takhteyev, Y., Gruzd, A., and Wellman, B. 2012. “Geography of Twitter networks,” Social NetworksCapturing Context: Integrating Spatial and Social Network Analyses (34:1), pp. 73–81. Twitter Inc. 2015. “Public streams | Twitter Developers,” http://dev.twitter.com (available at https://dev.twitter.com/streaming/public; retrieved July 27, 2015). Zhang, P. 2013. “The Affective Response Model: A Theoretical Framework of Affective Concepts and Their Relationships in the Ict Context,” MIS Quarterly (37:1), pp. 247–274.
Business Analytics Congress, Fort Worth 2015
11