Inference on …ltered and smoothed probabilities in Markov-switching autoregressive models Rocio Alvarez
Maximo Camachoy
Manuel Ruiz
Universidad Central de Chile
Universidad de Murcia
Universidad Politécnica de Cartagena
[email protected]
[email protected]
[email protected]
September 1, 2017
Abstract We derive a statistical theory that provides useful asymptotic approximations to the distributions of the single inferences of …ltered and smoothed probabilities, derived from time series characterized by Markov-switching dynamics. We show that the uncertainty in these probabilities diminishes when the states are separated, the variance of the shocks is low, and the time series or the regimes are persistent. As empirical illustrations of our approach, we analyze the U.S. GDP growth rates and the U.S. real interest rates. For both models, we illustrate the usefulness of the con…dence intervals when identifying the business cycle phases and the interest rate regimes. Keywords: Markov Switching, Business Cycles, Time Series. JEL Classi…cation: E32, C22, E27.
We would like to thank M. Carnero, T. Niguez, G. Perez Quiros, P. Poncela, and E. Ruiz, the editor, the associate editor and three anonymous reviewers for their helpful comments and suggestions. M. Camacho and M. Ruiz acknowledge the …nancial support from projects ECO2016-76178-P and ECO2015-65637-P, respectively. Rocio Alvarez acknowledges the …nancial support from project CIP16013 (Universidad Central de Chile). This study is the result of the activity carried out under the program Groups of Excellence of the region of Murcia, the Fundación Séneca, Science and Technology Agency of the region of Murcia project 19884/GERM/15. All remaining errors are our responsibility. y Corresponding Author: Universidad de Murcia, Facultad de Economia y Empresa, Departamento de Métodos Cuantítativos para la Economía y la Empresa, 30100, Murcia, Spain. E-mail:
[email protected].
1
1
Introduction
In Markov-switching autoregressive models, the behavior of a time series is assumed to be disrupted occasionally by shocks that produce di¤erent dynamics, regimes, or states, the transitions of which are governed by an unobservable state variable that is usually assumed to follow a …rst-order Markov chain. These models have become extremely popular in economic analyses since the work of Hamilton (1989). Among other areas, regime-switching models have been applied to exchange rate swings (Engel and Hamilton, 1990; Engel, 1994), stock market returns (Pagan and Schwert, 1990; Hamilton and Lin, 1996), interest rates (Garcia and Perron, 1996; Dahlquist and Gray, 2000.), asset returns (Kim, Nelson and Startz, 1998; Ang and Bekaert, 2002), and asymmetries over the business cycle (McConnell and Perez-Quiros, 2000; Chauvet and Hamilton, 2006).1 The widespread success of these models might rely on the fact that analysts can easily draw a probabilistic inference about the hidden Markov chain, given the observations of the time series. The inference used to separate the unobserved regimes is expressed through the …ltered state probabilities and the smoothed full-sample probabilities, and historical dates of the turning points are typically established when the probability of one particular regime crosses some pre-speci…ed thresholds (Chauvet and Hamilton, 2006). This is of interest in its own right, because the regimes can provide substantive meaning about the occurrence of economic events. Although the outcomes of these analyses readily lead to policy implications, note that they are developed from single values of …ltered and smoothed inferences, which do not re‡ect the uncertainty surrounding these inferences. In this context, the primary purpose of this study is to derive a statistical theory that provides useful asymptotic approximations to the distributions of the single inferences of …ltered and smoothed probabilities, derived from time series characterized by Markov-switching dynamics. Bickel, Ritov, and Ryden (1998) show that under mild conditions, the inverse of the negative of the Hessian evaluated at the Maximum-Likelihood (ML) estimates is a consistent estimator of the covariance matrix of the set of parameters governing the Markov-switching autoregressive models. Using these results, we show how the delta method gives a technique for computing the variance of these transformations based on a Taylor series approximation, which is used to compute their respective con…dence intervals. To evaluate the performance of our proposal, we conduct a set of Monte Carlo simulations, allowing regimes a¤ecting the mean, the autoregressive parameters, and variance. The results suggest a thoughtprovoking, recurrent pattern: the uncertainty on …ltered and smoothed probabilities increases signi…cantly around the turning points. Therefore, we propose using sharp increases in the uncertainty to detect phase changes and to separate the regimes, which could be especially useful in real-time analyses. In addition, 1 Although
we focus on economic applications, the Markov-switching model has found widespread applications in many
areas, including bioinformatics, biology, …nance, hydrology, marketing, medicine, and speech recognition. See FruhwirthSchnatter (2006) for an overview.
2
we show that the uncertainty diminishes when the regimes are clearly separated (i.e., the within-state means are far from each other), the variance of the idiosyncratic shocks is low, the inertia of the time series is high, and the regimes are persistent. To illustrate our approach empirically, we propose a twofold exercise. In the …rst exercise, we compute inferences on the U.S. business cycle phases using a model where GDP is characterized by a recurrent sequence of shifts between two …xed equilibria of high-growth and low-growth means. The in-sample results suggest that establishing the historical turning points when the probability of one particular business cycle state remains above or below some pre-speci…ed thresholds, without knowing the uncertainty surrounding the point estimates, is inadvisable, particularly when the point estimates are close to the thresholds. In a real-time analysis, we …nd that a salient characteristic of the U.S. cycle dynamics is that the uncertainty of the …ltered and smoothed probabilities increases signi…cantly when the changes in the business cycle phase occur, while it decreases signi…cantly in the course of the new phase. Therefore, it is worthwhile considering the con…dence intervals on the business cycle probabilities when monitoring ongoing economic developments. In the second empirical example, we follow Garcia and Perron (1996) and allow three possible regimes a¤ecting both the mean and variance of the U.S. ex-post real interest rate, which follows autoregressive dynamics of order two. Based on an updated sample, our results still suggest that the interest rate is characterized by three distinct phases of low, middle, and high levels. We …nd single distinct phase changes from the low regime to the middle regime in 1953:3, and from the middle regime to the low regime in 1973:4. However, dating the regime shifts becomes increasingly uncertain after this point. The shift to the high regime could occur between 1980:4 and 1981:2, the shift to the middle regime could occur between 1986:4 and 1990:2, and the shift to the low regime could occur between 2002:1 and 2003.1. The remainder of this paper is organized as follows. Section 2 presents the asymptotic distribution theory for the …ltered and smoothed probabilities of one particular regime, and outlines a simple method to construct asymptotically valid con…dence intervals. Section 3 proposes a simulation experiment to assess the impact on the uncertainty surrounding the …ltered and smoothed probabilities of the model parameters. Section 4 shows the usefulness of the proposed model by analyzing the U.S. business cycle phases and the U.S. interest rate regimes. Lastly, Section 5 concludes the paper.
2
Computing uncertainty
2.1
The model
Let yt be a stationary time series of T + p observations whose autoregressive dynamics evolve according to an unobservable K-state Markov-chain process st .2 For the sake of generality, the means, regression 2 General
characterizations of stationarity conditions for such processes can be found in Francq and Zakoïan (2001).
3
coe¢ cients, and volatility of the Markov-switching autoregressive model are state-dependent: yt =
st
p X
+
j;st
j
(yt
j
st
j
) + "t ;
(1)
j=1
where "t
N (0;
2 st )
and p is the lag-length of the underlying state-dependent autoregressive process.3
To complete the statistical characterization of this process, we assume that st is a Markov chain of order one. Then, the probability of a change in regime depends on the past only through the value of the most recent regime P (st = jjst
1
= i; :::; s1 = l; Yt
where Yt = y1 ; y2 ; :::; yt , and i; j = 0; 1; : : : ; K
1)
= P (st = jjst
1
= i) = pij ;
(2)
1.
Since the nonlinear autoregressive process depends not only on st , but also on st convenient to de…ne the latent variable st = (st ; st
1 ; : : : ; st p ),
which results in K
1 ; :::; st p ,
p+1
it is
di¤erent states.
The transition probabilities of st can easily be found from the transition probabilities of the primitive states st . Let us de…ne the states j of st as j = (j0 ; j1 ; : : : ; jp ), with ji 2 f0; 1; : : : ; K
1g, i = 0; 1; :::; p.
Then, the transition probabilities of st are
P (st = jjst
2.2
1
= i) := pij =
8 > > p > < i0 j0
always ir = jr
1
for r = 1; 2 : : : ; p (3)
> > > : 0
otherwise
Variance of …ltered probabilities
We collect the r model parameters in the vector 2 0; : : : ;
2 K 1 ; p00 ; : : : ; pK 1K 1
=(
0; : : : ;
K 1;
1;0 ; : : : ;
1;K 1 ;
p;0 ; : : : ;
p;K 1 ;
. As an application of Bayes’ law for this setting, Hamilton (1989)
computes estimates of the …ltered probabilities, as follows: P (st = ij ; Yt ) := Pti ( ) =
f (yt j ; Yt
1 ; st
= i)P (st = ij ; Yt f (yt j ; Yt 1 )
p P is the pdf of a Gaussian distribution with mean st + j=1 P variance 2st , and f (yt j ; Yt 1 ) = f (yt j ; Yt 1 ; st = i)P (st = ij ; Yt 1 ).
where f (yt j ; Yt
1 ; st )
1)
;
st
(4)
j
(yt
j
st
j
) and
i
Then, given that the random series st follows a …rst-order Markov-chain process, it is easy to see that
the following equalities hold: P (st = ij ; Yt
1)
=
X
pji Ptj 1 ( );
(5)
j
and f (yt j ; Yt 3 Following
1)
=
X i
f (yt j ; Yt
1 ; st
= i)
X
pji Ptj 1 ( ):
(6)
j
the standard assumptions on Markov-switching autoregressive models, we focus on normal errors in this
study. However, this is not restrictive, and can easily be generalized.
4
From (6) and (5), if we denote and variance
2 i0 ,
i t
as the pdf of a Gaussian distribution with mean
i0 +
the …ltered probabilities become P
i t
P
i t
i
z=1
iz (yt z
iz )
pji Ptj 1 ( )
j
Pti ( ) = P
p P
j
pji Ptj 1 ( )
:
(7)
Using the results suggested by Hamilton (1989), a natural estimate of the vector of parameters is the ML estimator b, because the conditional likelihood function can be obtained as a by-product of
Hamilton’s …lter.4 Bickel, Ritov, and Ryden (1998) show that under mild conditions the ML estimator is not only consistent, but is also asymptotically normal, and prove that the observed information matrix is a consistent estimator of the Fisher information. Thus, the distribution of the ML estimate b can be well approximated for large samples by
b
1
N( ; T
Ib 1 );
(8)
where Ib is known as the Fisher information matrix. In practice, the covariance matrix can be estimated by
where L( ) is the log-likelihood
Ib = L( ) =
T
T X t=1
1 @L(
)
@ @
0
j
=b ;
log(f (yt j ; Yt
(9)
1 )):
(10)
Then, the covariance matrix of the ML estimator is estimated as the inverse of the negative of the Hessian evaluated at b.
Thus, assuming that Pti (b) is a smooth transformation of b for all t, and that the partial derivatives
@Pti (b) j
exist for all j = 1; 2; : : : ; s, the delta method applies. Then, the variance of Pti (b) becomes 2 Pti (b)
= V ar(Pti (b)) = r(Pti (b))0
@L( ) j @ @ 0
1
=b
r(Pti (b));
(11)
where r(Pti (b)) denotes the gradient of Pti ( ) evaluated at b. This gradient is obtained by computing @Pti ( ) @ s ,
for all s = 1; 2; : : : ; r. To this end, if we denote
i t;
A= B=
X
(12)
Ptj 1 ( )pji ;
(13)
X
(14)
j
C=
X i
i t
pji Ptj 1 ( );
j
then the probabilities are given by the ratio Pti ( ) = 4 Note
A B : C
that the …lter requires an initial condition of P0i ( ), for all i, which typically is the ergodic probability.
5
(15)
Then, the partial derivatives of this ratio are obtained as h i @A @B B + A i @ s @ s C @Pt ( ) = @ s C2 where
i t
@ @A = @ s @
AB @@Cs
;
(16)
;
(17)
s
" # X @Ptj 1 ( ) @pji @B j = pji + Pt 1 ( ) ; @ s @ s @ s
(18)
j
2 X @C 4@ = @ s @ i
i t s
X
pji Ptj 1 ( ) +
!3 @pji j @Ptj 1 ( ) 5: P ( ) + pji @ s t 1 @ s
i t
j
(19)
Next, we explain the obtained estimation procedure from a practical point of view. The above equations suggest an iterative algorithm for …nding the estimate of the gradients r(Pti ( )), t = 1; : : : ; T . Starting from the initial condition at t = 0 for the …ltered probabilities used in the Hamilton’s …lter and the gradient for each i, fP0i ( );
@P0i ( ) @P0i ( ) @P0i ( ) @ 1 ; @ 2 ; : : : ; @ r g,
which are the magnitudes on the right-hand sides of (16)-
(19), the left-hand sides of these expressions then produce a new estimate for the gradient r(P1i ( )).5 This estimate can be used to re-evaluate (16)-(19), and we can continue iterating in this fashion until the last gradient r(PTi ( )). The gradients can now be used in (11) to obtain the variances of the …ltered probabilities. Finally, the inference about the unobserved state st at t, given observations up to t, can be expressed in terms of the probability distribution of the …ltered probabilities: P (st = ij ; Yt ) := Pti ( ) =
X
P (st = ij ; Yt );
(20)
i;i0 =i
for all i = 0; 1; 2; : : : ; K
1. Then, it follows that r(P (st = ij ; Yt )) =
X
i;i0 =i
r(P (st = ij ; Yt ))
(21)
and, therefore, we can estimate the variance of the …ltered probabilities P (st = ij ; Yt ) as: 2 Pti (b)
2.3
= V ar(Pti (b)) =
X
i;i0 =i
r(P (st = ij ; Yt ))0
@L( ) j @ @ 0
1 =b
X
i;i0 =i
r(P (st = ij ; Yt )):
(22)
Variance of smoothed probabilities
When using a time series to separate the K possible states, probability statements about st that incorporate the overall information Yt are frequent in practice. Such probability statements are given by the 5 In
the simulations and in the empirical applications, we use the ergodic probabilities as a initial condition of P0i ( ).
For the means, the variances and the autoregressive parameters, the initial conditions for the transition probabilities,
@P0i ( ) , @pij
@P0i ( ) @ i
are zero. In the case of
this derivative is positive when i = j, and negative when i 6= j. This implies that the
…ltered probability of regime i increases with pii , and decreases with pij , for i 6= j.
6
full-sample smoothed probabilities P (st = ij ; YT ) := Smit ( ). The smoother suggested in Kim (1994) expresses these probabilities in a way that they may be obtained recursively from the …lter probabilities: Smit ( ) = Pti ( )
K X1 j=0
Smjt+1 ( )pij ; KP1 r Pt ( )prj
(23)
r=0
1. The smoother operates as a backward algorithm, starting from SmjT ( ) =
for all i = 0; 1; 2; : : : ; K
PTj ( ) and running backwards in time. Following the same reasoning as in the case of the …ltered probabilities, the variance of the smoothed probabilities can be computed as follows: V ar(Smit (b)) :=
2 b Smit ( )
= r(Smit (b))0
@Smit ( ) @ s
The gradient r(Smit ( )) can be obtained by computing @Smit ( ) @ s
=
kP1 Smj ( )p ij t+1 kP1 r j=0 Pt ( )prj
@Pti ( ) @ s
kP1
"
@L( ) j @ @ 0 as
1
r(Smit (b)):
=b
(24)
+ Pti ( )
r=0 j ( ) t+1 pij +Smjt+1 ( @ s
@Sm
)
@pij @ s
#
kP1 r=0
Ptr ( )prj kP1
j=0
r=0
Smjt+1 ( )piji
Ptr ( )prj
!2
kP1h r=0
@Ptr ( ) r @ s prj +Pt (
)
@prj @ s
i
(25) ;
for s = 1; 2; :::; r. Taking into account that SmiT ( ) = PTi ( ), equation (25) suggests using iterative backwards algorithm to estimate the gradients r(Smit ( )), for all t = T starting at t = T
1,
@PTz ( ) @ s ,
PTz ( ),PTz
1(
1; T
2; : : : ; 1. More speci…cally,
), and the transition probabilities are the magnitudes on the @SmiT 1 ( ) @PTz 2 ( ) . This estimate, together with , @ s @ s @SmiT 2 ( ) . Then, continue iterating backwards in this @ s
right-hand side of (25), producing an estimate of PTz
2(
),SmzT
1(
) can now be used to calculate
way until the …rst gradient r(Smi1 ( )) is calculated.
2.4
Asymptotic distribution
Dealing with the issue of inference on the …ltered and smoothed probabilities requires a distribution for the unobserved probabilities. Using the results developed above, for a given regime i, the …ltered probabilities follow asymptotically normal distributions, with means approximated by Pti (b) and Smit (b), and variances approximated by Therefore, 100(1
2 Pti (b)
and
2 , Smit (b)
respectively.
)% con…dence intervals have the form P Rti
CI (P Rti ) = [b1
P Rti =2 ; b =2 ];
(26)
where P Rti is Pti (b) for …ltered probabilities and Smit (b) for smoothed probabilities, and b is de…ned as P (N (P Rti ;
2 ) P Rti
P Rti
) = . These intervals can be improved on, in the sense that at least 95% of the i h P Ri P Ri samples, the estimated value of P Rti will be in max b1 t =2 ; 0 ; min b =2t ; 1 .6 6 An
>b
alternative would be to approximate the distribution of the …ltered and smoothed probabilities with a Beta distri-
bution with means Pti (b) and Smit (b), and variances
2 Pti (b)
and
7
2 Smit (b)
, respectively.
3
Monte Carlo simulation
3.1
Inference on turning point dates
To evaluate the impact of the model parameters on the uncertainty associated to …ltered and smoothed probabilities from (1), we follow Cavicchioli (2014) to consider the univariate Markov-switching model yt = where "t
N (0;
2 7 st ).
st
+
st (yt 1
st
1
) + "t ;
(27)
In this model, st is a two-state Markov-chain process of order one that takes the
value 0 in the …rst regime, and 1 in the second regime. Using this model, we generate dummy variables st of zeroes and ones of length T = 250, which are used to simulate di¤erent sequences of the two regimes of the unobserved state variable, assuming that p00 = p11 = 0:9. In addition, we generate shocks "t with variances
2 0
= 0:5 and
2 1
= 1. The
dynamics of the generated time series yt are assumed to follow an autoregressive process of order one, with autoregressive parameters
0
= 0:2 and
1
= 0:5, and within-state means
= 1 and
0
1
=
1,
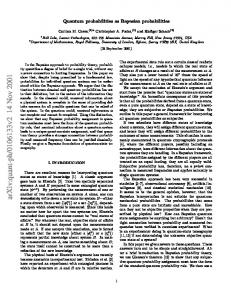
respectively. The estimated probabilities of state 1, the standard deviation of the point estimates, and the dates for which the state variable takes the value one in this simulation (shaded areas) are plotted in Figure 1. The …rst and the third panels of this …gure, which plot the …ltered and smoothed probabilities respectively, show that the model accurately captures the two di¤erent regimes, because the probability of state 1 is high when st = 1, and low when st = 0. The second and the fourth panels in the …gure show that the standard deviation of the probability of state 1 in the middle of the two phases is low, which implies that the information content of the …ltered probabilities as classi…cation rules is high in this example. Notably, the uncertainty surrounding the point estimates of the probabilities increases signi…cantly around the dates on which the model detects regime changes. As a result, the con…dence intervals become wide around the turning points, indicating a high degree of uncertainty in identifying the state at these dates. This suggests that rapid jumps in the uncertainty associated with a particular regime might be useful in determining the timing of the turning points from (or towards) this regime.
3.2
Sensitivity analysis
In this section, we set up several Monte Carlo experiments to examine how the model parameters might a¤ect the measures of the uncertainty of the …ltered and smoothed probabilities. For this purpose, Figures 2 and 3 show the medians over the T generated observations of the standard deviation of the probabilities of state 1 when the baseline parameters change as follows: in Panel A, in Panel B, 7 Note
2 0
=
2 1
0
1
= 1; 1:1; :::; 3;
= 0:5; 0:7; :::; 2; in Panel C, p00 = p11 = 0:5; 0:6; :::; 0:9; and in Panel D,
0
=
1
=
that the model implies a general class of Markov-switching dynamics: it allows the regimes a¤ecting the mean,
the autoregressive parameters, and variance. Without loss of generalization, the lag length is restricted to one.
8
0:1; 0:2; :::; 0; 9. The …gures show that the uncertainty over the inference on the computed …ltered and smoothed probabilities increases with the variance of the shocks, which means that it is more di¢ cult to distinguish the regime switches in processes that include large shocks. In addition, the uncertainty of the …ltered and smoothed probabilities decreases with the di¤erence of within-state means because the regimes are clearly separated from one another, which implies that the changes in regime are clear from the data. The uncertainty also decreases with the inertia of the states, and with the autoregressive parameter of the process because, in both cases, the regimes are persistent and the number of turning points, which are the source of the uncertainty, diminishes.
4
Empirical illustrations
The empirical relevance of the proposed theory is illustrated through two applications. The …rst application focuses on a formal statistical model of business cycle phase shifts, which has probably been the most extensive application of Markov-switching autoregressive models. In the second application, three states are allowed to characterize the infrequent changes in the mean and variance of the ex-post real interest rate.
4.1
Analysis of business cycle regimes
Hamilton (1989) proposes that output growth may follow one of two di¤erent autoregressions, with high and low means, depending on whether the economy is expanding or contracting, with the shift between the regimes governed by the outcome of an unobserved …rst-order Markov chain.8 Accordingly, the growth rate of U.S. quarterly real GDP from 1951.1 to 2016.3, yt , is allowed to switch according to yt =
st
+ "t :
At time t, we label st = 0 as expansions and st = 1 as recessions, with
(28) 1