Dec 22, 2016 - TP53. E2F1. TK1. CASP8. CASP7. PCNA. CCNB1. APAF1. PTGS2. MYB. NPAT. MYBL2. CDT1. NRP1. PFKFB3. CDCA7. TERT. BBC3. CASP3.
bioRxiv preprint first posted online Dec. 22, 2016; doi: http://dx.doi.org/10.1101/096362. The copyright holder for this preprint (which was not peer-reviewed) is the author/funder. It is made available under a CC-BY-NC-ND 4.0 International license.
Inferring hidden causal relations between pathway members using reduced Google matrix of directed biological networks 1
2
José Lages , and Dima L. Shepelyansky 1
3
and Andrei Zinovyev
Institut UTINAM, Observatoire des Sciences de l'Univers THETA, CNRS, Université de Franche-Comté, 25030 Besançon, France
2
Laboratoire de Physique Théorique du CNRS, IRSAMC, Université de Toulouse, CNRS, UPS, 31062 Toulouse, France
3
Institut Curie, PSL Research University, Mines Paris Tech, Inserm, U900, F-75005, Paris, France
Dated: December 20, 2016
Abstract. Signaling pathways represent parts of the global biological network which connects them into a
seamless whole through complex direct and indirect (hidden) crosstalk whose structure can change during normal development or in a pathological conditions such as cancer. Advanced methods for characterizing the structure of the global directed causal network can shed light on the mechanisms of global cell reprogramming changing the distribution of possible signaling �ows. We suggest a methodology, called Googlomics, for the analysis of the structure of directed biological networks using spectral analysis of their Google matrix. This approach uses parallels with quantum scattering theory, developed for processes in nuclear and mesoscopic physics and quantum chaos. We introduce the notion of reduced Google matrix in the context of the regulatory biological networks and demonstrate how its computation allows inferring hidden causal relations between the members of a signaling pathway or a functionally related group of genes. We investigate how the structure of hidden causal relations can be reprogrammed as the result of changes in the transcriptional network layer during cancerogenesis. The suggested Googlomics approach can be useful in various contexts for characterizing non-intuitive changes in the wiring of complex and large causal biological networks.
1 Introduction
ology of transcription factor binding site predictions combined with the data on chromatin accessibility [39].
The network biology point of view on signaling pathway as a part of complex integrated molecular machinery consists in considering it as a subnetwork embedded into a global molecular network. As a consequence, all properties of the pathway functioning depend on the network context to which it remains connected. Considering only the set of direct causal relations between pathway members (as is frequently the case) neglects the indirect e�ect of the global biological network changes which may signi�cantly re-wire the pathway topology by introducing implicit (hidden) causal relations. Characterizing such in�uence of the global network structure on the local network properties and dynamics remains one of the major challenges of sys-
In the previous works, quanti�cation of indirect interactions (sometimes called in�uences) between pathway members mainly exploited the calculation of shortest or second shortest paths (the paths that become shortest after removal of an edge in a shortest path), following quanti�cation of the balance between negative and positive path signs [17,7]. The limitation of such approaches is, however, in that they do not take into account the complex global structure of the network: multiple dense causal connections between two nodes might be more important than a single shortest path connecting them, representing a hypothetical sequence of intermediate regulations.
tems and network biology [3]. A number of empirical and
Global changes in the structure of the global network
pragmatic approaches have been suggested recently to ad-
might e�ectively re-wire a signaling pathway even if its
dress this question [16,26,33,12,17].
direct interactions are weakly dependent on the biolog-
Reconstructions of the global directed causal signal-
ical context. For example, the functioning of a signal-
ing network structure have appeared only recently in the
ing pathway must be heavily a�ected by the structure of
form of comprehensive molecular interaction databases
transcriptional feedbacks indirectly re-wiring the pathway
such as SIGNOR[42], SignaLink [22], where the pair-wise
structure by gross e�ect of implicit (hidden) causal rela-
relations between molecules are oriented. Large-scale cell
tions.Therefore, changing the transcriptional layer in the
type-speci�c reconstructions of transcriptional causal net-
global network e�ectively rewires many signaling path-
works have become possible thanks to appearance of Chip-
ways even without a�ecting the structure of direct con-
Seq technology [23,25] or advances in computational method- nections between its members. Therefore, it would be ad-
bioRxiv preprint first posted online Dec. 22, 2016; doi: http://dx.doi.org/10.1101/096362. The copyright holder for this preprint (which was not peer-reviewed) is the author/funder. It is made available under a CC-BY-NC-ND 4.0 International license.
J.Lages et al.: Google matrix analysis of causal cancer protein networks
2
vantageous to develop an e�cient and rigorous mathemat-
in a given cell line. Transcriptional networks for GM12878
ical formalism allowing quantifying such a phenomenon.
and K562 cells have been previously analyzed in order
In this paper, we suggest a candidate methodology for this
to estimate their structural properties which can lead to
purpose.
bu�ering and robustness [2]. It was demonstrated that the
wiring of the transcriptional network in cancer leads to sigWe assess the characteristics of signal propagation through a pathway by considering the stochastic Markov process
ni�cant changes in the number of structural patterns lead-
of random walk with uniform non-zero restart (teleporta-
ing to violating the network robustness properties. In or-
tion) probability along oriented edges of the graph repre-
der to deal with combined signaling+transcriptional net-
senting the global biological network. This process is de-
works, we merged each of the transcriptional network to
scribed by Google matrix (see Materials and Methods sec-
the global reconstruction of signaling taken from the SIG-
tion), and its stationary state de�nes PageRank centrality
NOR database [42] (version from February 2016). There-
measure of the graph nodes. More complete and subtle
fore, as a modeling assumption, we assume that the struc-
description of the process can be obtained by looking at
ture of the global signaling network does not depend on
the complete (complex) spectrum of the Google matrix,
the biological context while the transcriptional regulation
which might re�ect complex non-stationary properties of
layer undergo signi�cant changes leading to indirect e�ect
the random walk. For example, grouped eigenvalues of the
on the signaling.
Google matrix in the complex plane can de�ne weak communities in the graph where the signaling �ow (random walk) can be �trapped� for a �nite time. In order to quantify indirect hidden causal relations between the members of a pathway, we introduce the original formalism of reduced Google matrix, based on decomposing the global Google matrix into the parts describing the pathway itself and the in�uence of the rest of the network. To our knowledge, Google matrix approach or related ideas have been applied before only to undirected networks, in order to �nd activated network modules or to smooth the high-throughput data [43,29,32], establish con-
2.2 Biological interpretation of PageRank and CheiRank centrality measures and their changes in cancer 2.2.1 Distribution of proteins on PageRank vs CheiRank plane
For the three directed biological networks described above (SIGNOR alone and two merged signaling+transcriptional
nection of genes to diseases [45,31], improve interpretabil-
regulatory networks), we applied the Google matrix method-
Google matrix is applied for biological networks in this
all proteins. The distribution of proteins in PageRank vs
ity of genome-wide analyses [40,36,34] and compute network- ology as described in Materials and Methods section, and determined the values of PageRank and CheiRank for based cancer biomarkers [46]. The formalism of reduced paper for the �rst time. We describe the details of the Google matrix and reduced Google matrix methodology in the �Methods� section, and in the �Results� section application of the methodology to several large regulatory networks is documented.
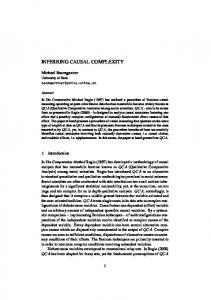
CheiRank plane is shown in Figure 1. This �gure shows that in the case of these networks PageRank and CheiRank measures are not correlated which re�ects quite distinct biological role of proteins with many incoming and with many outgoing directed interactions.
Using the suggested approach, we quantify the e�ect of
It can be easily demonstrated (data not shown) that
the changes in the structure of transcriptional network as
most of the proteins simultaneously having high values
a result of oncogenic events during chronic myelogenous
of PageRank and CheiRank (such as AKT1, NOTCH1,
leukemia onto re-wiring connections between proteins in
CTNNB1, TP53, CDKN1A, ATM, MAPK3, CDK1, EGFR)
several cancer-related groups of genes. We conclude that
play an important role in cancer biology. This is, however,
the method is able to infer the missing indirect causal re-
a rather trivial observation having in mind that it is known
lations between the members of a pathway and can detect
that hubs of the protein interaction networks frequently
events of hidden re-wiring during cancerogenesis.
correspond to cancer-related genes [30,3]. One can also observe that adding a transcriptional
2 Results 2.1 Used networks and case study description
network to a signaling network (SIGNOR) signi�cantly changes the top ranked proteins for CheiRank but not for PageRank. This is consistent with the fact that the transcriptional networks are characterized by fan-like structures in which a transcription factor can regulate many
In order to illustrate the application of Google matrix ap-
(hundreds) of proteins, while the cases when a protein is
proach to studying oncogenic changes in the global and lo-
regulated by so many upstream regulator are relatively
cal network structures, we constructed two large directed
rare.
networks describing global signaling in a leukemia cancer
Overall, the general shape of the distribution of pro-
cell line K562 compared to a healthy cell line GM12878
teins in the �normal� GM (Figure 1,middle) and �cancer�
derived from normal B-lymphocytes. The transcriptional
K562 (Figure 1,right) networks is similar; nevertheless,
networks of these two cell lines have been previously char-
there are di�erences. For example, it can be seen that the
acterized [25], using systematic Chip-Seq experiments on a
top Chei-ranked proteins are not the same in these two
number of transcription factors whose activity is detected
networks. There is a region in the PageRank vs CheiRank
bioRxiv preprint first posted online Dec. 22, 2016; doi: http://dx.doi.org/10.1101/096362. The copyright holder for this preprint (which was not peer-reviewed) is the author/funder. It is made available under a CC-BY-NC-ND 4.0 International license.
J.Lages et al.: Google matrix analysis of causal cancer protein networks
3
plane for GM network (Figure 1,middle) occupied by pro-
TEK is the sink of the cascade TAL1→ANGPT2→TEK,
teins which are present in SIGNOR but not in GM12878
which progressively collects incoming regulations, start-
transcriptional network (cluster of green color points for
ing from the top connected hubs such as AKT1, MAPK3,
CheiRank and PageRank around 1000). Vice versa, there
PRKACA. The biological function of the TEK protein
is a region in K562 network (Figure 1,right) occupied by
is quite unique: this is a receptor tyrosine kinase which
proteins which are present in SIGNOR but not in K562
has several immunoglobulin-like domains, three epidermal
transcriptional network (cluster of dark blue points). This
growth factor domains and three �bronectin type III re-
observation underlines the fact that both the composition
peats in the extracellular part. This makes this protein
and the wiring topology of �normal� and �cancer� networks
potential regulator of multiple cellular functions such as
have important di�erences.
angiogenesis, endothelial cell survival, proliferation, migration, adhesion and cell spreading, reorganization of the actin cytoskeleton, and also maintenance of vascular qui-
2.2.2 Detecting �creative protein elements� by comparing
escence. Such rich functional cross-talk allows suggesting
PageRank and CheiRank to simple connectivity
TEK as a creative element in the global cell signaling network.
A general statement on PageRank and CheiRank is that
Our �nal example of deviation from the major CheiRank
they are correlated to in-degree and out-degree of a node
vs out-degree trend is TLR4 protein, which is ranked #22
[21]. However, this correlation is not perfect as it can
by CheiRank in SIGNOR having only 2 out-going regula-
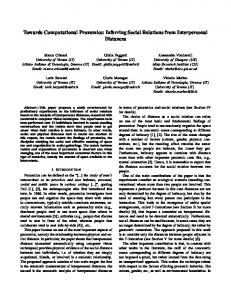
be seen in Figure 2. Some proteins signi�cantly deviate
tion and 1 self-interaction. From the Google matrix-based
from the general dependence trend, so it is interesting to
network analysis this can be explained by the fact that
consider what kind of non-local network topologies give
TLR4 triggers several cascades a�ecting downstream sev-
unexpectedly high PageRank or CheiRank values despite
eral major regulators having a large number of out-going
relatively low connectivity degree. This deviation can be
edges such as AKT1. Indeed, the biological function of
scored by a simple product of the rank and the corre-
TLR4 (toll-like receptor 4) is activating the innate im-
CEin = K ·(InDegree+1), CEout = K ∗ · (OutDegree + 1).
mune system which requires triggering many important
sponding degree, i.e.,
The notion of �creative elements� in the context of bi-
cellular cascades (such as NFkB signaling), regulating a large number of cellular processes.
ological networks is discussed in [16] as such proteins that
Other observations from Figure 2 underlies some par-
are not hubs of the networks themselves but can pro-
ticular features and di�erences between �normal� and �can-
vide important (and, frequently, transient) connections
cer� networks. For example, one can notice in Figure 3A,right
between network hubs. Also, sometimes, together with
that in the cancer network there is a large number of pro-
hubs, proteins playing the role of �connectors� are dis-
teins with high number of incoming transcriptional regu-
cussed as those proteins having high centrality but not
lations but not ranked well by PageRank. This feature is
connectivity measures [3].
almost absent in the normal GM-SIGNOR network (Fig-
We suggest that the proteins signi�cantly deviating
ure 3A,middle).
from the the general trend between a Google matrix-based rank and the corresponding connectivity degree are potential candidates for the role of �creative elements� and
2.2.3 Biological meaning of PageRank and CheiRank
connectors in the signaling and transcriptional networks.
changes in cancer
Several examples of such proteins and the local topologies explaining the deviation from the trend are provided in Figure 3.
Having seen the di�erences in the distribution of PageRank and CheiRank in Figure 1 between the �normal� and
For example, the top ranked in PageRank protein in all
�cancer� regulatory network, we characterized the relative
three networks is PIK3CB (look at Figure 1) having rel-
change of the ranks by computing their log ratio between
atively low in-degree (10), which makes it to signi�cantly
two networks. Overall, the relative changes in CheiRank
deviate from the general trend (Figure 3A). PIK3CB gene
had larger amplitude than in PageRank which can be
encodes a catalytic subunit of the kinase PI3K, a key ki-
partially explained by the di�erent number of transcrip-
nase involved in multiple cell signaling cascades. PIK3CB
tional targets of the transcriptional factors, described in
gene is frequently mutated or ampli�ed in several cancer
the GM12878 and K562 transcriptional networks.
types (such as lung squamous cell carcinoma where its rate
We characterized the biological functions represented
of mutations can be as high as 18%), which causes abnor-
by those proteins signi�cantly deviating from zero in Fig-
malities in cell survival signaling. From the network point
ure 4, by applying the standard enrichment analysis based
of view, it's high value of PageRank is probably explained
on hypergeometric test, calculating what is the probability
by the fact that, accordingly to SIGNOR, PIK3CB is reg-
(p-value) of a selected protein set to intersect with some
ulated by several highly connected proteins which have
prede�ned protein set by random chance. For this pur-
predominantly incoming edges (PTEN, ERBB3, ERBB4,
pose we used the toppgene bioinformatics package [11]. For
HRAS, NRAS, KRAS, IRS1).
the enrichment analysis, we took those proteins deviating
An other example of such a protein is TEK which
from zero by two standard deviations of the distributions
is ranked #4 by PageRank in SIGNOR network, having
of PageRank of CheiRank log ratios, and analyzed the
only 5 incoming edges. From Figure 3B one can see that
positive and negative sides of the distribution separately.
bioRxiv preprint first posted online Dec. 22, 2016; doi: http://dx.doi.org/10.1101/096362. The copyright holder for this preprint (which was not peer-reviewed) is the author/funder. It is made available under a CC-BY-NC-ND 4.0 International license.
J.Lages et al.: Google matrix analysis of causal cancer protein networks
10
10
10
4
10
3 PIK3CB
PITX2 TEK SMAD4 KITPIK3CD LEF1 LRP6 BAX PPARG SMAD2 SMAD3 CASP9 CCND1 MYOD1 CTNNB1
2
AXIN1 RUNX2 CASP3 CDKN1A NOTCH1 TP53
PAK1 ABL1 SMO STK11 PTPN1 MAPK14 DYRK1A PRKCA PRKCD GSK3B BMP7 PDPK1 ATM CDK2 CSNK2A1 MAPK3 PRKACA AKT1 MAPK1 CDK1 SRC
1
0
10 0 10
GM SIGNOR CHEIRANK
SIGNOR CHEIRANK
10
10
1
10
2
10
SIGNOR PAGERANK
only in SIGNOR
3
10
10
10
4
3 PIK3CB
2
1
0
10
4
10
10 0 10
TEK SMAD4 KITPIK3CD LEF1 LRP6 BAX CASP9 PPARG SMAD3
FABP4
CTNNB1 MYOD1AXIN1 CASP3 CDKN1A TP53 EGFR NOTCH1 MAPK14 GSK3B AKT1 RFX5 PRKACA CDK1 ATM CSNK2A1 SP1 FOS MAPK3 ELF1 ZNF143 MAPK1SRF HOXB8 YY1 PBX3 NRF1 PRKAA1 CTCF SPI1 EBF1 REST GABPA
10
1
10
2
10
3
GM SIGNOR PAGERANK
only in GM12878 network
10
only in K562 network
4
K562 SIGNOR CHEIRANK
4
10
10
10
4
3 PIK3CB
2
STAT3 CEBPA PIK3CD TEKKITSMAD4 LEF1 LRP6 BAX PPARG CASP9
SMAD3 AXIN1 CTNNB1 CASP3 CDKN1A MYOD1 TP53 NOTCH1 CDK2 FOS AKT1 PRKACAAURKB SP2 MAPK14 TAL1 CDK1 USF1 ELF1 SP1 CSNK2A1 MAPK3 E2F6 NFYB MAPK1 GTF2B NRF1 YY1 EGR1 ZBTB7A GABPA
1
0
10 0 10
10
1
10
2
10
3
K562 SIGNOR PAGERANK
10
4
in GM12878 and K562 networks
Fig. 1. Distribution of proteins on PageRank x CheiRank plane for three networks (SIGNOR - signaling network, GM network is a merge of SIGNOR and GM12878 normal blood cell transcriptional network, K562 network is a merge of SIGNOR and K562 leukemia cancer cell transcriptional network). The colors signi�es to which network a protein originally belongs. Red color signi�es proteins which are present only in SIGNOR network and not present in any of the two transcriptional networks. Dark blue color signi�es proteins which are present in GM12878 transcriptional network and not present in K562 transcriptional network. Green color signi�es proteins which are present in K562 transcriptional network and not present in GM12878 transcriptional network. Cyan color signi�es proteins which are present in both K562 and GM12878 transcriptional networks.
The results of the analysis are presented in Table 1 and
mouse phenotype characterized by the increased number
online at
of lymphocytes and signi�cantly improved their CheiRank
http://www.ihes.fr/~zinovyev/googlomics/ grn2016/rankchanges/.
in the cancer network (they became more powerfull regu-
We've noticed, however, that the results of this analysis
lators). Having many transcriptional factors in the tran-
can be biased by a simple fact that a protein can be in-
scriptional networks explains signi�cance of such Gene
cluded in the �normal� transcriptional network GM12878
Ontologies as �core promoter binding� and �chromatin�
(thus having, for example, many transcriptional out-going
in the analysis of CheiRank changes in both directions,
interactions) and not at all included in the �cancer� tran-
and also interactions with key transcription co-regulators
scriptional network K562 (thus having not at all transcrip-
as EP300, HDAC1 and CREBBP.
tional out-going interactions). This is the case, for exam-
At the same time, the analysis gives also some unex-
ple, for ZEB1 transcriptional factor. Despite the fact that
pected �ndings. For example, a number of proteins in-
such di�erence can be �real�, i.e. the transcriptional factor
volved in translation (14 from 86 selected) or having the
might be not expressed in the case of cancer, hence, does
E2F transcription factor binding motif the promoter se-
not regulate any genes, we've decided to perform an addi-
quence (6 from 86) or being located in a speci�c genomic
tional analysis focusing only at those proteins which simul-
locus 22q11 (7 from 86) improved their PageRank in can-
taneously present in both �normal� and �cancer� transcrip-
cer network (meaning they became more regulated). 8
tional networks. These proteins might be present or not
from 63 genes with a speci�c motif in their promoter
in the SIGNOR network. This second analysis made sev-
sequences (TMTCGCGANR) showed signi�cant increase
eral biological functions detected in the previous analysis
in the PageRank (meaning they became less regulated in
insigni�cant (normal text lines in the Table 1) but many
cancer) is also an unexpected �nding.
remained signi�cant (bold text lines in the Table 1). For the second analysis, in case of CheiRank, we took those proteins which deviated from zero by one standard deviation in the distribution of log ratio of the CheiRanks, in order to collect a su�cient number of proteins.
2.3 Inferring hidden causal relations between members of protein sets
Overall, the undertaken analysis shows a picture consistent with the nature of the studied cells. I.e., we show
Application of Google matrix to the global network al-
that changes in the CheiRanks between normal and cancer
lows quantifying the global ranking of protein nodes and
cells highlights a number of proteins previously described
their changes, as it was illustrated in the previous section.
as being implicated in leukemia (16 from 53 selected for
Reduced Google matrix (see Materials and Methods for
the second analysis). Interestingly, this analysis highlights
formal description) allows focusing on a subset of nodes,
proteins implicated in the regulation of myeloid cell di�er-
quantify local importance of nodes in this subset and also
entiation and hemopoiesis, which is also expected. 9 from
detect indirect (hidden) connections between the members
30 selected proteins were previously associated with the
of the subset.
bioRxiv preprint first posted online Dec. 22, 2016; doi: http://dx.doi.org/10.1101/096362. The copyright holder for this preprint (which was not peer-reviewed) is the author/funder. It is made available under a CC-BY-NC-ND 4.0 International license.
3
10
2
FABP4
SMARCA4
FGFR4
PITX2
10
1
TEK
CDK1 SMAD2 MAP3K7 CEBPA TRAF2 RELA RUNX2 CCND1 MYF5 BAX STAT3 LRP6 MAPK14 PIK3CD CASP9 AKT1 SMAD3TP53 CDKN1A KIT SMAD4 CASP3 AXIN1 PPARG CTNNB1 LEF1 NOTCH1 MYOD1 PIK3CB
0
10 0 10
10
SIGNOR CHEIRANK
10
3
10
2
PITX2
10
1
TEK
1
10
10
4
10
3
10
3
10
2
10
2
PTK6
1
BMP7 PDPK1
0
10 0 10
B)
10
1
Fig. 2.
ATM CDK2 CSNK2A1 MAPK3 PRKACA AKT1 MAPK1 CDK1 SRC
10
SIGNOR OUT
only in SIGNOR
CDK1MAP3K7 SMAD2 PRUNX2 IK3CA CCND1 MYF5CEBPA STAT3 BAX LRP6 MAPK14 AKT1 PIK3CD CASP9 SMAD3TP53 CDKN1A KIT SMAD4 CASP3 AXIN1 PPARG CTNNB1 LEF1 MYOD1 NOTCH1 PIK3CB
10 0 10
2
4
10
SMARCA4 FGFR4
FABP4
10
TWIST1 TNK2 TLR4
ANKRD30BL ROCK1P1
0
SIGNOR IN
A)
4
2
10
10
GM SIGNOR IN
TNK2 TLR4
TWIST1
1
3
PTK6
HOXB8 PRKAA1
10 0 10
only in GM12878 network
10
1
4
10
3
10
2
ANKRD30BL ROCK1P1 PI4KA
FABP4 PITX2
10
SMARCA4 FGFR4
1
10 0 10
2
BMP7
10
10
5
0
1
0
10
K562 SIGNOR PAGERANK
10
10
K562 SIGNOR CHEIRANK
4
GM SIGNOR PAGERANK
10
GM SIGNOR CHEIRANK
SIGNOR PAGERANK
J.Lages et al.: Google matrix analysis of causal cancer protein networks
10
2
GM SIGNOR OUT
YY1 PBX3 NRF1 CTCF SPI1 EBF1 REST GABPA
10
only in K562 network
10
4
10
3
10
2
CEBPA CDK1 SMAD2 MAPK8 PIK3CA TRAF2 MYF5MAP3K7 RUNX2 BAXSTAT3 LRP6 MAPK14 AKT1 PIK3CD SMAD4 CDKN1A CASP9 SMAD3TP53 KIT PPARG CASP3 TEK LEF1 AXIN1 CTNNB1 MYOD1 NOTCH1 PIK3CB
10
1
10
K562 SIGNOR IN
TNK2 TWIST1
TLR4
PTK6 BMP7
10
1
MAPK3 NFYB E2F6 MAPK1 GTF2B NRF1 YY1 EGR1 ZBTB7A GABPA
0
3
2
10 0 10
10
1
10
2
K562 SIGNOR OUT
10
3
in GM12878 and K562 networks
Dependence of PageRank (A) and CheiRank (B) on the in-degree and out-degree correspondingly, in three networks
The coloring of nodes corresponds to the description provided in the caption of the Figure 1.
In order to test this approach in the context of bio-
from a large multi-cancer study of tumoral transcriptomes,
logical networks, we've de�ned several protein sets, each
using Independent Component Analysis (ICA) method
of which contains a functionally related group of proteins.
[48,6]. Gene expression signatures obtained through sta-
However, the meaning of the functional proximity is dif-
tistical data analysis sometimes serve as a sca�old for re-
ferent in all cases.
constructing the topology of regulatory connections be-
We start with a de�nition of a biological pathway,
tween the corresponding proteins. Therefore, we consid-
which play one of the most central roles in all cancer
ered this set for determining direct and indirect connec-
types: AKT-mTOR pathway. It is a molecular cascade
tions between its members.
downstream of PI3K kinase which is important in regulat-
Third analyzed group of proteins is a set of known di-
ing the cell cycle and cell survival, controlling a number
rect targets of a transcriptional factor E2F1 which is cen-
of normal physiological processes, and being dysregulated
tral to regulation and progression through the cell cycle.
in many diseases including cancer. We take the de�nition
The member names of this set were manually extracted
of the AKT-mTOR pathway from the external pathway
from reading the molecular biology literature on the func-
database Atlas of Cancer Signaling Network (ACSN) [35],
tioning of cell cycle in order to reconstruct it as a bio-
based on manual mining of molecular biology publications,
chemical reaction diagram [9]. In this case, the challenge
so the de�nition of this subset of proteins can be called
is to understand what biological pathways can be directly
�knowledge-driven�.
regulated by E2F1, what are the possible direct and in-
Second analyzed subset is by contrast purely �datadriven� and corresponds to a particular gene expression
direct feedbacks to the regulation of E2F1 itself and how they are changing in cancer progression.
signature (set of genes), shown to be connected to cell pro-
All three subsets are central to the studied in this pa-
liferation in multiple cancer studies through data analysis.
per cancer progression and its in�uence on the structure
We used a particular de�nition of this signature coming
of biological networks. In all three cases, we roughly equi-
bioRxiv preprint first posted online Dec. 22, 2016; doi: http://dx.doi.org/10.1101/096362. The copyright holder for this preprint (which was not peer-reviewed) is the author/funder. It is made available under a CC-BY-NC-ND 4.0 International license.
J.Lages et al.: Google matrix analysis of causal cancer protein networks
6
TLR4 AKT1
NRAS ERBB4
PRKACA
PTEN KRAS
LMO2
TICAM1
IRAK4
MAP2K1
PIK3CB
ANGPT2
LYL1
PELI2
TBK1 IKBKE
STAT6
RIPK1
SQSTM1 IRF5
IKBKG
TRADD TNFRSF10A
TNF
HRAS PIK3AP1
MYD88
MAPK3 TAL1
ERBB3
TICAM2
TIRAP
LMO1
TEK
IRS1
IRAK1
ANGPT4
NCF1 IRF3 REL
FAS IKBKB
CASP8
ANGPT1
ITGB4
PELI1PELI3
ANGPTL1
TRAF6
RELA
STAT3
A) Fig. 3.
C)
B)
TAB3
AKT1
TAB2
TRAF2
MAP3K1
Several examples of network topologies, illustrating emergence of �creative elements� (de�ned here as proteins whose
PageRank or CheiRank can not be simply explained by the number of incoming or outgoing connections correspondingly). A and B) The size of the node is proportional to its PageRank value. C) The size of the protein is proportional to its CheiRank value. The color of proteins in all three panels re�ects the ratio between the number of incoming and outgoing edges. If the color is greenish then the protein is �importer� receiving more incoming regulations than having out-going edges. The reddish proteins are �exporters� regulating more proteins downstream than the number of incoming regulations.
1
PAGERANK LOGRATIO
ROCK1P1
0.5
SMARCB1
IRF1
FANK1 ANKRD30BL MALAT1 FAM100B DUSP2
MXI1 STAT1 CCNT2 CEBPB BRF2 THAP1 SIN3A TAL1 FOSL1STAT2 GATA2 EGR1 ZBTB7A NFYA MAFK JUN RDBP POLR3A
ZZZ3
SP2
0
GTF2B
ZEB1
REST
MEF2A
IRF3
PAX5 HOXB8 POU2F2
ZNF143 PBX3
CDC45 NFE2 NUP214 PTCRA ATF3 MAP3K8 TOP3B PPM1F PI4KA YDJC NBPF1 SNAP29
−0.5
−1 −3
−2
only in SIGNOR
−1
only in GM12878 network
0
CHEIRANK LOGRATIO
only in K562 network
1
2
3
in GM12878 and K562 networks
Fig. 4. Relative changes in the PageRank and CheiRank in cancer vs normal network. The abscissa is the decimal logarithm of the ratio
KK562 /KGM , where the subscript denotes in ∗ ∗ /KGM . For example, the KK562
logarithm of the ratio
which network the CheiRank is calculated. The ordinate is the decimal proteins in the right part of the plot such as MEF2A, ZNF143, ZEB1
are those whose CheiRank signi�cantly increased (i.e., the protein has less outgoing connections) in the �cancer network� K562 (which can be simply because the corresponding transcription factor is not present in K562 transcriptional network, as in the case of ZEB1, blue points in the plot).
librated the sizes of the protein sets, limiting them to ap-
connections might change accordingly to the changes in
proximately 50 proteins.
the global context created by the transcriptional network.
It happened that the direct interactions between the members of all three sets of proteins are described in SIG-
2.3.1 AKT-MTOR pathway
NOR pathway database, and not in the transcriptional networks. Therefore, one might consider that the wiring
From SIGNOR database, we've retrieved 138 direct regu-
of direct connections between the set members are not
latory connections between 63 proteins of AKT-mTOR
a�ected by the changes in the transcriptional program.
pathway. These direct connections formed a large con-
However, we further show that the structure of indirect
nected subnetwork containing the majority (43 proteins)
bioRxiv preprint first posted online Dec. 22, 2016; doi: http://dx.doi.org/10.1101/096362. The copyright holder for this preprint (which was not peer-reviewed) is the author/funder. It is made available under a CC-BY-NC-ND 4.0 International license.
J.Lages et al.: Google matrix analysis of causal cancer protein networks
7
Table 1. Table of enriched biological functional categories of proteins. The numbers signi�es the number of proteins whose ranks are signi�cantly changed. By bold those functional categories are highlighted which found enriched after �ltering out proteins not present in either cancer or normal transcriptional networks. In this case, two values for the number of proteins are shown separated by semicolon: one without �ltering and one after �ltering. Complete interactive version of this table is available at
http://www.ihes.fr/~zinovyev/googlomics/grn2016/rankchanges/.
Arrow up means that the corresponding rank decreases
(or, in other words, �improves�, rank value increases) in the cancer network (the proteins are more connected). Arrow down means the opposite: the corresponding rank �degrades� and the proteins become less connected in cancer. Change of
Number
Rank
of pro-
in
cancer
teins
Page↑
158;86
Selected enriched functional categories/signatures
GO:0004812: GO:0006412:
aminoacyl-tRNA ligase activity (8;4) translation (22;14)
GO:0005925: focal adhesion (11) Interactions: FBXO6 (22), ITGA4 (19), Cytoband :
22q11.21 (9 ;7)
CUL5(17 ;12)
V$E2F Q6 (9;6) Shprintzen syndrome (8;5)
Transcription factor binding site: Disease: Page↓
158;63
GO:0090544: BAF-type complex (5) GO:0016514: SWI/SNF complex (4) Mouse phenotype: abnormal bone marrow cell morphology/development (17) Pathway: REACTOME Cell Cycle (16), TNF-alpha/NF-kB Signaling Pathway (9) Interactions: ARID2 (6), DPF3 (5)
TMTCGCGANR UNKNOWN (14;8) core promoter binding (15;8) GO:0030097: hemopoiesis (25;9) GO:0034097: response to cytokine (22;8) GO:0045637: regulation of myeloid cell di�erentiation (11;5) GO:0000785: chromatin (21;7) Transcription factor binding site:
Chei↑
105;30
GO:0001047:
Mouse phenotype: abnormal bone marrow cell morphology/development (25) Mouse phenotype:
increased lymphocyte cell number (23;9)
Pathway: KEGG Transcriptional misregulation in cancer (12) Pathway: WikiPathways EGFR1 Signaling Pathway (10) Pathway: BIOCARTA MAPKinase Signaling Pathway (;5)
Chei↓
83;23
Interactions: EP300 (28;14), TBP ( 13;10), JUN (19 ;11) SP1 (18 ;10), CREBBP (25 ;11), HDAC1 (28 ;12) Co-expression : Genes up-regulated in MCF7 cells (breast cancer) after stimulation with EGF (7;6) Co-expression:Genes regulated by NF-kB in response to TNF (15;7) MicroRNA targets: hsa-miR-548m:PITA (11;7) Disease :Myeloid Leukemia (20;9) GO:0000975: regulatory region DNA binding (23;16) GO:0048534: hematopoietic or lymphoid organ development (17;9) GO:0000785: chromatin (14;9) Mouse phenotype: decreased thymocyte number (9;7) Mouse phenotype: increased apoptosis (19;10) Pathway: WikiPathways TGF-beta Receptor Signaling Pathway (8;6) Interactions: EP300 (23;10), RB1 (13;6) Disease: Adult T-Cell Lymphoma/Leukemia (13;7) Disease: B-Cell Lymphomas (16)
of the pathway members, and the rest was orphan nodes
the common signaling SIGNOR part and the speci�c tran-
not connected to any other.
scriptional network. The strength of the indirect regula-
No direct transcriptional regulatory connections was
tion can be evaluated by looking at its
Gqr
value.
found between the members of the pathway; hence, the structure of direct connections did not change in the �cancer� network with respect to the �normal� network.
For the �normal� network we found that the distribution of the corresponding
(GM )
Gqr
values contains essen-
We've computed indirect regulatory relations using the
tially close to zero values, with only some pointing to
reduced Google matrix approach as described in Materials
existence of indirect regulation. Thus, for an arbitrarily
and Methods section, separately for SIGNOR, the �nor-
chosen threshold
mal� and �cancer� global regulatory networks, combined
teractions, ten top of them are shown in Figure 5,A (in
Gqr > 0.01
one detects 50 indirect in-
bioRxiv preprint first posted online Dec. 22, 2016; doi: http://dx.doi.org/10.1101/096362. The copyright holder for this preprint (which was not peer-reviewed) is the author/funder. It is made available under a CC-BY-NC-ND 4.0 International license.
J.Lages et al.: Google matrix analysis of causal cancer protein networks
8
magenta color). These 50 indirect regulations connect 8
�normal" and �cancer" global regulatory networks, com-
more proteins into the large connected component.
bined the common signaling SIGNOR part and the spe-
It can be noticed that the pattern of the top indirect
ci�c transcriptional network. As before, we've found only
connections is highly non-random and forms two �hidden
a minor fraction of all pair-wise protein relations as can-
patwhays�, one pointing to CASP3 protein through BCL
didates for indirect interactions (only 32 from 2305 passed
proteins, and one connecting PRKA proteins to AKT1.
the threshold
Both hidden pathways have rather clear biological inter-
regulations inferred in the �normal" GM network. As be-
pretation. The hidden regulations also point out to the
fore, with indirect connections, it was possible to connect
important crosstalk between BCL2 and MAPK1, MAPK3
more proteins (43 out of 49). Thus, the most important
Gqr > 0.01). In Figure 6 we show all indirect
proteins, not represented by direct interactions inside AKT- indirect connection connects PCNA protein to the largest connected component of the network. PCNA (proliferat-
mTOR pathway. The �rst one can be related to the existence of apoptotic pathway in the global regulatory network, where BCL2 and BCL2L1 proteins play an important role. CASP3
ing cell nuclear antigen) protein is a key cell cycle protein important both for DNA replication and DNA repair. While comparing �cancer" and �normal" networks, un-
serves the �nal point of the apoptotic pathway, being the
like the previous example, we do not �nd new �emergent
main executor protein of the apoptotic process (the ex-
oncogenic" indirect interactions. Instead, we observed that
ecutor caspases take care of destroying the proteins of
several indirect interactions disappear in the �cancer" net-
the suicided cell and the cell itself ). In order to illustrate
work, namely three indirect regulations connecting STIL
how BCL proteins and CASP3 are connected through the
protein to CCNA2, CCNE1 and CDK1. STIL is a cyto-
global network, we've computed the shortest and the sec-
plasmic protein implicated in regulation of the mitotic
ond shortest oriented path between BLC2 and BCL2L1
spindle checkpoint, a regulatory pathway that monitors
proteins and CASP3 protein (Figure 5,B). It can be seen
chromosome segregation during cell division to ensure the
that these paths include the main players of the apop-
proper distribution of chromosomes to daughter cells. In-
totic machinery (XIAP,CASP9,DIABLO,CYCS). Second
terestingly, STIL protein was shown to be heavily dereg-
hidden pathway connects the subunits of AMP-activated
ulated in T-cell leukemias through genome modi�cations
protein kinase (AMPK), an important energy sensor pro-
leading to gene fusions. Disappearance of indirect connec-
tein, to AKT1. As a conclusion, one can state that the
tions between STIL and CDK1 can be interpreted as loos-
reduced Google matrix approach was able to point out
ening the control over several important cyclins (CCNA2
to biologically important and meaningful indirect connec-
and CCNE1) and the key cell cycle protein CDK1 in can-
tions between several AKT-mTOR pathway members.
cer. Consistently, we �nd that the PageRank of the afore-
In addition, we compared the inferred indirect interac-
mentioned cyclins increases (e.g., for the local subnetwork
GM KCCN A2 = 7
K562 KCCN A2 = 14)
tions in �normal� and �cancer� global networks. We found
PageRanks,
that there is a strong correlation between all three set
means that they are less regulated/controlled in cancer.
(GM )
(K562)
(SIGN OR)
and
which
(correlation coe�-
Several other proteins such as AURKA, AURKB, CHEK1,
cients are close to 0.998). All strong indirect interactions
BIRC5, CDC25B decreases their local PageRanks in can-
inferred using the �normal� GM network were also found in
cer which means they become more controlled. Interest-
�cancer" K562 network. However, in the �cancer� network
ingly, one of the direct targets of CDK1 kinase, protein
we found additional candidates for indirect interactions,
BUB1, becomes a new hub of the indirect interactions. In-
top ten of which are shown in Figure 5,A and Figure 5,C.
deed, this protein plays a central role in mitosis by phos-
It can be seen that such �emergent oncogenic� indirect
phorylating members of the mitotic checkpoint complex
interactions also underline existence of a �hidden� causal
and activating the spindle checkpoint.
of values
Gqr
, Gqr
, Gqr
relation between RBX1 and MAPK1 proteins.
2.3.2 Data-driven signature of proliferation-related proteins
2.3.3 Set of transcriptional targets of E2F1 transcription factor
We analyzed a set of 49 proteins found in SIGNOR database whose expression was shown to signi�cantly change be-
In our last example, we use the reduced Google matrix
tween fast proliferative and slow proliferative tumors in 9
method in order to better understand the structure of
cancer types [6]. We found 47 direct interactions connect-
regulations of known in advance direct targets of a se-
ing them into one large connected component consisting
lected transcription factor E2F1, a key transcription fac-
of 31 proteins who were predominantly the phosphoryla-
tor regulating cell cycle progression. For 76 such proteins
tion targets of the cyclin-dependent kinase CDK1, so the
found in SIGNOR pathway database, we �nd 103 direct
structure of the network of direct interactions has a star-
interaction connecting these proteins into the connected
like structure organized around one large hub protein. As
component comprising 49 proteins. One additional direct
in the previous example, no direct transcriptional connec-
transcriptional regulation was found between MYC and
tions were found between the members of this protein set.
CBX5 proteins, but only in �cancer" K562 network.
We've computed indirect regulatory relations using the
The reduced Google matrix analysis revealed 84 indi-
Gqr > 0.01 in the case of the �normal"
reduced Google matrix approach as described in Mate-
rect regulations for
rials and Methods section, separately for SIGNOR, the
network (Figure 7,A), all of which were also present in the
bioRxiv preprint first posted online Dec. 22, 2016; doi: http://dx.doi.org/10.1101/096362. The copyright holder for this preprint (which was not peer-reviewed) is the author/funder. It is made available under a CC-BY-NC-ND 4.0 International license.
J.Lages et al.: Google matrix analysis of causal cancer protein networks
Fig. 5.
9
AKT-mTOR pathway reconstructed using SIGNOR database and by inferring indirect connections using reduced
Google matrix approach. A) Direct connections representing activator and inhibitor regulations are shown as red and green arrows correspondingly. Magenta color arrows shows the inferred indirect interactions which are common between the �normal� and �cancer� networks. Light blue color arrows represent those indirect interactions which are inferred only in the �cancer� network. Line width of the arrows representing the indirect interactions, is proportional to their
Gqr
score. Here only 10 top
scored indirect connections present in both �normal" and �cancer" networks and 10 top �emergent in cancer" connections are shown. The color of protein nodes re�ects the relative change in their local PageRanks in �cancer" vs �normal" networks. Red color means that the protein become better ranked in PageRank in the �cancer" network, and the green color means the opposite. The size of the node is proportional to the value of the PageRank in the SIGNOR network. B) Hidden cascade of indirect regulations connecting BCL2 and BCL2L1 proteins with CASP3. The proteins shown with grey labels are those which are not present in the de�nition of AKT-mTOR pathway. C) Cascade of hidden interactions emerging in the �cancer" network and not present in �normal" network.
bioRxiv preprint first posted online Dec. 22, 2016; doi: http://dx.doi.org/10.1101/096362. The copyright holder for this preprint (which was not peer-reviewed) is the author/funder. It is made available under a CC-BY-NC-ND 4.0 International license.
J.Lages et al.: Google matrix analysis of causal cancer protein networks
10
STIL
MELK CDC25B
CDKN2C
PCNA CDC6 CCNA2
CCNE1
direct activation
CDK1
CDC7
direct inhibition
MCM2 ESPL1
DBF4
CHEK1 BLM
PTTG1 EZH2 FEN1 TOP2A BUB1B BUB1
PBK
KIF11 NUSAP1 BORA DNMT1 RRM2
hidden (indirect)
FOXM1
ECT2 RACGAP1 FBXO5
AURKB
hidden dissapearing in oncogenic network
CEP55
GPSM2 AURKA
NDC80
KIF2C CDCA3
CKAP2 KPNA2
BIRC5 CCNB1
TTK CDCA8
VRK1 DTL
FAM64A CDCA7 SPAG5
Fig. 6. Network of proteins shown to be related to cell proliferation by transcriptomic data analysis. The meaning of the node and edge colors is the same as in Figure 5 besides those regulations which disappear in �cancer" network compared to �normal" network (shown by interrupted line arrows).
�cancer" network. We did not �nd any additional indirect interactions from the analysis of the �cancer" network.
3 Materials and Methods 3.1 Google matrix construction and properties The Google matrix
The majority of strong indirect interactions pointed to the 3 key apoptosis proteins CASP9, CASP3 and APAF1 (apoptotic protease activating factor) whose local PageRanks decreased in the �cancer" network (which means they
elements
i
and CASP3. However, unlike AKT-mTOR example, we did not observe signi�cant changes of local PageRanks of BCL2 and BCL2L1. Overall, the reduced Google matrix analysis underlines existence of hidden indirect apoptotic program regulated by E2F1 (which is a known fact [5]).
of a directed network of
1 if a protein (node) j
Aij
N
nodes
which has
points to a protein (node)
and zero otherwise. Then the matrix elements of
G
take
the standard form [8,37]
Gij = αSij + (1 − α)/N ,
become more regulated). As in the AKT-mTOR example, we �nd indirect regulations between BCL2, BCL2L1
G
is constructed from the adjacency matrix
(1)
S is the matrix of MarkovP transitions with elements N Sij = Aij /kout (j), kout (j) = i=1 Aij 6= 0 being the node j out-degree (number of outgoing links) and with Sij = 1/N if j has no outgoing links (dangling node). Here 0 < α < 1 is the damping factor which for a random surfer determines the probability (1 − α) to jump to where
any node. The properties of spectrum and eigenstates of
G We also found that many weaker indirect interactions between the targets of E2F1 ends up on the E2F1 itself (Figure 7,B), also through a key G1/S cell cycle checkpoint protein CDKN1A (cyclin dependent kinase inhibitor 1A). Therefore, E2F1 itself can be regulated through a number of direct (3 in Figure 7,B) and even more indirect (4
have been discussed in detail for Wikipedia and other
directed networks (see e.g. [18]). The right eigenvectors
ψi (j)
of
G
are determined by
the equation:
X
Gjj 0 ψi (j 0 ) = λi ψi (j) .
(2)
j0
P (j) = ψi=0 (j) corresponds to λi=0 = 1 [8,37]. It has positive ele-
in Figure 7,B) feedback regulations. This observation can
The PageRank eigenvector
provide hints on the principles of organization of the cell
the largest eigenvalue
cycle transcriptional program.
ments which give a probability to �nd a random surfer on a
bioRxiv preprint first posted online Dec. 22, 2016; doi: http://dx.doi.org/10.1101/096362. The copyright holder for this preprint (which was not peer-reviewed) is the author/funder. It is made available under a CC-BY-NC-ND 4.0 International license.
J.Lages et al.: Google matrix analysis of causal cancer protein networks
FHIT
BMI1
FOXO3
HRK
TP53BP1 AURKB MCM3
AXIN2
CDKN2C
ATM DBF4 CHEK2
E2F2
FGFR2
MYC
CDKN1B
MELK
CDKN2A
EIF2AK2
11
SKP2
CCNA2
CBX5
CCNE1
CDK1
TP53
BRCA1
E2F1
RPA2
TK1
DNMT1
FOXO1 TOP2A RRM2
TP73 EZH2
CDC25A PMAIP1
RBBP8 BCL2L11
BIRC5
BCL2
PPARG CASP8
MCL1
CASP9
CDC6 TERT ACTG1
CDKN1A
CCNB1 PCNA
BBC3
CASP7
APAF1
CASP3
MCM7 CCND3 DUSP2
PFKFB3 MYB MYBL2
TOPBP1 MYCN GAB2
NRP1 NPAT CDCA7
PTGS2 PFKFB2
SIVA1
CDT1 UHRF1 ACTN4
WWOX
STMN1 RBL1
direct activation
A)
direct inhibition ATM
CDKN2C
hidden (indirect)
CHEK2 CDKN2A
CDK1 E2F1
B)
RBBP8
CDKN1A
Fig. 7. Network of targets of E2F1 transcription targets. The meaning of the node and edge colors is the same as in Figure 5. A) Complete network with a subset of 19 top scored indirect interactions is shown for and indirect (Gqr
> 0.01)
S
given node in the stationary long time limit of the Markov
of
process. All nodes can be ordered by a monotonically de-
independent of
B) Network of E2F1 direct
P (Ki ) with the highest probability at K is the PageRank index. Left eigen-
in case of a degeneracy) while other eigenvectors are
α
due to their orthogonality to the left
λ = 1 [37]. Thus all eigenvalues, exλ = 1, are multiplied by a factor α when replacing T S by G. In the following we use the notations ψL and ψR for left and right eigenvectors respectively (here T means
creasing probability
unit eigenvector for
K = 1.
cept
The index
Gqr > 0.05.
regulators of E2F1, showing multiple indirect feedback loops in the regulation of E2F1 itself.
vectors are biorthogonal to right eigenvectors of di�erent eigenvalues. The left eigenvector for
λ = 1
has identical
(unit) entries due to the column sum normalization of One can show that the damping factor
α
G.
in (1) only af-
fects the PageRank vector (or other eigenvectors for
λ=1
vector or matrix transposition). In many real networks the number of nonzero elements in a column of
S
is signi�cantly smaller than the whole
bioRxiv preprint first posted online Dec. 22, 2016; doi: http://dx.doi.org/10.1101/096362. The copyright holder for this preprint (which was not peer-reviewed) is the author/funder. It is made available under a CC-BY-NC-ND 4.0 International license.
J.Lages et al.: Google matrix analysis of causal cancer protein networks
12
1
10-2
1
(a)
0.5
0.5
0
0
(b)
150
120
ξi
90
60
-0.5
30
P,P*
λ -1 -1 150
10-3
-0.5
0
0.5
λ -1 -1
1
150
(c)
90
90
0
0.5
1
1
(d) 1000
100
ξi
120
ξi
120
-0.5
60
60
30
30
i index
-0.5
10
1
1
1
2
10
10
K,K Fig. 8.
0 -1
3
Fig. 9. matrices
PageRank probability P (red points) and CheiRank P ∗ (green points) as a function of K and K ∗ in-
probability
dexes, calculated for SIGNOR molecular interaction database. Straight dashed lines are drawn to adapt an eye and show algebraic decay with exponents
−0.5
and
−1.
Here
0
0.5
0 -1
1
α = 0.85.
that allows to �nd e�ciently the PageRank
Also a certain number of largest eigenvalues (in modulus)
1
SIGNOR molecular interaction database. Colors give the in-
ξi from ξi = 1 (black) to ξi = 150 (bright yellow). (c,d) Inverse participation ratio ξi = �P � P N 4 2 / N n=1 |ψi (n)| of the ith eigenvector as a n=1 |ψi (n)|
verse participation ratio
function of
vector by the PageRank algorithm of power iterations [37].
0.5
(a,b) Complex spectrum {λi }i=0,...,N −1 of Google G (a) and G∗ (b) at α = 0.85, computed for
Re (λi )
for Google matrices
by decreasing modulus; from
N
0
Re(λi)
ors give in logarithmic scale
matrix size
-0.5
Re(λi)
10
*
-0.5
G
(c) and
G∗
(d). Col-
i indexes of eigenvalues ranked i = 1 (black) to i = N = 2432
(bright yellow). Quasi-uniform picture of the spectrum re�ects inexistence of weak protein node communities in the SIGNOR network.
and related eigenvectors can be e�ciently computed by the Arnoldi algorithm (see [18] and Refs. therein). In addition to the matrix a Google matrix
G∗
G
it is useful to introduce
constructed from the adjacency ma-
trix of the same network but with inverted direction of all links. The statistical properties of the eigenvector
G∗
with the largest eigenvalue
λ = 1
P∗
of
have been studied
�rst for the Linux Kernel network [13] showing that there are nontrivial correlations between
P
and
P∗
what are the meanings of these communities. Thus other methods are required to determine e�ective interactions between
Nr
nodes of a speci�c subset (group) of the global
network of a large size
N � Nr .
vectors of
the network. More detailed studied have been done for
In this work we apply the Google matrix analysis to
P ∗ (K ∗ )
the directed network of protein interactions from the can-
is called the CheiRank vector and the index numbering
cer database SIGNOR [42], and two hybrid networks, con-
Wikipedia and other networks [18]. The vector
nodes in order of monotonic decrease of probability is noted as CheiRank index
K ∗.
P∗
Thus, nodes with many
structed by merging SIGNOR to two transcriptional networks measured in normal blood cells and in cancer (leukemia).
K = 1, 2, 3... and nodes ∗ with many outgoing links have K = 1, 2, 3, ... [37,18]. Ex-
The SIGNOR directed network contains
amples of density distributions for Wikipedia editions and
In all our analysis we use the typical damping factor value
other directed networks are given in [18]. It is also useful
α = 0.85
ingoing links have small value of
to use 2DRank index
[37].
which represents a certain com-
K, K ∗
For the studied protein networks the dependencies of
values appearing �rst on a sequence of squares which have
PageRank and CheiRank probabilities on rank indexes are
bination of
K, K ∗
K2
N = 2432 proN` = 6569.
teins (nodes) with the total number of links
indexes (K2 is the sequence of
K = K ∗ = 1 with size increasing one by one to maximal N value, see details in [18]). At α < 1 only the PageRank vector have λ = 1 while other eigenvectors of G have |λ| ≤ α [37,18]. For
left corner at
shown in Figure 8. The decay of probabilities is approxi-
up
mately described by a power law
all
Wikipedia is was shown that the eigenvectors with a large modulus of
λ select some speci�c communities of Wikipedia
network [18]. However, a priory it is not possible to know
with the decay exponent
β
in a
P ∝ 1/K β ; P ∗ ∝ 1/K ∗ β range 0.5 − 1. However,
this is only an approximation for a whole curve. The distribution on nodes on the PageRank-CheiRank plane is shown in Figure 1. The spectra of Figure 9.
G
and
G∗
are shown in
bioRxiv preprint first posted online Dec. 22, 2016; doi: http://dx.doi.org/10.1101/096362. The copyright holder for this preprint (which was not peer-reviewed) is the author/funder. It is made available under a CC-BY-NC-ND 4.0 International license.
J.Lages et al.: Google matrix analysis of causal cancer protein networks
3.2 Reduced Google matrix
We denote the PageRank vector of the full network as
� P =
Recently, the method of reduced Google matrix has been proposed for analysis of e�ective interactions between nodes of a selected subset embedded into a large size network [19]. This approach uses parallels with the quantum scattering theory, developed for processes in nuclear and mesoscopic physics and quantum chaos. It turns out that the Google matrix
is the right eigenvector of
GR matrix describ-
proteins given by the global
Gqr
Grr ,
a projector part
which is mainly imposed by the PageRank of selected
G
matrix and a component
from hidden interactions between proteins which ap-
pear due to indirect links via the global network. Thus the reduced matrix
� (4)
G P = P or in other words P G for the unit eigenvalue. This
eigenvalue equation reads in block notations:
(1 − Grr ) Pr − Grs Ps = 0, −Gsr Pr + (1 − Gss ) Ps = 0.
of three matrix components which describe the direct interactions between group members,
Pr Ps
which satis�es the equation
ing the interactions inside a group of proteins is composed
Gpr
13
(5) (6)
1 is a unit diagonal matrix of corresponding size Nr Ns . Assuming that the matrix 1 − Gss is not singular, i.e. all eigenvalues Gss are strictly smaller than unity (in
Here or
modulus), we obtain from (6) that
Ps = (1 − Gss )−1 Gsr Pr
GR = Grr +Gpr +Gqr allows to obtain pre-
(7)
cise information about the group of proteins taking into account their environment given by the global network. The concept of reduced Google matrix
GR
was intro-
duced in [19] on the basis of the following observation. At present directed networks of real systems can be very large (about
4.2
millions for the English Wikipedia edition in
2013 [18] or
3.5
billion web pages for a publicly accessible
web crawl that was gathered by the Common Crawl Foundation in 2012 [38]). In certain cases one may be interested in the particular interactions among a small reduced sub-
Nr
set of
nodes with
Nr � N
instead of the interactions
in the entire network. However, the interactions between these
Nr
nodes should be correctly determined taking into
account that there are many indirect links between the nodes via all other
Ns = N − Nr
Nr
nodes of the network.
This leads to the problem of the reduced Google matrix
GR
with
subset of
Nr Nr
nodes which describes the interactions of a nodes.
which gives together with (5):
GR Pr = Pr
GR = Grr + Grs (1 − Gss )−1 Gsr
,
GR
where the matrix
of size
Nr × Nr ,
(8)
de�ned for the
reduced network, can be viewed as an e�ective reduced Google matrix. Here the contribution of
Grr
accounts for
direct links in the reduced network and the second term with the matrix inverse corresponds to all contributions of indirect links of arbitrary order. We note that in mesoscopic scattering problems one typically uses an expression of the scattering matrix which has a similar structure where the scattering channels correspond to the reduced network and the states inside the scattering domain to the scattering network [4]. The matrix elements of
GR
are non-negative since the
matrix inverse in (8) can be expanded as:
In a certain sense we can trace parallels with the prob-
(1 − Gss )−1 =
lem of quantum scattering appearing in nuclear and mesoscopic physics [44,4,28] and quantum chaotic scattering
∞ X
l Gss .
(9)
l=0
[24]. Indeed, in the scattering problem there are e�ec-
l
tive interactions between open channels to localized basis
In (9) the integer
states in a well con�ned scattering domain where a par-
i. e. the number of indirect links which are used to connect
ticle can spend a certain time before its escape to open
indirectly two nodes of the reduced network. The matrix
channels. Having this analogy in mind we construct the
inverse corresponds to an exact resummation of all orders
reduced Google matrix between selected
Nr
GR
which describes interactions
nodes and satis�es the standard re-
Let
G
be a typical Google matrix of Perron-Frobenius
Gij ≥ 0 and the column sum normalization G = 1 are veri�ed. ij i=1 We consider a sub-network with Nr < N nodes, called �reduced network�. In this case we can write G in a block N
of indirect links. According to (9) the matrix and therefore also
GR
It can be shown that
quirements of the Google matrix. type for a network with
represents the order of indirect links,
nodes such that
PN
form :
GR
G=
Grr Grs Gsr Gss
� (3)
The results obtained in [19,20] show that the reduced Google matrix can be presented as a sum of three components
GR = Grr + Gpr + Gqr , ements of
Ns = N − Nr
G
Grr
Gpr
(10)
given by direct matrix el-
among the selected
projector component
Nr
nodes, the second
is given by
T Gpr = Grs Pc Gsr /(1 − λc ), Pc = ψR ψL .
where the index � r � refers to the nodes of the reduced network and � s� to the other
also ful�lls the condition of col-
umn sum normalization being unity [19].
with the �rst component
�
(1 − Gss )−1
have non-negative matrix elements.
(11)
nodes which form
λc
a complementary network which we will call �scattering
Here
is the leading eigenvalue and by
network�.
corresponding right (left) eigenvector such
T ψR (ψL ) the that Gss ψR =
bioRxiv preprint first posted online Dec. 22, 2016; doi: http://dx.doi.org/10.1101/096362. The copyright holder for this preprint (which was not peer-reviewed) is the author/funder. It is made available under a CC-BY-NC-ND 4.0 International license.
J.Lages et al.: Google matrix analysis of causal cancer protein networks
14
T T ψL Gss = λc ψL ). Both left and right eigenvectors as well as λc can be e�ciently computed by the power
bility of the global network concentrated on the subset of
iteration method in a similar way as the standard PageR-
The results obtained here and in [20] for the Wikipedia
λ c ψR
(or
ank method. We note that one can easily show that
λc
Nr
selected nodes.
network show that the contribution of
GR
Gpr
is dominant
must be real and that both left/right eigenvectors can be
in
chosen with positive elements. Concerning the normaliza-
columns. Therefore the two small contributions of
ψR we choose EsT ψR = 1 and for ψL we choose T ψL ψR = 1 (the vector EsT has all elements being unity). T It is well known (and easy to show) that ψL is orthogonal to all other right eigenvectors (and ψR is orthogonal to all other left eigenvectors) of Gss with eigenvalues di�erT ent from λc . Here we introduce the operator Pc = ψR ψL which is the projector onto the eigenspace of λc and we denote by Qc = 1 − Pc the complementary projector. One
Gqr
veri�es directly that both projectors commute with the
Gqr is composed of two parts Gqr = Gqrd +Gqrnd where the �rst diagonal term Gqrd represents a probability to stay ¯ ss in (12) on the same node during multiple iterations of G while the second nondiagonal term Gqrnd represents indirect (hidden) links between the Nr nodes appearing due
tion for
Pc Gss = Gss Pc = λc Pc . We mention that this contribution is of the form Gpr = T T T ψ˜R ψ˜L /(1 − λc ) with ψ˜R = Grs ψR and ψ˜L = ψL Gsr being
matrix
Gss
and in particular
two small vectors de�ned on the reduced space of dimension
Nr .
Therefore
Gpr
is indeed a (small) matrix of rank
one which is also con�rmed by a numerical diagonalization of this matrix. The third component
Gqr
of indirect
or hidden links is given by
Gqr = Grs [Qc
∞ X
Grr
and
are indeed very important for the interpretation even
though they only contribute weakly to the overall column sum normalization. The meaning of
Grr
is rather clear since is gives direct
links between the selected nodes. In contrast, the meaning of
Gqr
is signi�cantly more interesting since it generates
indirect links between the
Nr
nodes due to their interac-
tions with the global network environment. We note that
via the global network. We note that in principle certain matrix elements of
Gqr
can be negative, which is possible
due to negative terms in
Qc = 1 − Pc
appearing in (12).
However, for all subsets considered in this work the total weight of negative elements was negligibly small (at most some
l ¯ ss G ]Gsr ,
but it is also kind of trivial with nearly identical
¯ ss = Qc Gss Qc . Qc = 1−Pc , G
l=0 (12) Even though the decomposition (10) is at �rst motivated by the numerical e�ciency to evaluate the matrix inverse it is equally important concerning the interpretation of the di�erent terms and especially the last contri-
10−3 )
of the total weight
1
for
GR ).
It is convenient to characterize the strength of 3 com-
Wrr , Wpr , Wqr given respectively by the sum of all matrix elements of Grr , Gpr , Gqr divided by Nr . By de�nition we have Wrr + Wpr + Wqr = 1. All numerical data of the reduced ponents in (10) by their respective weights
Google matrix of groups of proteins considered here are publicly available at the web site [49].
bution (12) which is typically rather small as compared to (11) plays in an important role as we will see below. Concerning the numerical algorithm to evaluate all
3.3 Global network reconstruction for GM12878 and K562 cell lines
contributions in (10), we mention that we �rst determine by the power iteration method the leading left right eigenvector
ψR
of the matrix
Gss
ψL
and
The transcriptional networks for normal GM12878 and
which also pro-
cancer K562 cell lines were obtained from the web-site
vides an accurate value of the corresponding eigenvalue or better of
1−λc
λc
(by taking the norm of the projection of
http://encodenets.gersteinlab.org/
(�les enets7.K562_proximal_�ltered_network.txt,
GψR on the reduced space which is highly accurate even for λc close to 1). These two vectors provide directly Gpr by (11) and allow to numerically apply the projector Qc to an arbitrary vector (with ∼ N operations). The most
enets8.GM_proximal_�ltered_network.txt) accompany-
expensive part is the evaluation of the last contribution
scriptional and SIGNOR networks were represented as
according to (12). For this we apply successively
Gss
ing the original publication [25]. SIGNOR network for H.Sapiens was downloaded from the SIGNOR web-site
http://signor.uniroma2.it/downloads.php. Both tran-
and
simple interaction format (SIF) �les and merged by sim-
which can be done by a
ple concatenation. They were further processed in in Cy-
sparse matrix vector multiplication or the e�cient appli-
toscape [14] with use of BiNoM plugin [47,7] for �nding
cation of the projector. We compute simultaneously the
shortest and second shortest paths, and copy-paste oper-
series in (12) which converges rather quickly after about
ations.
Qc
to an arbitrary column of
Gsr
200
terms since the contribution of the leading eigenvalue
(of
Gss )
has been taken out and the eigenvalues of
are roughly below the damping factor
α = 0.85.
end the resulting vector is multiplied with the matrix which provides one column of
Gqr .
Grs
3.4 De�nitions of functionally related groups of proteins
This procedure has to
Nr
The composition of AKT-mTOR pathway and the set of
is typically rather modest. We also note that the results
direct transcriptional targets of E2F1 protein were down-
obtained in [20] show that an approximate relation holds:
loaded from the Atlas of Cancer Signaling Network (ACSN)
1 − λc ≈ ΣP = kPr k1
database [ ], by using GMT �les of version 1.1 available
be repeated for each of the
Nr
¯ ss G
In the
where
columns but the number
ΣP
is the PageRank proba-
?
bioRxiv preprint first posted online Dec. 22, 2016; doi: http://dx.doi.org/10.1101/096362. The copyright holder for this preprint (which was not peer-reviewed) is the author/funder. It is made available under a CC-BY-NC-ND 4.0 International license.
J.Lages et al.: Google matrix analysis of causal cancer protein networks
from the ACSN web-site
http://acsn.curie.fr (sets E2F1-the
TARGETS and AKT-mTOR gene sets).
15
studied phenomenon (i.e., regulation of programmed
cell death). In the current methodologies, the number of
The group of proteins related to proliferation was de-
such model elements (proteins) can not be very large.
termined as a set of 50 gene names top-contributing to
Therefore, there is always a danger of neglecting impor-
the transcriptomic signature associated to the cell cycle
tant indirect causal relations between the elements via
through a large-scale pan-cancer analysis of transcriptomic
regulations passing through the global network in which
data [6], using the lists provided in the Supplementary in-
a given pathway is embedded. The reduced Google ma-
formation.
trix method allows systematically inferring indirect regulations, in a context-speci�c manner which allows to use in
4 Discussion
this analysis the results of high-throughput biotechnologies, as it is demonstrated in the current study. Note that indirect regulations can involve too many
The results of application of high-throughput technologies
proteins in order to characterize them by ad hoc meth-
in modern molecular biology are more and more frequently
ods such as counting the number of paths connecting two
presented in the form of complex networks, representing
proteins. The suggested method takes into account the
measured causal relations between biological molecules.
directed network in its whole complexity without naive
For example, systematic application of Chip-Seq technol-
simplifying assumptions. Moreover, the method is compu-
ogy for a signi�cant number of transcription factors can
tationally e�cient for the typical sizes of the biological
result in the global cell line-speci�c reconstruction of the
networks involving tens of thousands of nodes and hun-
transcriptional network [25]. Despite many methods aimed
dreds of thousands of interactions.
at the analysis of complex networks, there is still a need
Google matrix, or Googlomics, methodology can be
for mathematically rigorous and computationally e�cient
used in other types of directed networks appearing in bi-
methods able to quantify complex non-local network topolo- ology such as state transition graphs resulting from the gies, especially in the case of directed networks.
analysis of Boolean models of pathways [1].
In this work we show that the global Google matrix
Overall, the developed methodology allows combining
and the reduced Google matrix approaches represent use-
global structural analysis of large biological networks char-
ful tools for the analysis of directed interaction networks
acterized by context-speci�c and dynamical re-wiring to-
in biology.
gether with the focused analysis of speci�ed biological pro-
We show that the global analysis of a directed biolog-
cesses, without neglecting the role of the global context.
ical network using Google matrix and by computing node PageRanks and CheiRanks and their relative changes in cancer allows obtaining insights about speci�c and precise aspects of how the biological network topology evolve in di�erent biological contexts. The reduced Google matrix approach is a novel method allowing quantifying indirect (hidden) connections between members of a speci�ed subset of network nodes. These
5 Acknowledgements This research is supported in part by the MASTODONS2016 CNRS project APLIGOOGLE (see http://www.quantware.ups-tlse.fr/APLIGOOGLE/ ).
connections represent paths of oriented graph edges through the global network and involving nodes outside the speci�ed set. This approach is applied to the global network of
References
directed protein-protein interactions, with a focus on some groups of proteins corresponding to a well-de�ned biological function (cell survival signaling, cell proliferation), obtained by di�erent methods (prior knowledge-based or by data-driven approaches). We show that application of the reduced Google matrix approach leads to inferring a meaningful set of indirect interactions highlighting existence of speci�c biological programs not re�ected in the structure of direct relations between the members of a protein set. We also show that the structure of such hidden relations can be modi�ed from one condition to another, re�ecting some global changes in the wiring of, for example, global transcriptional networks during cancer or di�erentiation. There are multiple possible ways to exploit the methods suggested in this study. One of the promising ap-
1. W. Abou-Jaoudé, P. Traynard, P.T. Monteiro, J. SaezRodriguez, T. Helikar, D. Thie�ry, C. Chaouiya. Logical
Modeling and Dynamical Analysis of Cellular Networks. Front Genet.
7:94 (2016)
2. L. Albergante, J. Blow, T.J. Newman Bu�ered Qualitative
Stability explains the robustness and evolvability of transcriptional networks Elife
3:e02863 (2014)
3. E. Barillot, L. Calzone, P.Hupe, J.-P. Vert and A. Zinovyev. Computational systems biology of cancer, CRC Press, 2012. 4. C.W.J. Beenakker,
Random-matrix theory of quantum
transport, Rev. Mod. Phys.
69, 731 (1997)
5. L.A. Bell, J. O'Prey, K.M. Ryan. DNA-binding indepen-
dent cell death from a minimal proapoptotic region of E2F1. Oncogene
25(41):5656-63 (2006).
plication is in mathematical modeling of biological pro-
6. A. Biton, I. Bernard-Pierrot, Y. Lou, C. Krucker, E. Cha-
cesses, i.e. mathematical modeling of molecular pathways
peaublanc, C. Rubio-Pérez, N. López-Bigas, A. Kamoun,
[10,27,15,41]. Construction of a mathematical model of a
Y. Neuzillet, P. Gestraud, L. Grieco, S. Rebouissou, A. de
pathway usually starts with de�ning the restrictive set of
Reyniès, S. Benhamou, T. Lebret, J. Southgate, E. Bar-
biological molecules or processes most closely related to
illot, Y. Allory, A. Zinovyev, F. Radvanyi. Independent
bioRxiv preprint first posted online Dec. 22, 2016; doi: http://dx.doi.org/10.1101/096362. The copyright holder for this preprint (which was not peer-reviewed) is the author/funder. It is made available under a CC-BY-NC-ND 4.0 International license.
J.Lages et al.: Google matrix analysis of causal cancer protein networks
16
component analysis uncovers the landscape of the bladder
23. M.
Garber,
tumor transcriptome and reveals insights into luminal and
A.
Thielke,
M.
basal subtypes. Cell Rep.
N.
Chevrier,
Z.
9(4):1235�1245 (2014)
N.
Yosef,
A.
Goren,
Guttman, Itzhaki,
J.
R.
R.
Raychowdhury,
Robinson,
B.
Blecher-Gonen,
Minie,
C.
Born-
7. E. Bonnet, L. Calzone, D. Rovera, G. Stoll, E. Barillot and
stein, D. Amann-Zalcenstein, A. Weiner, D. Friedrich,
A. Zinovyev BiNoM 2.0, a Cytoscape plugin for accessing
J. Meldrim, O. Ram, C. Cheng, A. Gnirke, S. Fisher,
and analyzing pathways using standard systems biology for-
N. Friedman, B. Wong, B.E. Bernstein, C. Nusbaum,
mats BMC Systems Biology :18, (2013) 8. S. Brin and L. Page, The anatomy of a large-scale hyper-
N. Hacohen, A. Regev, I. Amit. A high-throughput chro-
7
matin immunoprecipitation approach reveals principles of
textual Web search engine, Computer Networks and ISDN
dynamic gene regulation in mammals. Mol Cell.
Systems
22 (2012).
30, 107 (1998)
9. L. Calzone, A. Gelay, A. Zinovyev, F. Radvanyi, E. Barillot. A comprehensive modular map of molecular interac-
tions in RB/E2F pathway. Mol Syst Biol.
4:173 (2008)
10. L. Calzone, L. Tournier, S. Fourquet, D. Thie�ry, B. Zhivotovsky, E. Barillot, A. Zinovyev. Mathematical modelling
of cell-fate decision in response to death receptor engagement. PLoS Comput Biol
5;6(3):e1000702, (2010)
11. J. Chen, E.E. Bardes, B.J. Aronow, A.G. Jegga. ToppGene
Suite for gene list enrichment analysis and candidate gene prioritization. Nucleic Acids Research
37(suppl 2):W305-
W311 (2009) 12. L. Chindelevitch, D. Ziemek, A. Enayetallah, R. Randhawa, B. Sidders, C. Brockel and E.S. Huang. Causal rea-
soning on biological networks: interpreting transcriptional changes Bioinformatics
288, 1114�1121 (2012)
13. A.D. Chepelianskii, Towards physical laws for software arCline,
M.
Smoot,
E.
Cerami,
24. P. Gaspard, Quantum chaotic scattering, Scholarpedia
9(6), 9806 (2014)
25. MB Gerstein, A Kundaje, M Hariharan et al. Architecture
of the human regulatory network derived from ENCODE data Nature
489, 91-100 (2012).
26. G. Giordano, C. C. Samaniego, E. Franco and· F. Blanchini. Computing the structural in�uence matrix for bio-
logical systems J. Math. Biol.
72(7),1927�1958 (2015)
27. L. Grieco, L. Calzone, I. Bernard-Pierrot, F. Radvanyi, B. Kahn-Perles, D. Thie�ry. Integrative modelling of the
in�uence of MAPK network on cancer cell fate decision.
9, e1003286 (2013)
PLoS Comput. Biol.
28. T. Guhr, A. Müller-Groeling and H.A. Weidenmüller, Ran-
dom Matrix Theories in Quantum Physics: Common Concepts, Phys. Rep.
299, 189 (1998)
29. M. Hofree, J.P. Shen, H. Carter, A. Gross, T. Ideker,
chitecture, arXiv:1003.5455 [cs.SE] (2010) 14. M.S.
47(5):810-
A.
Kuchinsky,
N. Landys, C. Workman, R. Christmas, I. Avila-Campilo, M. Creech, B. Gross, K. Hanspers, R. Isserlin, R. Kelley, S. Killcoyne, S. Lotia, S. Maere, J. Morris, K. Ono, V. Pavlovic, A.R. Pico, A. Vailaya, P.L. Wang, A. Adler, B.R. Conklin, L. Hood, M. Kuiper, C. Sander, I. Schmule-
Network-based strati�cation of tumor mutations Nat Methods
1011, 1108�1115 (2013)
30. H. Jeong, S.P. Mason, A.-L. Barabási and Z.N. Oltvai.
Nature,
Lethality and centrality in protein networks.
411:41�42 (2001).
31. S. Köhler, S. Bauer, D. Horn, P.N. Robinson. Walking the
vich, B. Schwikowski, G.J. Warner, T. Ideker, G.D. Bader.
interactome for prioritization of candidate disease genes.
Integration of biological networks and gene expression data
Am. J. Hum. Genet.
using Cytoscape. Nat Protoc.
2(10):2366�2382 (2007)
82, 949�958, (2008)
32. K. Komurov, M.A. White, P.T. Ram Use of Data-Biased
15. P.A.D. Cohen, L. Martignetti, S. Robine, E. Barillot, A. Zi-
Random Walks on Graphs for the Retrieval of Context-
novyev, L. Calzone. Mathematical Modelling of Molecular
Speci�c Networks from Genomic Data PLoS Computa-
Pathways Enabling Tumour Cell Invasion and Migration. PLoS Computational Biology
11:e1004571, (2015)
16. P. Csermely, T. Korcsmáros , H.J. Kiss , G. London, R. Nussinov. Structure and dynamics of molecular net-
works: a novel paradigm of drug discovery: a comprehensive review. Pharmacol Ther. 17. Q.
Cui,
Y.
Ma,
M.
138(3):333-408 (2013)
Jaramillo,
H.
Bari,
A.
Awan,
S. Yang, S. Zhang, L. Liu, M. Lu, M. O'Connor-McCourt, E.O. Purisima, E. Wang. A map of human cancer signal-
ing. Mol Syst Biol.
3:152 (2007)
18. L. Ermann, K.M. Frahm and D.L. Shepelyansky, Google
matrix analysis of directed networks, Rev. Mod. Phys.
87,
1261 (2015) 19. K.M. Frahm and D.L. Shepelyansky, Reduced Google ma-
trix, arXiv:1602.02394[physics.soc] (2016) 20. K.M. Frahm , K. Ja�rès-Runser and D.L. Shepelyansky,
Wikipedia mining of hidden links between political leaders, Eur. Phys. J. B
89, 269 (2016)
21. K.M. Frahm, B. Georgeot and D.L. Shepelyansky, Univer-
sal emergence of PageRank, J. Phys. A: Math. Theor.
44,
465101 (2011) 22. D. Fazekas, M. Koltai, D. Türei, D. Módos, M. Pálfy, Z. Dúl, L. Zsákai, M. Szalay-Bek, K. Lenti, I.J. Farkas,
tional Biology 33. J.
6(8),e1000889 (2010)
Koschmann,
A.
Bhar,
P.
Stegmaier,
A.E.
Kel
and E. Wingender. �Upstream Analysis�: An Integrated
Promoter-Pathway Analysis Approach to Causal Interpretation of Microarray Data Microarrays
4, 270-286 (2015)
34. I. Kuperstein, L. Grieco, D.P. Cohen, D. Thie�ry, A. Zinovyev, E. Barillot. The shortest path is not the one you
know: application of biological network resources in precision oncology research. Mutagenesis 35. I.
Kuperstein,
E.
Bonnet,
H.A.
30(2), 191�204 (2015) Nguyen,
D.
Cohen,
E. Viara, L. Grieco, S. Fourquet, L. Calzone, C. Russo, M. Kondratova, M. Dutreix, E. Barillot, A. Zinovyev. Atlas
of Cancer Signalling Network: a systems biology resource for integrative analysis of cancer data with Google Maps. Oncogenesis
4:e160, (2015)
36. I. Lee, U.M. Blom, P.I. Wang, J.E. Shim, and E.M. Marcotte. Prioritizing candidate disease genes by network-
based boosting of genomewide association data. Genome Res.
21, 1109�1121 (2011)
37. A.M. Langville and C.D. Meyer, Google's PageRank and
beyond: the science of search engine rankings, Princeton University Press, Princeton (2006)
T. Vellai, P. Csermely, T. Korcsmáros. SignaLink 2 � a sig-
38. R. Meusel, S. Vigna, O. Lehmberg and C. Bizer, The graph
naling pathway resource with multi-layered regulatory net-
structure in the web - analyzed on di�erent aggregation
works. BMC Systems Biology
levels, J. Web Sci.
7(1):7 (2013)
1, 33 (2015)
bioRxiv preprint first posted online Dec. 22, 2016; doi: http://dx.doi.org/10.1101/096362. The copyright holder for this preprint (which was not peer-reviewed) is the author/funder. It is made available under a CC-BY-NC-ND 4.0 International license.
J.Lages et al.: Google matrix analysis of causal cancer protein networks
39. R. Pique-Regi, J.F. Degner, A.A. Pai, D.J. Ga�ney, Y. Gilad, J.K. Pritchard. Accurate inference of transcription
factor binding from DNA sequence and chromatin accessibility data. Genome Res.
21(3):447-55 (2011)
40. M.A. Pujana, J.D. Han, L.M. Starita, et al. (2007) Network
modeling links breast cancer susceptibility and centrosome dysfunction. Nat. Genet. 41. E.
Remy,
S.
39, 1338�1349 (2007)
Rebouissou,
C.
Chaouiya,
A.
Zinovyev,
F. Radvanyi, L. Calzone. A Modeling Approach to Explain
Mutually Exclusive and Co-Occurring Genetic Alterations in Bladder Tumorigenesis. Cancer Res.
75(19):4042�4052,
(2015) 42. L. Perfetto, L. Briganti, A. Calderone et al. SIGNOR: a
database of causal relationships between biological entities. Nucleic Acids Res. 43. F.
Rapaport,
44(D1):D548-54 (2016)
A.
Zinovyev,
M.
Dutreix,
E.
Barillot,
J.P. Vert. Classi�cation of microarray data using gene net-
works, BMC Bioinformatics
8:35 (2007)
44. V.V. Sokolov and V.G. Zelevinsky, Dynamics and statistics
of unstable quantum states, Nucl. Phys. A
504, 562 (1989)
45. O. Vanunu, O. Magger, E. Ruppin, T. Shlomi, R. Sharan. Associating genes and protein complexes with disease
via network propagation. PLoS Comput. Biol.
6, e1000641
(2010) 46. C. Winter, G. Kristiansen, S. Kersting, J. Roy, D. Aust, T.
Knösel,
P.
Rümmele,
B.
Jahnke,
V.
Hentrich,
F. Rückert, M. Niedergethmann, W. Weichert, M. Bahra, H.J.
Schlitt,
U.
Settmacher,
H.
Friess,
M.
Büchler,
H.D. Saeger, M. Schroeder, C. Pilarsky, R. Grützmann.
Google goes cancer: improving outcome prediction for cancer patients by network-based ranking of marker genes. PLoS Comput Biol.
8(5):e1002511. (2012)
47. A. Zinovyev, E. Viara, L. Calzone, E. Barillot. BiNoM: a
Cytoscape plugin for manipulating and analyzing biological networks. Bioinformatics
24(6):876�877 (2008)
48. A. Zinovyev, U. Kairov, T. Karpenyuk, E. Ramanculov.
Blind source separation methods for deconvolution of complex signals in cancer biology. Biochem Biophys Res Commun. 49.
430(3):1182�1187 (2013)
http://www.quantware.ups-tlse.fr/QWLIB/ googlomics/
17