Inferring Social Network User Profiles using a Partial Social Graph Ra¨ıssa Yapan Dougnon1 , Philippe Fournier-Viger2? , Jerry Chun-Wei Lin3 , and Roger Nkambou4 1
2
3
Dept. of Computer Science, Universit´e de Moncton, Moncton, Canada School of Natural Science and Humanities, Harbin Institute of Technology Shenzhen Graduate School, China School of Computer Science and Technology, Harbin Institute of Technology Shenzhen Graduate School, China 4 Dept. of Computer Science, Universit´e du quebec a ` Montr´eal
[email protected],
[email protected],
[email protected],
[email protected]
Abstract. User profile inference on online social networks is a key task for targeted advertising and building recommender systems that rely on social network data. However, current algorithms for user profiling suffer from one or more of the following limitations: (1) assuming that the full social graph or a large training set of crawled data is available for training, (2) not exploiting the rich information that is available in social networks such as group memberships and likes, (3) treating numeric attributes as nominal attributes, and (4) not assessing the certainty of their predictions. In this paper, to address these limitations, we propose an algorithm named Partial Graph Profile Inference+ (PGPI+). The PGPI+ algorithm can accurately infer user profiles under the constraint of a partial social graph. PGPI+ does not require training, and it lets the user select the trade-off between the amount of information to be crawled for inferring a user profile and the accuracy the inference. Besides, PGPI+ is designed to use rich information about users when available: user profiles, friendship links, group memberships, and the ”views” and ”likes” from social networks such as Facebook. Moreover, to also address limitations 3 and 4, PGPI+ considers numeric attributes in addition to nominal attributes, and can evaluate the certainty of its predictions. An experimental evaluation with 31,247 user profiles from the Facebook and Pokec social networks shows that PGPI+ predicts user profiles with a higher accuracy than several start-of-the-art algorithms, and by accessing (crawling) less information from the social graph. Furthermore, an interesting result is that some profile attributes such as the status (student/professor) and genre can be predicted with more than 95 % accuracy using PGPI+. Keywords: social networks, inference, user profiles, partial graph ?
Corresponding author
2
1
Dougnon, R. Y., Fournier-Viger, P., Lin, J.C.W., Nkambou, R.
Introduction
Online social networks have become extremely popular. Various types of social networks are used such as friendship networks (e.g. Facebook), professional networks (e.g. ResearchGate) and interest-based networks (e.g. Flickr). An important research problem for ad targeting [32] and building recommender systems [8, 21, 25, 31, 42] that relies on social network data is that users often disclose few information about themselves publicly [3, 18]. To address this issue, in the field of social network mining [4, 27], an important sub-field is now interested in developing algorithms to infer detailed user profiles using publicly disclosed information. Various approaches have been used for user profile inference such as relational Na¨ıve Bayes classifiers [20], label propagation [16, 19], majority voting [9], linear regression [18], Latent-Dirichlet Allocation [5] and community detection [22]. It was shown that these approaches can accurately predict hidden attributes of user profiles in many cases. However, all these approaches suffer from at least two of the following four limitations. 1. Assuming a full social graph. Many approaches assume that the full social graph or a large part of the graph has been crawled beforehand and is available for training user profile inference models (e.g. [16]). This is a convenient assumption used by researchers for testing algorithms using large public datasets. However, in real-life, the full social graph is generally unavailable (e.g. on Facebook, Twitter, LinkedIn and Google Plus) or may be very costly to obtain or update [5]. Moreover, even if the full social graph was successfully crawled to build a large training set, it may be unpractical to keep it up to date. The result is that several of these methods are inapplicable or provide poor accuracy if the full social graph cannot be crawled (see the experiment section of this paper). A few approaches does not assume access to the full social graph such as majority-voting [9]. However, this latter is limited to only exploring immediate neighbors of a node, and thus do not let the user control the trade-off between the number of nodes to be accessed (crawled) and prediction accuracy, which may lead to low accuracy. It is thus an important challenge to develop algorithms that let the user choose the best trade-off between the number of nodes to be accessed (crawled) and prediction accuracy. 2. Not using rich information. Several algorithms do not consider the rich information that is generally available on social networks. On one hand, several algorithms consider links between users and user attributes but do not consider other information such as group memberships, ”likes” and ”views” that are available on social networks such as Facebook and Twitter (e.g. [3, 9, 14, 16, 19, 20, 22]). On the other hand, several algorithms consider the similarity between user profiles and information such as ”likes” but not the links between users and other rich information (e.g. [5, 18, 26]). But exploiting more information may help to further increase accuracy. 3. Not handling numeric attributes. Many approaches treat numeric attributes (e.g. age) as nominal attributes by considering each numeric value
Inferring Social Network User Profiles
3
as a symbol [3, 9]. However, this approach provides poor accuracy because for some attributes, few users have exactly the same attribute value. For example, for the attribute ”weight”, few users may have the same weight, although they may have similar weights. Some approaches have been designed to handle numeric attributes but requires the full social graph or a large part of the social graph to be crawled and available for training, which is often unpractical [10, 16, 18, 22]. For example, linear regression [18] requires a large training set to be applied on high dimensional data. 4. Not assessing certainty. Another important limitation is that few approaches assess the certainty of their predictions. But this information is essential to determine if a prediction is reliable and actions should be taken based on the prediction [6]. For example, if there is a low certainty that a user profile attribute value is correctly inferred, it may be better not to use this attribute value as a basis for ad targeting. Otherwise, there may be a high risk that the ad is targeted at the wrong audience. In this paper, we address the above limitations. Our contributions are the following. 1. We propose a new algorithm named PGPI (Partial Graph Profile Inference) that can accurately infer user profiles without training and under the constraint of a partial graph (i.e. the assumption is that no data has been previously crawled for training, and that the full social graph cannot be crawled for performing a prediction). The algorithm is to our knowledge, the first algorithm that let the user select how many nodes of the social graph should be accessed (crawled) to infer a user profile. This let the user choose the best trade-off between accuracy versus number of nodes to be visited (crawled). This capability is very useful as in real-life as a user may not have the time, resources or necessary authorization to crawl the whole social graph or a large part of the social graph to infer a given user profile (it is for example well-known that many popular social networks implement security measures to prevent automated software from crawling their graph). An example use case of this algorithm is a private detective that wants to discover hidden attributes of a suspect. By using PGPI, a very small part of the social graph can be crawled to accurately infer the suspect’s user profile, without having to collect a large training dataset beforehand. 2. The proposed PGPI algorithm is composed of two procedures named PGPIN and PGPI-G. PGPI-N is designed to infer user profiles based on links between users, while PGPI-G consider group memberships, likes and views, when the information is available. One may use either PGPI-N, PGPI-G or the full PGPI algorithm, which combines the features of PGPI-N and PGPI-G. 3. We present an extended version of PGPI named PGPI+ to handle numeric attributes. It incorporates new mechanisms for predicting values of numeric attributes. Furthermore, it also introduce improvements to increase the overall prediction accuracy of PGPI.
4
Dougnon, R. Y., Fournier-Viger, P., Lin, J.C.W., Nkambou, R.
4. In PGPI+, we also introduce a mechanism to assess the certainty of predictions. PGPI+ can assess the certainty of predictions for both nominal and numeric attributes using respectively a simulation-based approach and a relative standard error based approach. This let the user choose to ignore predictions if the certainty is below a given threshold. 5. We report results from an extensive empirical evaluation to compare the performance of PGPI and PGPI+ with four other state-of-the-art algorithms, using 31,247 user profiles from the Facebook and Pokec social networks. Results show that the proposed PGPI+ algorithm can provide a considerably higher accuracy for both numeric and nominal attributes while accessing (crawling) a much smaller number of nodes from the social graph. Moreover, results show that the calculated certainty well assesses the reliability of predictions. Moreover, an interesting result is that profile attributes such as status (student/professor) and gender can be predicted with more than 95% accuracy using PGPI+. The rest of this paper is organized as follows. Section 2, 3, 4, 5, 6 and 7 respectively presents the related work, the problem definition, the proposed PGPI algorithm, the improved PGPI+ algorithm and the experimental evaluation and conclusion.
2
Related Work
The problem of user profiling in online social networks has emerged as an important research topic in social network mining [1–3, 5, 6, 9, 12–14, 16, 17, 19, 20, 22, 24, 26, 37–41]. It can be described as the problem of discovering private attribute values of one or more users based on public information such as links between users and location of their ”friends”. User profiling has many applications. Major applications are ad targeting systems [32] and recommender systems that relies that rely on social network data [8, 21, 25, 31, 42]. In this context, one may infer values of user attributes such as gender and age to then offer more targeted ads or recommendations to the users. The application of ad targeting is especially interesting given that more an more users are using mobile phones to access social networks, and that user profiling is a key aspect for mobile advertising [7, 34, 36, 35]. The next paragraphs of this section provide an overview of recent algorithms for user profiling on social networks. It also highlights some important limitations of these algorithms, that are movitation of this work. Davis Jr et al. [9] proposed an algorithm to infer the locations of Twitter users. It performs a majority vote over the locations of directly connected users. For example, the location of a user will be infered as ”New York” if most of his contacts on the social network are from ”New York. Although this approach was shown to provide good results, an important limitation of this approach is that a single attribute is considered. In other words, the authors did not generalize their approach for considering profiles consisting of multiple attributes.
Inferring Social Network User Profiles
5
In another recent work, Jurgens [16] predicted locations of Twitter/Foursquare users using a label propagation approach. The approach proposed by Jurgens is iterative. Initially, some nodes are labelled with their public attributes. Other nodes are unlabelled. Then, during an iteration, each unlabelled node is assigned the most popular label among its neighbors if it has labelled neighbors. The algorithm terminates when all nodes have been labelled. An important limitation of this work is that it requires the full social graph or at least a large part of the social graph since it propagates labels through links between nodes. Moreover, this work only considers a single attribute. Li et al. [19] proposed an iterative algorithm to deduce LinkedIn user profiles based on relation types. Similarly to the work of Jurgens, this algorithm also requires a large training set to discover relation types. An improved iterative algorithm was presented by Kong et al. [17] to infer attributes of users profiles by considering multiple attributes (multi-label classification). It was applied on social graphs from the DBLP and IMDB websites. However, this approach is also designed to operate on a large subset of the social graph, as it first requires to estimate probabilities, and then to propagate node labels through the graph. Wang et al. [37] also proposed an iterative algorithm to perform user profile inference using multiple attributes based on user profiles and social links. This algorithm is also designed to be applied on a large training set as it first applies K-means clustering on the training set, estimate probabilities, and iterate through all nodes for labeling. It was applied on data from DBLP, IMDB and Youtube. Mislove et al. [22] proposed a community detection based approach to infer the profiles of users on the Facebook social network based on links between users. The main idea is to first apply a community detection algorithm to detect the membership of users to communities. Then, this information is used to infer the profile of each user. A limitation of this work is that detecting communities requires a large training set or full social graph to be effective. Lindamood et al. [20] applied a Na¨ıve Bayes classifier on 167k Facebook profiles with friendship links. The approach consists of first using a training set of users to estimate conditional probabilities of the Na¨ıve Bayes classifier. Then, the classifier is used to infer the user profiles. It is interesting to note that in this study, it was concluded that if links or attributes are erased, accuracy of the approach can greatly decrease. This study thus highlights the challenges of performing accurate predictions using few data. Recently, Blenn et al. [3] utilized bird flocking, association rule mining and statistical analysis to infer user profiles in a dataset of 3 millions Hyves.nl users. However, all these approaches require a large training set. Moreover, these approaches do not use rich information to perform inference. They consider user profile information and social links to perform predictions, but not any other information. Chaabane et al. [5] inferred Facebook user profiles using Latent Dirichlet Allocation (LDA) and majority voting. The approach extracts a probabilistic model from music interests and additional information provided from Wikipedia.
6
Dougnon, R. Y., Fournier-Viger, P., Lin, J.C.W., Nkambou, R.
But it requires a large training set, which was difficult and time-consuming to obtain according to the authors [5]. Kosinski et al. [18] also utilized information about user preferences (Facebook ”likes”) to infer user profiles. The approach consists of building a matrix where rows/columns are users/likes. Then Singular Value Decomposition is applied to reduce the number of dimensions, and linear/logistic regression is applied to perform prediction. This work consider both numeric and nominal attributes. However, considerable limitations of this work are that it does not consider links between social network users and a very large training dataset is required to perform regression on high-dimensional data. Bi et al. [2] also proposed an approach to infer user profiles from user preferences (e.g. Facebook ”likes”). For each ”like” in the training set, a search query is sent to a search engine, and the top 10 results are collected. Then, results are categorized using an ontology, and a vector is created for each ”like” to store the number of times that it is associated to each category. Logistic regression is then performed on these vectors containing more than 200 dimensions, and the result is used to perform user profile inference. A limitation of this approach are that it requires a large training set to perform regression with such high-dimensional data. Furthermore, this approach does not consider social links on a social network, and is only designed for nominal attributes. Authors suggest to handle the numeric attribute ”age” as a nominal attribute by grouping its values into five very broad age groups (10-18, 19-24, 25-34, 35-49, and 50+ years old). Zhong et al. [41] inferred nominal attributes of user-profiles from location check-ins and customer reviews using a dataset of more than 100,000 user profiles from the Sina Weibo social network and reviews from the Dianping website. The approach build a multidimensional representation considering attributes of locations, space and time, and user profiles. Then, tensor reduction is applied for dimensionality reduction. Several techniques are then compared such as SVM, logistic regression, and linear regression to perform user profile inference. This approach can handle numeric attributes such as age. However, drawbacks of this approach is that it requires a large training set, and does not consider social relationships between users to perform inference. He et al.[14] proposed an approach consisting of building a Bayesian network based on the full social graph to then predict user attribute values. The approach considers similarity between user profiles and links between users to perform predictions, and was applied to data collected from LiveJournal. Recently, Dong et al. [10] used graphical-models to predict the age and gender of users. Their study was performed with a very large training set of 1 billion phone and SMS data and 7M user profiles. Chaudhari [6] also used graphical models to infer user profiles. The approach has shown high accuracy on datasets of more than 1M users. A limitation of these approaches however, it that they assume a large training set. Furthermore, they only consider user attributes and links but not additional information such as likes, views and group membership that are available on many social networks such as Facebook.
Inferring Social Network User Profiles
7
Zhao et al. [39] inferred topic of interests for Google+ users based on various types of information such as ”+1”, comments, and posts. The approach builds topic/user matrixes for various behaviors, then factorize them in a latent space, and then compute the similarity between users and items using this latent space to predict topics of interests for each user. This approach is interesting as it considers rich information. However, it does not infer basic user demographic data useful in domains such as ad targeting, and does not consider social links to perform prediction. Furthermore, this approach requires a quite large training set for training and does not consider numeric attributes. Bhattacharya et al. [1] presented an approach to infer topics of interests of single users in the Twitter social network, based on ”follow” links between users. The approach consists of first inferring the topical expertise of each user by checking the text descriptions of lists where the user appears. Then, a given user is said to have an interest in a topic if it follows at least three users having expertise on that topic. This approach requires a large training set and do not use profile information such as age and gender, to perform predictions. Zhao et al. [40] designed an approach to infer social roles or status of users (e.g. roles of actor, director, producer on IMDB). The approach applies an optimization framework and then perform label propagation using a probalistic model to infer roles and statuses of users based on social links. It was applied on IMDB and LinkedIn data. Limitations of this approach are that it is also designed for being used with a large training set, does not consider numeric attributes, was only applied for predicting a single attribute having few possible values, and do not consider rich information. Gong et al. [12] inferred user profile attributes on the Google + social network using a random walk approach by considering user profiles, social links, and potentially missing links between users. The proposed approach is iterative. At each iteration, top attributes are inferred for each social network node, and link prediction is performed to predict missing links between users. This approach requires a large training set and does not handle numeric attributes. Moreover, it only considers user profiles and links between users. Quercia et al. [26] developed an approach to predict the personality of Twitter users. The approach consists of training a decision tree using a large training sets of users tagged with their personality traits, and then use it to predict personality traits of other users. Although this approach was successful, it uses a very limited set of information to perform predictions: number of followers, number of persons followed, and list membership count. Huang et al. [13] studied the problem of inferring nationalities of Twitter users using rich information such as language, hashtags, geographical locations, profile pictures, and social links. A gradient boosted tree was used as classifier. Limitations of the approach is that a large dataset is used, and that is specially designed for predicting a single nominal attribute (nationalities). Pennacchiotti and Popescu [24] developed a user inference approach, applied to the Twitter social network, which considers rich information such as user profile, tweeting behavior (e.g. average number of tweets per day), network features,
8
Dougnon, R. Y., Fournier-Viger, P., Lin, J.C.W., Nkambou, R.
and text content. To analyse text content, a LDA model is trained with 500 iterations over a 4M users dataset. This approach thus requires a large training set. The approach has been applied to infer nominal attribute values (political affiliation, ethnicity, and fans of a coffee chain) but not numeric attributes. A similar approach has been proposed by Al Zamal et al. [38]. The approach based on SVM was applied to 400 Twitter users to predict both nominal (political orientation, gender) and numeric attributes (age). A user is described by a set of feature values and the average feature values in its neighborhood. Features include mainly text features such as top hashtags and top words. Some limitations of his work are that numeric attributes are treated as nominal attributes, and few user profile attributes have been considered. But more importantly, although a small set of nodes is used for training, a huge amount of training data is still required (more than 100 GB has been collected for only 400 users). In terms of attribute types, some of the above approaches infer numeric attributes by treating them as nominal attributes [2, 3, 5, 9, 38]. Thus, these approaches do not consider that two attribute values may be close to each other although being different. Other approaches have specific inference procedures for numeric attributes. However, these latter require the full social graph or a large training set [10, 16, 18, 22, 41]. For example, linear regression based approaches are inapplicable for high dimensional data without a large training set [18]. Besides, most approaches do not assess the certainty of predictions. But this information is essential to determine if a prediction is reliable, and thus if actions should be taken based on the prediction. To our knowledge, only Chaudhari [6] provides this information. However, this approach is designed to use the full social graph and it does not consider rich information about users such as group memberships, views and likes available on many social networks. Thus, in summary, most recent work suffer from at least two of the following important limitations: (1) assuming that the full social graph or a large training set of crawled data is available for training, (2) not considering rich information about users, (3) treating numeric attributes as nominal attributes, and (4) not assessing the certainty of their predictions. Table 1 provides a brief overview of the works reviewed in this section with respect to these four limitations. A ”X” in a cell indicates that the approach in the corresponding row suffers from the limitation in the corresponding column.
3
Problem Definition
Having provided an overview of related work, this section provides a formal definition of the problem of user profile inference that will be used for the rest of this paper. The problem of user profiling is commonly defined as follows [3, 6, 16, 19, 20, 22]. Definition 1 (social graph). A social graph G is a quadruplet G = {N, L, V, A}. N is the set of nodes in G. L ⊆ N × N is a binary relation representing the links (edges) between nodes. Let be m attributes to describe users of the
Inferring Social Network User Profiles
9
Table 1. Comparison of related work with respect to the four limitations Article Limitation 1 Limitation 2 Limitation 3 Limitation 4 Al Zamal et al. [38] X X X Bhattacharya et al. [1] X X X X Bi et al. [2] X X X X Blenn et al. [3] X X X X Chaabane et al. [5] X X X Chaudhari [6] X X X Dong et al. [10] X X X Davis Jr et al. [9] X X X X Gong et al. [12] X X X X He et al.[14] X X X X Huang et al. [13] X X X Jurgens et al. [16] X X X Kong et al. [17] X X X X Kosinski et al. [18] X X X Li et al. [19] X X X X Lindamood et al. [20] X X X X Mislove et al. [22] X X X Pennacchiotti and Popescu [24] X X X Quercia et al. [26] X X X X Wang et al. [37] X X X X Zhao et al. [39] X X X Zhao et al. [40] X X X X Zhong et al. [41] X X X
social network such that V = {V1 , V2 , ...Vm } contains for each attribute i, the set of possible attribute values Vi . Finally, A = {A1 , A2 , ...Am } contains for each attribute i a relation assigning an attribute value to nodes, that is Ai ⊆ N × Vi . Example 1. Let be a social graph with three nodes N = {T om, Amy, Lea} and friendship links L = {(T om, Lea), (Lea, T om), (Lea, Amy), (Amy, Lea)}. Consider two attributes gender and status, respectively called attribute 1 and 2 to describe users. The set of possible attribute values for gender and status are respectively V1 = {male, f emale} and V2 = {prof essor, student}. The relations assigning attributes values to nodes are A1 = {(T om, male), (Amy, f emale), (Lea, f emale)} and A2 = {(T om, student), (Amy, student), (Lea, prof essor)}. Definition 2 (Problem of inferring user profiles in a social graph). The problem of inferring the user profile of a node n ∈ N in a social graph G is to guess the attribute values of n using the other information provided in G. Example 2. Assume that the gender of Lea is unknown in the previous example. One may want to infer the gender of this user based on her user profile an links to other user in the social graph.
10
Dougnon, R. Y., Fournier-Viger, P., Lin, J.C.W., Nkambou, R.
In this paper, we furthermore consider an extended problem definition were additional information from social networks such as Facebook are considered (views, likes and group memberships). Definition 3 (extended social graph). An extended social graph E is a tuple E = {N, L, V, A, G, N G, P, P G, LP, V P } where N, L, V, A are defined as previously. G is a set of groups that a user can be a member of. The relation N G ⊆ N × G indicates the membership of users to groups. P is a set of publications such as pictures, texts, videos that are posted in groups. P G is a relation P G ⊆ P ×G, which associates a publication to the group(s) where it was posted. LP is a relation LP ⊆ N × P indicating publication(s) liked by each user (e.g. ”likes” on Facebook). V P is a relation V P ⊆ N × P indicating publication(s) viewed by each user (e.g. ”views” on Facebook), such that LP ⊆ V P . Example 3. Let be two groups G = {book club, music lovers} such that N G = {(T om, book club), (Lea, book club), (Amy, music lovers)}. Let be two publications P = {picture1, picture2} published in the groups P G = {(picture1, book club), (picture2, music lovers)}. The publications viewed by users are V P = {(T om, picture1), (Lea, picture1), (Amy, picture2)} while the publications liked by users are LP = {(T om, picture1), (Amy, picture2)}. Definition 4 (Problem of inferring user profiles in an extended social graph). The problem of inferring the user profile of a node n ∈ N in an extended social graph E is to guess the attribute values of n using the information in E. But the above definitions assume that the full social graph may be used to perform predictions. We define the problem of inferring user profiles using a limited amount of information as follows. Definition 5 (Problem of inferring user profiles using a partial (extended) social graph). Let maxF acts ∈ N+ be a parameter set by the user. The problem of inferring the user profile of a node n ∈ N using a partial (extended) social graph E is to accurately predict the attribute values of n by accessing (crawling) no more than maxF acts facts from the social graph. A fact is a node, group or publication from N , G or P (excluding n). Example 4. Again, considering the previous example, one may want to predict the gender of Lea but this time by accessing (crawling) a limited number of information from the social network (assuming that no data has been previously crawled). For example, if maxF acts is set to 2, a prediction should only be done by accessing (crawling) no more than two nodes/groups/publications of the social graph. It can be argued that this problem definition is more realistic than the previous ones given that many social networks use various security strategies to prevent web crawling on their network.[5]. Besides, the above definitions can be extended for numeric attributes. For those attributes, instead of aiming at predicting an exact attribute value, the goal is to predict a value that is as close as possible to the real value.
Inferring Social Network User Profiles
11
Example 5. Assume that the numeric attribute age is used to describe users of the social network considered in the previous examples. A good prediction for the attribute age for the user Lea consists of predicting a value that is as close as possible to her real age. Lastly, in this paper, we also extend the problem of inferring user profile to consider the certainty of predictions. In this setting, a prediction algorithm must assign a certainty value in the [0, 1] interval to each predicted value, such that a high certainty value indicates that a prediction is likely to be correct. Example 6. Consider again the social network used in previous examples. Assume that the gender of the user Lea is unknown in the social network. If a prediction algorithm infers that the gender of Lea is female and that the certainty of this prediction is high (close to 1), it can be concluded that the prediction is correct and that the model has well-assessed the certainty of its prediction. If the algorithm infers that the gender of Lea is male and that the certainty is low (close to 0), it can be concluded that the prediction was incorrect, but that the model has well-assessed that its prediction was likely incorrect.
4
The Proposed PGPI Algorithm
This section present the proposed PGPI algorithm. It first describes a version named PGPI-N that infer user profiles using only nodes and links from the social graph. Then, it presents an alternative version named PGPI-G designed for predicting user profiles using only group and publication information (views and likes). Then, it explains how these two versions are combined in the full PGPI algorithm. 4.1
PGPI-N: Inferring user profiles using nodes and links
Our proposed algorithm PGPI-N for inferring profiles using nodes and links is inspired by the label propagation family of algorithms, which was shown to provide high accuracy [16, 19]. These algorithms suffer however from an important limitation. They are iterative algorithms that require the full social graph or a large part of the social graph to be crawled for training (to propagate attribute values in the social graph) [16]. Another limitation is that several label propagation approaches [16] only consider a single attribute. PGPI-N adapts the idea of label propagation for the case where at most maxF acts facts from the social graph can be accessed (crawled) to make a prediction, and where it is assumed that no data has been crawled beforehand. This is possible because PGPI-N is a lazy algorithm (it does not require training), unlike label propagation. To predict an attribute value of a node ni , PGPIN only explores the neighborhood of ni , which is restricted by a parameter maxDistance and only propagate towards the node ni rather than propagating in all directions. The PGPI-N algorithm thus explores the neighborhood of ni using a breadth-first search.
12
Dougnon, R. Y., Fournier-Viger, P., Lin, J.C.W., Nkambou, R.
The pseudocode of the PGPI-N algorithm is shown in Algorithm 1. It takes as parameter a node ni , an attribute k to be predicted, the maxF acts and maxDistance parameters and a social graph G. It outputs a predicted value v for attribute k of node ni . The algorithm first initializes a map M so that it contains a key-value pair (v, 0) for each possible value v for attribute k. The algorithm then performs a breadth-first search in the social graph starting from node ni . To do this, it first initializes a queue Q to store nodes that should be explored next and a set seen to remember the already visited nodes. Then, the node ni is pushed in the queue. Then, while the queue is not empty and the number of accessed facts is less than maxF acts, the algorithm pops the first node nj in the queue to process it. A formula is then calculated to weight the influence of nj on the inference of attribute k for ni : Fi,j = Wi,j /dist(ni , nj )
(1)
In this formula, the term Wi,j assess the similarity of the user profiles of ni and nj based on the assumption that if two users have similar profiles, then they are more likely to also share similar values for the attribute k to be predicted. Wi,j is defined as Wi,j = Ci,j /Ci , where Ci,j is the number of attribute values common to ni and nj , and Ci is the number of known attribute values for node ni . For example, assume that ni and nj respectively have 5 and 6 known attribute values and that they share 3 common attribute values. Then, Wi,j = 3/5 and Wj,i = 3/6. The term dist(ni , nj ) measures the distance between ni and nj . It is defined as the number of edges in the shortest path between ni and nj in the social graph. It is based on the assumption that nodes that are closer in the social graph are more likely to be similar. For example, if two nodes are separated by a single node in the social graph, the distance between these two nodes is 2, while if two nodes are neighbors, the distance is 1. After the calculation of Fi,j , Fi,j is added to the entry in map M for the attribute value of nj for attribute k. Then, if dist(x, y) ≤ maxDistance, each node nh linked to nj that was not already visited is pushed in the queue and added to the set seen. Finally, when the while loop terminates, the attribute value v associated to the largest value in M is returned as the predicted value for ni . Note that in our implementation, if the maxF acts limit is reached, the algorithm do not perform a prediction to reduce the probability of making an inaccurate prediction. 4.2
PGPI-G: Inferring user profiles using groups and publications
The second algorithm is PGPI-G. It is specifically designed to predict user attribute values using group and publication information (views and likes). To design this algorithm, we have been inspired by majority voting algorithms (e.g. [9]), which have been used for predicting user profiles based on links between
Inferring Social Network User Profiles
13
Algorithm 1: The PGPI-N algorithm input : ni : a node, k: the attribute to be predicted, maxF acts and maxDistance: the user-defined thresholds, G: a social graph output: the predicted attribute value v 1 2 3 4 5 6 7 8 9 10 11 12 13 14 15 16
M = {(v, 0)|v ∈ Vk }; Initialize a queue Q; Q.push(ni ); seen = {ni }; while Q is not empty and |accessedF acts| < maxF acts do nj = Q.pop(); Fi,j ← Wi,j /dist(ni , nj ); Add Fi,j to the entry of value v in M such that (nj , v) ∈ Ak ; if dist(ni , nj ) ≤ maxDistance then foreach node nh 6= ni such that (nh , nj ) ∈ L and nh 6∈ seen do Q.push(nh ); seen ← seen ∪ {nh }; end end end return the value v such that (v, z) ∈ M ∧ 6 ∃(v 0 , z 0 ) ∈ M |z 0 > z;
users. PGPI-G adapts this idea for groups and publications and also to handle the constraint that at most maxF acts facts from the social graph can be accessed to make a prediction. The PGPI-G algorithm is shown in Algorithm 2. It takes as parameter a node ni , an attribute k to be predicted, the maxF acts parameter and an extended social graph E. It outputs a predicted value v for attribute k of node ni . Similarly to PGPI-N, the algorithm first initializes a map M so that it contains a key-value pair (v, 0) for each possible value v for attribute k. Then, the algorithm iterates over each member nj 6= ni of each group g where ni is a member, while the number of accessed facts is less than maxF acts. For each such node nj , a formula F gi,j is calculated to estimate the similarity between ni and nj and the similarity between ni and the group g.
F gi,j = Wi,j × commonLikes(ni , nj ) × commonV iews(ni , nj ) × (commonGroups(ni , nj )/|{(ni , x)|(ni , x) ∈ N G}|) × commonP opularAttributes(ni , g)
(2)
In this formula, commonLikes(ni , nj ) is the number of publications liked by both ni and nj . It is used in the formula to consider that if two users have similar ”likes”, their profiles are also more likely to be similar. Similarly, the term commonV iews(ni , nj ) denotes the number of publications liked by both ni and nj and it is based on a similar assumption. Note that on social networks such as Facebook, the number of ”likes” is always no greater
14
Dougnon, R. Y., Fournier-Viger, P., Lin, J.C.W., Nkambou, R.
than the number of views because a user cannot like a publications that s/he has not viewed. The term commonGroups(ni , nj ) is the number of groups common to ni and nj . This term is used to consider that users that are members of the same group are more likely to be similar. Finally, the term commonP opularAttributes(ni , g) is the number of attribute values of ni that are the same as the most popular attribute values for members of the group g. For example, consider a social network with three attributes: ”status”, ”gender” and ”major”. Now assume that the most popular attribute values found in user profiles of members of a group g are ”student”, ”male” and ”computer science”. For a user ni having attribute values ”student”, ”female” and ”computer science”, commonP opularAttributes(ni , g) is equal to 2. After the value of the formula F gi,j has been calculated, it is added to the entry in map M for the attribute value of nj for attribute k. Finally, the attribute value v associated to the largest value in M is returned as the predicted value for attribute k of ni . Note that in our implementation, if the maxF acts limit is reached, the algorithm do not perform a prediction to reduce the probability of making an inaccurate prediction.
Algorithm 2: The PGPI-G algorithm input : ni : a node, k: the attribute to be predicted, maxF acts: a user-defined threshold, E: an extended social graph output: the predicted attribute value v 1 2 3 4 5 6 7 8 9
4.3
M = {(v, 0)|v ∈ Vk }; foreach group g|(ni , g) ∈ N G s.t. |accessedF acts| < maxF acts do foreach person nj 6= ni ∈ g s.t. |accessedF acts| < maxF acts do F gi,j ← Wi,j × commonLikes(ni , nj ) × commonV iews(ni , nj ) × (commonGroups(ni , nj )/|{(ni , x)|(ni , x) ∈ N G}|)× commonP opularAttributes(ni , g); Add F gi,j to the entry of value v in M such that (nj , v) ∈ Ak ; end end return a value v such that (v, z) ∈ M ∧ 6 ∃(v 0 , z 0 ) ∈ M |z 0 > z;
Inferring user profiles using nodes, links, groups and publications
The PGPI-N and PGPI-G algorithms have similar design. Both of them are lazy algorithms that update a map M containing key-value pairs and then return the attribute value v associated to the highest value in M as the prediction. Because of this similarity, the algorithms PGPI-N and PGPI-G can be easily combined. We name this combination PGPI. The result is an algorithm that can perform
Inferring Social Network User Profiles
15
predictions based on user profiles, links between users, as well as information about group memberships, views and likes. The pseudocode of PGPI is shown in Algorithm 3, and is obtained by inserting lines 2 to 15 of PGPI-N before line 8 of PGPI-G. Moreover, a new parameter named ratioF acts is added to weight the influence of PGPI-N versus PGPI-G on predictions. It specifies how much facts of the maxF acts facts can be respectively used by PGPI-N and by PGPI-G to make a prediction. For example, ratioF acts = 0.3 means that PGPI-G may use up to 30% of the facts, and thus that PGPI-N may use the other 70%. The best value for this parameter is found empirically. In our experiment, we found that the value 0.5 gave the best inference accuracy.
Algorithm 3: The PGPI algorithm input : ni : a node, k: the attribute to be predicted, maxF acts: a user-defined threshold, E: an extended social graph, ratioF acts: the ratio of facts to be used by PGPI-G output: the predicted attribute value v 1 2 3 4
5 6 7 8 9 10 11 12 13 14 15 16 17 18 19 20 21 22 23
M = {(v, 0)|v ∈ Vk }; foreach group g|(ni , g) ∈ N G s.t. |accessedF acts| < maxF actsxratioF acts do foreach person nj 6= ni ∈ g s.t. |accessedF acts| < maxF acts do F gi,j ← Wi,j × commonLikes(ni , nj ) × commT hepseudocodeof P GP IisshowninF ig.3.onV iews(ni , nj ) × (commonGroups(ni , nj )/|{(ni , x)|(ni , x) ∈ N G}|)× commonP opularAttributes(ni , g); Add F gi,j to the entry of value v in M such that (nj , v) ∈ Ak ; end end Initialize a queue Q; Q.push(ni ); seen = {ni }; while Q is not empty and |accessedF acts| < maxF acts do nj = Q.pop(); Fi,j ← Wi,j /dist(ni , nj ); Add Fi,j to the entry of value v in M such that (nj , v) ∈ Ak ; if dist(ni , nj ) ≤ maxDistance then foreach node nh 6= ni such that (nh , nj ) ∈ L and nh 6∈ seen do Q.push(nh ); seen ← seen ∪ {nh }; end end end return a value v such that (v, z) ∈ M ∧ 6 ∃(v 0 , z 0 ) ∈ M |z 0 > z;
16
5
Dougnon, R. Y., Fournier-Viger, P., Lin, J.C.W., Nkambou, R.
The Proposed PGPI+ Algorithm
This section present an extension of the proposed PGPI algorithms to improve inference accuracy, handle numeric attributes, and provide a measure of certainty that predictions are correct. Subsections 5.1, 5.2 and 5.3 respectively present these three improvements. The modified versions of PGPI, PGPI-N and PGPIG are respectivelly denoted as PGPI+, PGPI-N+ and PGPI-G+. 5.1
Improvements to improve accuracy and coverage
The proposed PGPI algorithms were shown to provide great accuracy in our preliminary experiments for the Facebook social network [11]. However, we have found several ways to still improve its inference accuracy. The first modifications consists of modifying the formula Fi,j used by PGPIN as follows: Fi,j = Wi,j × (Ti,j + 1)/newdist(ni , nj ) × R
(3)
In this new formula, the term Ti,j + 1 has been added, where Ti,j is the number of common friends between ni and nj , divided by the number of friends of ni . This term is introduced based on the hypothesis that two persons having common friends (forming a triad) are more likely to have similar attribute values [29]. Note that the constant 1 is used in the formula so that if ni and nj have no common friends, the other terms of Fi,j will not be multiplied by zero. The second important change is to how the distance between ni and nj is calculated. In experiments with the PGPI algorithm, we observed that the term 1/dist(ni , nj ) makes Fi,j decreases too rapidly. For example, if the number of edges in the shortest path between ni and nj is respectively 1, 2 and 3, the term would evaluate to 1, 1/2 and 1/3. This means that any user nj that is more than two or three edges away from ni would have a negligible influence on the profile inference of node ni . To address this issue, dist(ni , nj ) is replaced by newdist(ni , nj ) = 3 − (0.2 × dist(ni , nj )), where it is assumed that maxDistance < 15. It was empirically found that this formula provides higher accuracy, as it will be shown in the experimental evaluation of this paper. The third important change is to the PGPI procedure. In experiments with PGPI, we have found that PGPI-G had too much influence on predictions compared to PGPI-N. To address this issue, we now multiply the weights calculated using the formula Fi,j by a new constant R. This constant is used to increase the influence of PGPI-N+ on the choice of predicted values. In our experiments, we have found that setting R to 10 provides the best accuracy. The fourth change is to the main procedure of PGPI+. It is based on the observation that PGPI does not make a prediction for up to 50% of users when maxF acts is set to a small value [11]. The reason is that PGPI does not make a prediction when it reaches the maxF acts limit. However, it may have collected enough information to make an accurate prediction. In PGPI+, a prediction is always performed. This improvement was shown to greatly increase the number of predictions, as will be shown in the experimental evaluation section.
Inferring Social Network User Profiles
5.2
17
Extension to handle numeric attributes
Th PGPI algorithm as described in the previous section is specifically designed for nominal attributes. Although, it can stil be applied on numeric attributes, it is not designed for that. For numeric attributes, PGPI would simply treat each attribute value as a distinct symbol without considering that some values are closer to each other. For example, consider an attribute ”year”. The PGPI algorithm would consider that the value 2007 is as close to value 2008 than it is to 1990. It was observed that this leads to low accuracy for numeric attributes. This is especially the case for numeric attributes that can have a very large number of different values. For example, for the ”weight” attribute, few users may have exactly the same weight. To address this issue, the PGPI algorithm has been extended with inference mechanisms specialized for handling numeric attributes. The rest of this subsection explains the modifications that have been done to handle numeric attributes. First, we modified how a value is chosen to be the predicted value. Recall that the value predicted by PGPI for an attribute is the one having the highest weight in the map M (line 12). However, for numeric attribute, this approach provides poor accuracy because often few users have exactly the same attribute value. For example, for the attribute ”weight”, few users may have the same weight, although they may have similar weights. To address this issue, PGPI+ calculates the predicted values of a numeric attribute using a weighed sum of all values in M . Given the map M , the predicted value of a numeric attribute is obtained as: P rediction =
X (v,z)∈M
(v × z)/
X
z
(4)
(v,z)∈M
Although, this provides an improvement, we found in preliminary experiments that the weighted sum is sometimes heavily influenced by outlier values. For example, if a young user has friendship links to a few 20 years old friends but also a link to his 90 years old grandmother, the prediction of the user’s age resulting from the weighted sum may become inaccurate. To address this issue, we adapted the weighted sum so that it ignores outliers when making a prediction. But how to identify outliers? A possibility is to define an outlier as a value that is far from other values. However, this would not work well because although a value may be far from other values, it may have a much greater weight than the other values in map M . Thus, a better solution is to define what is an outlier based on the weights associated to values in M . Moreover, it is also desirable to have an attribute independent definition of what is an outlier. Thus, we defined an outlier as a value having a weight that is a given number of standard deviation away from the mean. In preliminary experiments, we found that using one standard deviation as the cut-off point provided the best results. The modified procedure for the inference of numeric attributes thus ignore values in M that have a weight more than one standard deviation away from the mean. In our
18
Dougnon, R. Y., Fournier-Viger, P., Lin, J.C.W., Nkambou, R.
experiment, this modification greatly improves prediction accuracy for numeric attributes. Another important change that we have made to better handle numeric attributes is to how the similarity between users is calculated. Recall that in PGPI, the similarity between two users ni and nj is denoted as Wi,j and calculated as Wi,j = Ci,j /Ci , where Ci,j is the number of attribute values common to ni and nj , and Ci is the number of known attribute values for node ni . This definition does not work well for numeric attributes because numeric attributes rarely have the same value. To consider that numeric values may not be equal but still be close, Wi,j is redefined as follows in PGPI+. Wi,j = [Cnomi,j + Cnumi,j ]/Ci
(5)
In this equation, the value Cnomi,j is the number of nominal values common to ni and nj . The term Cnumi,j represents the similarity of numeric attribute values of ni and nj . It is calculated as: X Cnumi,j = CNi,j,k (6) k=1...q
where q is the number of numeric attributes. The term CNi,j,k represents the similarity of the value of attribute k for users ni and nj and is defined as: ( (vi − vj )/αk if (vi − vj ) < αk CNi,j,k = (7) 0 otherwise. where αk is a user-defined constant. The constant αk is used to guarantee that CNi,j,k will be a value in the [0,1] interval and thus that numeric attributes may not have more influence than a nominal attributes on the calculation of Wi,j . This is to ensure that all attributes are equal. For example, for the age and height attributes, αage and αheight could be set to values such as 115 (years old) and 7 (feet). 5.3
Extension to evaluate the certainty of predictions
As previously mentioned, few inference algorithm assess the certainty of their predictions. However, this feature is desirable to know how good a prediction is and whether or not actions should be taken based on the prediction. For example, in the context of ad targeting, if there is a low certainty that a user profile attribute is correctly inferred, it may be better to not use this attribute for ad targeting, rather than showing an ad that is targeted to a different audience [6]. To address this issue, we have added the capability of calculating a certainty value CV (v) for each value v predicted by PGPI+. A certainty value is a value in the [0, 1] interval. A high certainty value (close to 1) indicates that a prediction is likely to be correct. Certainty values are calculated differently for numeric and nominal attributes because different inference procedures are used to predict attribute values.
Inferring Social Network User Profiles
19
Certainty of numeric values. Recall that values of numeric attributes are predicted using a weighted sum. Thus, calculating the certainty value of a predicted value v for a numeric attribute k requires to find a way to assess how ”accurate” the weighted sum for calculating v is. Intuitively, we can expect the weighted sum to be accurate if (1) the amount of information taken into account by the weighted sum is large, and (2) if values considered in the weighted sum are close to each other. These ideas are captured in our approach by using the relative standard error. Let EM = {v1 , v2 , ...vp } be the set of values stored in the map M that were used to calculate the weighted sum. The amount of information used by the weighted sum is measured as the number of updates made by PGPI-N+/PGPIG+ to the map M , denoted √ as updates. The relative standard error is defined as RSE(v) = stdev(EM )/( updates × avg(EM )). The RSE is a value in the [0,1] interval that assesses how close the average of a sample might be to the average of the population. Because we want a certainty value rather than an error value, we calculate the certainty value of v as: p CV (v) = 1 − RSE(v) = 1 − [stdev(EM )/( updates × avg(EM ))]
(8)
The proposed approach provides an assessment of the certainty of a prediction. However, a drawback of this RSE based approach is that it is sensible to outliers. To address this issue, we ignore values that are more than one standard deviation away from the mean when calculating CV (v). Certainty of nominal values. The procedure for calculating the certainty of a predicted value v for a nominal attribute is different than for numeric attributes since the inference procedure is not the same. Our idea is to evaluate how likely the weight z of value v in M is to be as large at it is, compared to other weights in M . To estimate this, we use a simulation-based approach where ”larger” is defined in terms of a number of standard deviations away from the mean. The procedure for calculating the certainty of a value for a numeric attribute is shown in Fig. 4. It takes as input a value v for an attribute k and the map of values/weights M . Let ZM = {z1 , z2 , ...zp } denotes the weights of values in the map M , and t(M, v) be the weight of v in map M . We initialize a variable count to 0 and perform 1,000 simulations. During the j-th simulation, the algorithm creates a new map B so that it contains a key-value pair (v, 0) for each possible value v for attribute k in map M . These weights are initialized to zero. Then, the algorithm performs updates random updates to B. A random update is performed as follows. First, a pair (v 0 , z 0 ) is randomly chosen from B. Then, a value x is randomly selected from the [0, 1] interval. Finally, (v 0 , z 0 ) is replaced by (v 0 , z 0 + x) in B. At the end of the j-th simulation, we increase the count variable by 1 if (t(B, v) − avg(ZB )) /stdev(ZB ) ≥ (t(M, v) − avg(ZM )) /stdev(ZM ). After performing the 1,000 simulations, the certainty value is calculated as CV (v) = count/1000, which gives a value in the [0,1] interval. This value CV (v) can be interpreted as follows. It represents what is the chance that
20
Dougnon, R. Y., Fournier-Viger, P., Lin, J.C.W., Nkambou, R.
the weight of v in map M is as far as it is in terms of standard deviation from the average weight of values in map M for the attribute to be predicted k. Thus, by the above mechanisms a certainty values can be provided for predicted values of both numeric and nominal attributes.
Algorithm 4: Certainty assessment of a nominal attribute value input : M : the map of values/weights, v: an attribute value, k: the attribute, updates: the number of updates to M output: the certainty value CV (v) 1 2 3 4 5 6 7 8 9 10 11 12 13 14
6
count = 0; for 1 to 1000 do B = {(v, 0)|(v, z) ∈ M }; for 1 to updates do Randomly choose a pair (v 0 , z 0 ) from B; x = random([0, 1]); Replace (v 0 , z 0 ) by (v 0 , z 0 + x) in B; end if (t(B, v) − avg(ZB )) /stdev(ZB ) ≥ (t(M, v) − avg(ZM )) /stdev(ZM ) then count = count + 1; end end CV (v) = count/1000; return CV(v);
Experimental Evaluation
An extensive set of experiments is performed to evaluate the proposed algorithms. In these experiments, the accuracy of the proposed PGPI+, PGPI-N+ and PGPI-G+ algorithms is compared with the accuracy of four state-of-theart algorithms for predicting attribute values of users in social networks. The three first algorithms are Na¨ıve Bayes classifiers [15]. Na¨ıve Bayes (NB) infers user profiles strictly based on correlation between attribute values. Relational Na¨ıve Bayes (RNB) considers the probability of having friends with specific attribute values. Collective Na¨ıve Bayes (CNB) combines NB and RNB. To be able to compare the proposed algorithms with NB, RNB and CNB, we have adapted these latter to work with a partial social graph. This is done by training them with maxF acts users chosen randomly instead of the full social graph. The fourth algorithm is label propagation (LP) [16]. Because LP requires the full social graph, its results are only used as a baseline. Besides, to assess the improvements of the proposed PGPI+, PGPI-N+ and PGPI-G+ algorithms, we compare their performance with the corresponding versions without improvements called PGPI, PGPI-N and PGPI-G, respectively. In the experiments, all algorithms were tuned with optimal parameter values.
Inferring Social Network User Profiles
6.1
21
Datasets
Two datasets are used. The first one is 11,247 user profiles collected from Facebook in 2005 (obtained from [30]). In this dataset, each user is described according to seven attributes: a student/faculty status flag, gender, major, second major/minor (if applicable), dorm/house, year, and high school, where year is a numeric attribute. The second dataset is 20,000 user profiles from the Pokec social network obtained at https://snap.stanford.edu/data/. The dataset contains 17 attributes, including three numeric attributes: age, weight and height. Because both datasets do not contain information about groups, and this information is needed by PGPI-G and PGPI, we have generated synthetic data about group memberships, views and likes. The data generator [11] takes several parameters as input. To find realistic values for the parameters, we have observed more than 100 real groups on the Facebook network. Parameters are the following. We set the number of groups to 500 and each group to contain between 20 and 250 members, since we observed that most groups are small. Groups are randomly generated. But similar users (having one to three attributes in common) are more likely to be member of a same group. Furthermore, we limit the number of group memberships per person to 25. We generated 10,000 publications that are used to represent content shared by users in groups such as pictures, text and videos. A publication may appear in three to five groups. A user has a 50% probability of viewing a publication and a 30% probability of liking a publication that he has viewed. Lastly, a user can like and view respectively no more than 50 and 100 publications, and a user is more likely to like a publication that users with a similar profile also like. 6.2
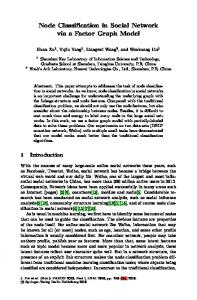
Accuracy for nominal attributes w.r.t number of facts.
We first ran all algorithms on both datasets while varying the maxF acts parameter to assess the influence of the number of accessed facts on accuracy for nominal attributes. The accuracy for nominal attributes is defined as the number of correctly predicted attribute values, divided by the number of prediction opportunities. In this experiment, the average accuracy over all attributes of each dataset is used. Fig. 1 show the results for the Facebook and Pokec datasets. In these results, no data points are shown for PGPI-N+ for respectively more than 306 and 6 facts for Facebook and Pokec because PGPI-N+ relies solely on links between nodes to perform predictions and the datasets do not contains enough links (a reason is that links may not have been made public by users). Several important observations can be made from the results. The first observation is that PGPI+, PGPI-N+ and PGPI-G+ provide the best accuracy for both datasets when compared to NB, RNB and CNB. Furthermore, this accuracy is generally considerably higher than the accuracy of NB, RNB and CNB. For example, on Facebook, the highest accuracy obtained by PGPI+, PGPI-N+ and PGPI-G+ is respectively 96%, 84% and 96%, while NB, RNB and CNB do not achieve an accuracy higher than 50%. The algorithm
22
Dougnon, R. Y., Fournier-Viger, P., Lin, J.C.W., Nkambou, R.
providing the worst results is LP (not shown in the figure). LP provides an accuracy of 43.2% and 47.31% respectively on the Facebook and Pokec datasets. This is not good considering that LP uses the full social graph of more than 10,000 nodes. The main reason why PGPI+ algorithms perform the best are that they are lazy algorithms. They use local facts close to the node to be predicted rather than relying on a general training phase performed beforehand. Moreover, another reason is that PGPI+ algorithms use more rich information. PGPI+ and PGPI-G+ consider information about groups and publications, while LP, NB, RNB and CNB do not. PGPI-N+ consider triads between friends, while triads are not considered by LP, NB, RNB and CNB. PGPI+ algorithms also consider the similarity between user profiles, while LP does not. The second observation is that PGPI+ algorithms can make highly accurate predictions even when using few facts. For example, on Facebook, PGPI+ and PGPI-G+ provide the best results when 66 to 700 facts are accessed, and for less than 66 facts, PGPI-N+ provides the best results followed by PGPI+. The third observation is that PGPI-N+ generally performs better than PGPI+ and PGPI-G+ for the same amount of facts. This is quite interesting given that PGPI-N+ only uses real data (contrarily to PGPI+/PGPI-G+) and still performs better than all other algorithms. The fourth observation is that PGPI+ algorithms offer an accuracy that is up to 34% higher than PGPI algorithms. On the Facebook dataset, the accuracy of PGPI algorithms is always less than 64%, while PGPI+ algorithms can reach up to 96%. This clearly shows that improvements proposed in PGPI+ have a major influence on accuracy. The fifth observation is that among the family of Na¨ıve Bayes algorithms, NB has the best overall accuracy. This shows that using only profile information a somewhat high accuracy can be achieved. But this accuracy still remains much lower than PGPI+ algorithms for both datasets. 6.3
Best results for each nominal attribute.
To better understand the previous results, a second experiment was performed were we analyzed the accuracy obtained for each nominal attribute separately. The goal of this analysis is to see how well each attribute can be predicted and also if some approaches perform better than others for some specific attributes. The best results in terms of accuracy for each attribute and algorithm for the Facebook and Pokec datasets are respectively shown in Table 2 and 3. The last row of each table indicates the number of accessed facts to obtain these results. Note that in these tables, the result for PGPI algorithms are not shown because they are always worse than those of the improved PGPI+ algorithms. On overall, it can be observed that the best accuracy is in general achieved by PGPI+ algorithms for all attributes, on both datasets. In several cases, PGPI+ algorithms provide an accuracy that is more than 10% higher than the compared state-of-the art algorithm, and the gap can be greater than 30% in some cases. On the Facebook dataset, for the status, gender, major, minor, residence, and school attributes, the gap between PGPI+ and other compared algorithms is of
Inferring Social Network User Profiles
23
Facebook 100%
Accuracy Accuracy Accuracy
90% 100% 80% 100% Facebook 90% 70% 90% 80% 80% 60% 70% 70% 50% 60% 60% 40% 50%
50% 30% 40% 0 40% 30% 30%0 75%
100 100 100
0
200
300 400 Number of accessed facts 300 400 300 of accessed 400facts Pokec Number
200 200
500
600
500 500
600 600
700 700 700
Number of accessed facts
75% 70% 75%
Accuracy Accuracy Accuracy
Pokec
70% 65% 70% 65% 60% 65% 60% 55% 60% 55% 55% 50% 0 50%
100
50%
PGPI+
0 0
PGPI+ PGPI+
PGPI-G+ PGPI-G+ PGPI-G+
PGPI-N+ PGPI-N+ PGPI-N+
200 Number of accessed facts 100 200 100 200 Number accessedfacts facts PGPI-N Number ofPGPI-G accessed PGPI PGPI PGPI
PGPI-G PGPI-G
PGPI-N PGPI-N
300 NB NB NB
RNB RNB RNB
300300
CNB
CNB CNB
Fig. 1. Accuracy w.r.t. number of accessed facts for nominal attributes
up to 12.8%, 48.8%, 24.8%, 20.3%, 15.5%, and 7%. The second best algorithm behind PGPI+ on the Facebook dataset is PGPI-G+, closely followed by PGPIN+. It is interesting to observe that PGPI-N+ can achieve quite a high accuracy using only 226 facts on average while the best accuracy for PGPI+ and PGPIG+ requires more than 400 facts. On the Pokec dataset, the best results for each attributes are generally obtained by PGPI+ and PGPI-G+. An interesting observation is that PGPI-N+ is less effective than these two algorithms in general but it is impressive that it achieves very close results to these algorithms using only 6 facts on average. Thus, with a very small amount of facts, PGPI+ can predict results with a very high accuracy. A second important observation is that PGPI+ algorithms allow to predict some attributes with a very high accuracy. For example, the gender of a Facebook user can be predicted with up to 95% accuracy by PGPI+. Another example is that PGPI-N+ can guess with up to 94% accuracy if a Pokec user speaks a language such as spanish or italian. The high accuracy that is obtained may be very useful for real applications of user profiling such as ad targeting. A third observation is that some attributes are more difficult to predict. For example, most algorithms have a relatively low accuracy for the school attribute on the Facebook dataset. A reason is that the school attribute has a very high number of possible values (1,420 values, each corresponding to a possible highschool attended by a user). Thus, it is reasonable to expect that this attribute
24
Dougnon, R. Y., Fournier-Viger, P., Lin, J.C.W., Nkambou, R.
is more difficult to predict than other attributes having a smaller range of possible values such as the binary attribute gender. A second reason is that users are rarely linked to other users with the same value for the school attribute in the Facebook dataset. The reason is that in 2005, Facebook users were mainly linked through friendships relationships as classmates or teaching colleagues. Thus, many users that were friends on Facebook had not attended the same high school. As a result, this attribute is hard to predict accurately by exploring the neighborhood of a node in the social graph, since many friends of a node have no common attribute value for this attribute. A similar phenomena occurs with the region attribute for the Pokec dataset, which indicates the region where a given user lives. A third reason is that the prediction algorithm likely does not have the information needed to accurately discriminate between the various possible values for the school and region attribute. For example, on the Facebook dataset, there is only a few attributes. And most of these attributes (major/minor, dorm/house, year, and gender ) have a low correlation with the school attribute. Thus, to better predict this attribute, the best solution would be to exploit other kind of information that are more relevant for predicting this attribute such as location information but are unavailable in our current dataset. Designing algorithms that would perform better on attributes having a very large amount of possible values is a problem that we will consider in future work to improve our approach. Table 2. Best accuracy results for nominal attributes on Facebook attribute status gender major minor residence school |f acts|
6.4
PGPI+ 92.0% 96.1% 33.8% 76.0% 64.6% 7.4% 482
PGPI-N+ 92.6 % 84.7 % 30.4% 76.4% 62.4% 16.8% 226
PGPI-G+ 93.0% 95.8% 32.8% 76.6% 64.4% 7.0% 431
NB 88.0% 51.1% 16.6% 74.4% 55.6 % 10.6% 189
RNB 80.2% 57.7% 15.0% 74.2% 55.0% 9.8% 580
CNB 88.0% 47.3% 9.0% 74.0% 54.8% 10.6% 189
LP 83.0% 50.4% 16.7% 56.3% 49.1% 10.1% 10K
Best results when using the full social graph.
In another experiment, we also compared the accuracy of the algorithms using the full social graph for nominal attributes. The best accuracy obtained for each algorithm on the Facebook and Pokec datasets is shown in Table 4. It can be observed that the proposed PGPI+ algorithms provide an accuracy that is more than 20% higher than the PGPI algorithms, thus showing the benefits of the proposed improvements. Moreover, it can be seen that PGPI+ algorithms outperforms by up to 30% accuracy the NB, RNB, CNB and LP algorithms.
Inferring Social Network User Profiles
25
Table 3. Best accuracy results for nominal attributes on Pokec attribute Gender English French German Italian Spanish Smoker Drink Marital status Hip-hop Rap Rock Disco Metal Region |f acts|
PGPI+ 95.60% 76.35% 87.46% 62.39% 94.87% 95.15% 65.21% 71.65% 76.57% 86.51% 69.33% 77.93% 58.40% 86.19% 18.60% 334
PGPI-N+ 61.40% 63.79% 84.48% 54.31% 94.25% 94.54% 62.34% 63.36% 70.86% 82.20% 63.78% 73.80% 52.50% 83.52% 10.20% 6
PGPI-G+ 95.77% 76.00% 87.42% 62.85% 94.85% 95.14% 65.42% 71.47% 76.40% 86.47% 69.52% 78.09% 58.56% 86.15% 18.71% 347
NB 52.80% 69.74% 86.91% 47.83% 94.65% 94.38% 63.43% 70.41% 76.11% 86.01% 69.08% 76.33% 50.07% 84.75% 6.20% 375
RNB 53.80% 69.74% 85.60% 48.12% 95.38% 95.08% 63.43% 70.41% 76.02% 85.83% 69.35% 74.93% 53.18% 84.61% 6.20% 378
CNB 53.60% 69.74% 86.87% 47.83% 95.41% 94.29% 63.12% 70.41% 76.07% 85.93% 69.35% 74.93% 53.46% 84.61% 6.20% 278
LP 49.20% 65.40% 67.15% 50.00% 85.75% 80.52% 60.19% 49.16% 69.92% 61.82% 45.78% 53.69% 47.28% 63.79% 10.00% 10k
Besides, as previously mentioned, it is interesting to note that the PGPI-N+ algorithm achieves a very high accuracy by considering only real data. Table 4. Best accuracy for nominal attributes using the full social graph algorithm PGPI+ PGPI-N+ PGPI-G+ PGPI PGPI-N PGPI-G NB RNB CNB LP
6.5
Facebook 96.6 96.4 84.9 63.8 63.8 62.8 48.67 50.11 50.11 48.03
Pokec 73.8 73.9 65.9 62.0 62.1 56.2 57.48 56.37 56.40 47.31
Best results for each numeric attribute.
Previous subsections presented accuracy results for nominal attributes. In this subsection, an experiment is performed to assess the accuracy of the compared algorithms for numeric attributes. The goal is to evaluate the improvement provided in PGPI+ for handling numeric attributes. In this experiment, the accu-
26
Dougnon, R. Y., Fournier-Viger, P., Lin, J.C.W., Nkambou, R.
racy of PGPI+ algorithms is compared with PGPI algorithms, NB, RNB, CNB and LP. Because these later algorithms treat numeric attributes as nominal attributes, they are used as baseline. Note that we also attempted to include the algorithm of Kosinski [18] in this comparison since it is designed for inferring values for numeric attributes. However, the algorithm failed to produce result using both datasets because linear regression requires a larger dataset for training, given that the dataset contains numerous dimensions. In this experiment, the accuracy is measured differently than in the experiments for nominal attributes since the goal for numeric attributes is to predict attribute values that are as close as possible to the real values rather than predicting the exact value. Thus, the accuracy for numeric attributes is measured in terms of average error and standard deviation of predicted values from the real values. Table 5 show the best results obtained by the algorithms for each numeric attribute for the Facebook and Pokec datasets, and the number of facts accessed to obtain these results. It can be first observed that PGPI+ algorithms perform very well. The PGPI+ and PGPI-G+ algorithms always provide almost the same accuracy. The PGPI-N+ algorithm performs slightly lower accuracy than PGPI+ and PGPIG+ but using less facts. In terms of number of facts accessed. The PGPI+ algorithms utilize a very small number of facts to obtain the results. In particular, results for PGPI-N+ show that very accurate prediction can be obtained using a very small number of facts. Another observation is that PGPI+ algorithms generally outperform the PGPI algorithms in terms of accuracy. For example, the PGPI-N+ algorithm performs better than the PGPI-N algorithm both in terms of average error and standard deviation for almost all attributes. For some attributes, the improvement provided by PGPI-N+ over PGPI-N is greater than for other attributes. For example, for the height attribute, the average error obtained by PGPI-N+ is 10.32 instead of 14 for PGPI-N and the standard deviation is 10.32 for PGPI-N+ instead of 36.52 for PGPI-N, a considerable improvement. The reason why PGPI algorithms perform better than PGPI algorithms in general is that PGPI+ algorithms have specific inference procedures for numeric attributes, while PGPI algorithms treat them as nominal attributes. It is also interesting to compare the results of PGPI+ with NB, CNB, RNB and LP algorithms. The LP algorithm generally performs the worse among all algorithms. For examle, for the weight attribute on the Pokec dataset, it achieves a standard deviation of 59, whereas all other algorithms all achieve a standard deviation lower than 16. This poor performance is due to the fact that LP is a simple model that consider each attribute independently and treat numeric attributes as nominal attributes. For Na¨ıve Bayes classifiers, it can be seen that their performance are quite similar but NB has the best performance. For two out of four attributes, it has better accuray than NB and CNB. Now, when comparing with PGPI+, it can be seen that PGPI+ outperforms NB, RNB, CNB and LP for all attributes. For PGPI-N+, it can be seen that it performed better than NB, RNB and CNB for the year and height attributes, and always
Inferring Social Network User Profiles
27
better than LP. These results are quite good considering that PGPI-N+ used a very small number of facts. Lastly, for the Facebook dataset, it is interesting to see that PGPI+ used up to 241 facts, while NB, RNB, CNB could not provide better accuracy using more than 1,000 facts, and LP using up to 20,000 facts. Table 5. Average error and standard deviation for numeric attributes
algorithm PGPI+ PGPI-N+ PGPI-G+ PGPI PGPI-N PGPI-G NB RNB CNB LP
6.6
Facebook year |f acts| 0.95 (0.85) 241 0.68 (0.72) 44 0.99 (0.89) 252 0.46 (0.93) 148 0.46 (0.87) 103 0.39 (0.93) 223 1.30 (0.81) 1,743 1.30 (0.81) 1,746 1.30 (0.81) 1,746 1.12 (1.30) 11,247
age 2.94 (4.55) 3.92 (4.56) 2.89 (4.45) 2.55 (4.80) 4.35 (5.11) 2.20 (4.78) 5.78 (4.34) 3.47 (4.71) 3.33 (4.40) 5.07 (5.38)
Pokec weight height 9.83 (10.32) 7.70 (11.75) 14.60 (12.56) 10.32 (12.55) 9.83 (10.37) 7.71 (11.76) 11.67 (11.53) 8.75 (12.43) 17.28 (15.61) 14.0 (36.52) 10.75 (10.86) 8.35 (12.45) 14.13 (12.40) 13.71 (11.17) 13.74 (13.91) 15.65 (13.92) 13.38 (14.34) 15.30 (12.47) 18.42 (59.35) 19.29 (15.80)
|f acts| 189 6 290 251 6 344 8 83 84 20,000
Influence of the maxF act and ratioF acts parameters.
In the previous experiments, we have analyzed the accuracy for nominal and numeric attributes. However, we did not discuss how to choose the maxF acts parameter used by the algorithms and how it influences the number of accessed facts for each algorithm. For Na¨ıve Bayes algorithms and LP, the maxF acts parameter determines the number of nodes to be used for training, and thus directly determines the number of accessed facts. For PGPI+ algorithms, we show the influence of maxF acts on the number of accessed facts for the Facebook and Pokec datasets in Fig. 2. It can be observed that PGPI+ algorithms generally explore less nodes than maxF acts (the dashed line). For PGPI-N+, the reason is that some social network users have less than maxF acts friends whithin maxDistance and thus, PGPI-N cannot use more than maxF acts facts to perform a prediction. This maximum is about 150 friends on the Facebook dataset and six friends on the Pokec datasets. For PGPI-G+, the reason is similar. It is that some users are members of just a few groups. For PGPI+, the number of accessed facts is generally greater than for PGPI-N+ but less than for PGPI-G+. The reason is that PGPI+ combines both algorithms and uses the ratioF acts parameter, as previously explained, to decide how much facts can be used by PGPI-N+ and PGPI-G+. The value that we used in previous experiments for this parameter is 0.5, which means to use 50% of the facts for PGPI-G+, and thus to use the other half for PGPI-N+.
FACEBOOK
28
Dougnon, R. Y., Fournier-Viger, P., Lin, J.C.W., Nkambou, R.
675 600
Number of accessed informations Number of accessed informations
FACEBOOK Facebook
525 675 450 600 375 525 300 450 225 375 150 300 75 225 0 150 0 75
PGPI+ PGPI-N+ PGPI-G+ PGPI+ PGPI-N+ PGPI-G+
150
300
450
600
750 maxFacts
900
1050
1200
1350
1500
0 0
150
300
450
600
750 maxFacts
900
1050
1200
1350
1500
PokecPokec Number of accessed informations Number of accessed informations
375
Pokec
300 375 225 300
PGPI+
150 225
PGPI-N+ PGPI-G+ PGPI+
75 150
PGPI-N+
0
75 0
150
300
450
600
750 maxFacts
900
1050
1200
PGPI-G+ 1350 1500
0 0
6.7
150
300
450
600
750
900
1050
1200
Fig. 2. Number of accessed facts w.r.t. maxF acts (Facebook) maxFacts
1350
1500
Influence of the ratioF acts parameter.
An experiment is also performed to assess the influence of the ratioF acts parameter for the PGPI+ algorithms. Figure 3 show the influence of the ratioF acts parameter on the overall accuracy for nominal attributes for the Facebook and Pokec datasets, respectively. In this experiment, the accuracy w.r.t the number of accessed facts is measured when ratiof acts is respectively set to 0.3, 0.5 and 0.7. Note that setting ratioF acts to 0 and 1 would be respectively equivalent to using PGPI-N+ and PGPI-G+. In Fig. 3, it can be observed that setting ratioF acts to 0.5 allows to obtain the highest accuracy. A value of 0.3 sometimes gives a higher accuracy than 0.5 and sometimes not. 6.8
Influence of the maxDistance parameter.
An experiment is also performed to assess the influence of the maxDistance parameter of the PGPI+ and PGPI-N+ algorithms. Recall that for these algorithms, the parameter called maxDistance indicates that two nodes are in
Inferring Social Network User Profiles
29
Facbook ratioFacts Facebook 100%
80%
Accuracy
Accuracy
90% 80% 70%
60%
PGPI ratioFacts = 0.3
60%
70%
PGPI ratioFacts = 0.5 PGPI ratioFacts = 0.7
50%
50% 0
100
200
300
400
500
600
700
Number of accessed facts
Pokec ratioFacts Pokec
Accuracy
80%
70%
60%
PI ratioFacts = 0.3
PGPI ratioFacts = 0.3 PGPI ratioFacts = 0.5
PI ratioFacts = 0.5
PGPI ratioFacts = 0.7
PI ratioFacts = 0.7
50% 600
700
0
50
100
150
200
250
300
350
Number of accessed facts
Fig. 3. Accuracy w.r.t. ratioF acts (Facebook)
the same neighborhood if there are no more than maxDistance edges in the shortest path between them. In the previous experiments, we have empirically set this parameter to obtain the best results. We now discuss the influence of this parameter on the results of PGPI-N+ and PGPI+. We have investigated the influence of maxDistance on the accuracy of nominal attributes and also on the number of accessed facts for both datasets. Results are shown in Fig. 4 for PGPI-N+ on the Facebook and Pokec datasets. On the Pokec dataset, it can be observed that as maxDistance is increased, the accuracy also increases until it reaches its peak at maxDistance = 4. For the Facebook dataset, a peak is also when maxDistance = 3. Another observation is that when maxDistance is increased to a large value, the accuracy does not change much (for example for maxDistance ≥ 6 on the Facebook dataset). The main reason is that the influence of a user on another user is proportional to their distance according to the PGPI-N+ algorithm. Thus, farther nodes have a smaller influence on each other. It can also be observed that as maxDistance increases, the number of accessed facts also increases, as it can be expected. Thus, if one’s goal is to use less facts, then maxDistance should be set to a small value, whereas if one’s goal is
0
30
Dougnon, R. Y., Fournier-Viger, P., Lin, J.C.W., Nkambou, R. Facebook 250 Number of accessed facts
86%
Accuracy
83% 80% 77%
200 150 100 50 0
74% 0
2
4 maxDistance
6
0
8
2
4 maxDistance
6
8
Pokec 66.0% Number of accessed facts
7
Accuracy
65.5% 65.0% 64.5%
6 5 4 3
64.0% 0
5
10
15 20 maxDistance
25
30
0
5
10
15 20 maxDistance
25
30
Fig. 4. Accuracy and number of accessed facts (right) w.r.t. maxDistance for PGPIN+
to achieve the maximum accuracy, maxDistance should be set to a large value, but not too large, otherwise the accuracy may not increase. Lastly, we can also observe that the number of accessed facts does not increase after maxDistance = 7 on Facebook and maxDistance = 4 on Pokec. The reason is again that users have few friendship links that are public in these datasets.
6.9
Assessment of certainty values.
An experiment is also performed to assessed certainty values calculated by PGPI+, PGPI-N+ and PGPI-G+. For numeric attributes, Fig. 5 and Fig. 6 respectively show the best accuracy obtained for numeric attributes year and age for each of those algorithms. Each line represents the accuracy of predictions having at least a given certainty value. It can be seen, that a high certainty value generally means a low average error, standard deviation and coverage (percentage of predictions made), as expected. For nominal attributes, the accuracy of predictions made by PGPI-N+, PGPI, PGPI-G+ having a certainty no less than 0 and no less than 0.7 are respectively 59%, 59% and 61% on Pokec, and 91%, 91% and 93% on Facebook, which also shows that the proposed certainty assessment is a good indicator of accuracy.
Inferring Social Network User Profiles
31
0
200
400
600
coverage
5,6 5,1 4,6 4,1 3,6 3,1 2,6 2,1 1,6 1,1 0,6
standard deviation
average error
PGPI+ 1,3 1,2 1,1 1 0,9 0,8 0,7 0,6 800
0
Number of accessed facts
800
300
400
4.2
1,7 4.15 1,6 4.1 1,54.05 1,4 4 1,33.95 1,2 3.9 1,13.85 0 1 3.8 100 0 3 200
200
300
4 400 5600 Number of accessed facts
800
0
200
400 800 6
600
800
100 10090 9880 100 96 70 90 94 60 92 80 90 70 50 88 60 8640 50 84 30 40 82 20 30 800 80 400 20 0 0
0
5,4 5,24.9 54,55 4.85 4,8 4 4.8 3,5 4,6 3 4.75 4,42,5 2 4.7 4,21,5 4.65 1 40,5 4.6 00
200
100
400
600
200
300
100 Number of accessed facts
200
Number of accessed facts 0.5 0.7 Number of accessed facts0.9 0.3
0.5
0
0.7
PGPI-G+
100200
200400
300 600 400 800
Numberof100 ofaccessed accessed facts200 Number facts Number of accessed facts
100 98
96 100 100 9094 92 8098 90 7096 6088 5094 86 4092 84 3082 90 2080 10 400 088 0 3 8006 0
03
100
200 4
200 400
300 5600
Number facts Numberof of accessed accessed facts
Number of accessed facts 0.3 0.5 0.7 0.5 0.7 0.9
0.3
8,5 8 7,5 7 6,5 6 5,5 5 4,5 4 3,5
0.5
0.7
coverage
4,5 4,3 4,1 3,9 3,7 3,5 3,3 3,1 2,9 2,7 2,5
400
Number of accessed facts
coverage coverage coverage
4
0.60
0
standard deviation
average error
600
PGPI-N+
Number of of accessed facts Number accessed facts
b
400
coverage coverage coverage
600
200
standard deviation standard deviation standard deviation
400
Number of accessed facts 200 Number of accessed facts
standard deviation
b)
100
5,6 5,1 5,4 4,6 5,2 4,1 4.6 3,6 4.1 5 3,1 3.6 4,8 2,6 3.1 4,6 2,1 2.6 1,6 4,4 2.1 1,1 1.6 4,2 0,6 1.1
standarddeviation deviation standard
average error
average error average error
3,9 3,7 3,5 3,3 3,1 2,9 2,7 2,5
200
Number of accessed 0 100 facts
average error average error
average error
0.7 0
200
Number of accessed facts
a) b)
1,3 1,2 3,9 1.05 1,1 3,7 1 1 3,5 0.95 0,9 3,3 0.9 0,8 3,1 0.85 0,7 2,9 0.8 0,6 2,7 0.75 2,5 0
100 90 80 70 60 50 40 30 20
100
200
300
4 5 6 200Number 400of accessed 600 800 facts Numberofofaccessed accessedfacts facts Number
400
100 95 90 85 80 75 70 65 60 55 50
Fig. 5. Average error, standard deviation and coverage w.r.t. certainty for the ”year” attribute 0
100
200
300
Number of accessed facts
6.10
Discussion
400
0
100
200
300
Number of accessed facts 0.3
0.5
400
0
100
200
300
400
Number of accessed facts
0.7
The main contribution of this paper is to provide algorithms that are designed for user profiling using a partial social graph, and that can handle numeric attributes, provide certainty values and rely on rich information when available. In the experiments, it was shown that the proposed PGPI+ algorithms provide the best accuracy among the compared algorithms. A key reason is that more rich information is used by PGPI+, PGPI-G+ (e.g. groups, publications) and PGPI-N+ compared to other algorithms. A second important reason is that PGPI+ algorithms are lazy algorithms. They use local facts close to the node to be predicted to make a prediction rather than relying on a general training phase performed beforehand. From an implementation perspective, because PGPI+ algorithms are lazy algorithms, if they are used to performed several predictions, it is important to implement a caching mechanism to store facts accessed from the social network. The reason is that a same fact from the social network may be accessed to perform more than one prediction. In our implementation, we have implemented such a caching mechanism. It allows to perform less queries on the social network.
32
5,6 5,1 4,6 4,1 3,6 3,1 2,6 2,1 1,6 1,1 0,6
coverage
1,3 1,2 1,1 1 0,9 0,8 0,7 0,6
standard deviation
average error
a)
Dougnon, R. Y., Fournier-Viger, P., Lin, J.C.W., Nkambou, R. 0
200
400
600
800
0
Number of accessed facts
200
400
600
800
0.7 PGPI+
6 800
100 0
200 100
300
200
300
Number of accessed facts
Number of accessed facts
400 400
0
800
100 98 100 96 94 90 92 80 90 70 88 60 86 84 50 82 40 80 30
coverage coverage 100
200
300
400
Number of 100 accessed facts Number of accessed facts 0.50.7 PGPI-N+
0.3 0.5
200
3
0
standard deviation
4,5 4,3 4,1 3,9 3,7 3,5 3,3 3,1 2,9 2,7 02,5
average error
average error
Number of accessed facts Number of accessed facts
800
600
20 0
200
0.70.9
100
0 100 90 80 100 100 70 9098 60 80 96 70 50 6094 40 50 92 30 40 30 90 20
200
300
400
Number of100 accessed facts
200
Number of accessed facts
coverage coverage coverage
4.2 4.15 1,7 1,64.1 4.05 1,5 1,4 4 3.95 1,3 1,23.9 03.85 200 400 600 1,1 3.8 1 Number of accessed facts 4 400 5600 0 3 200
5,6 5,1 4,6 4,14.9 5 3,6 4.85 3,14,54 2,64.8 3,5 2,1 4.75 3 1,62,5 2 1,14.7 1,5 0,6 4.65 1 4.6 0,50
standard deviation standard deviation standard deviation
1,3 1,2 1,1 1 0,9 0,8 0,7 0,6
3,9 3,7 3,5 3,3 3,1 2,9 2,7 2,5
400
5,4 5,2 4.6 4.15 3.6 4,8 3.1 4,6 2.6 4,4 2.1 4,2 1.6 1.14 0.6 0 0
400
5,4 5,28,5 58 7,5 4,8 7 4,66,5 6 4,45,5 4,2 5 4,5 44 3,50
400
600
800
20 1088 0 0 3 0
5 facts Number4 of accessed
6 200 600 Number of400 accessed facts 0.9 800 0.5 0.7 Number 0.3 of accessed 0.5 facts 0.7 0.5 0.7 PGPI-G+
100
0.9
10098 9596 9094 8592 8090 7588 7086 6584 6082 5580 400 50 0 0 400
200
400
600
800
4 of accessed 5 Number facts 6 Number of400 accessed600 facts 800 200
Number of accessed facts
coverage coverage
300
200
Number of accessed facts
0.9
standard deviation
average error
a)
200
0 Number of accessed 100 facts 200 Number of accessed facts
average error average error
a)
100
standard deviation standard deviation
average averageerror error
3,9
1.05 3,7 1 3,5 0.95 3,3 0.9 3,1 0.85 2,9 0.8 2,7 0.75 2,5 0.70
0
Number of accessed facts 0.5
a)
100 90 80 70 60 50 40 30 20
100 0
200
300
100 Number of 200 accessed300 facts
Number of accessed facts
0.3
0.3
0.5
0.5
0.7
100 100
200 200
300 300
400 400
Number of accessed facts
Number of accessed facts
0.7
Fig. 6. Average error, standard deviation and coverage w.r.t. certainty for the ”age” attribute
7
Conclusion
User profile inference on online social networks is a key task for ad targeting and building social network that relies on social network data. However, current algorithms for user profiling suffer from one or more of the following limitations: (1) assuming that the full social graph is available for training, (2) not exploiting the rich information that is available in social networks such as group memberships and likes, (3) treating numeric attributes as nominal attributes, and (4) not assessing the certainty of their predictions. In this paper, we proposed an algorithm named PGPI+ for user profiling in online social networks that addresses these four limitations. An experimental evaluation with 31,247 user profiles from the Facebook and Pokec social networks shows that PGPI+ predicts user profiles with considerably more accuracy and by accessing a smaller part of the social graph than four state-of-the-art algorithms. Moreover, an interesting result is that profile attributes such as status (student/professor) and gender can be predicted with more than 95% accuracy using PGPI+. For future work, we will integrate additional improvements in PGPI+ and extend the proposed algorithms with text analysis capability. In terms of evaluation, we plan to perform experiments with other social networks and evaluate PGPI+ against more competitor algorithms, and integrate PGPI+ in a social
Inferring Social Network User Profiles
33
recommender system. Lastly, we also intend to develop algorithms for community detection [23, 28, 33].
References 1. Bhattacharya, P., Zafar, M. B., Ganguly, N., Ghosh, S., Gummadi, K. P.: Inferring user interests in the twitter social network. In: Proc. 8th ACM Conference on Recommender systems, pp. 357–360 (2014) 2. Bi, B., Shokouhi, M., Kosinski, M., Graepel, T.: Inferring the demographics of search users: social data meets search queries. In: Proc. 22nd Intern. Conf. on World Wide Web, pp. 131–140 (2013) 3. Blenn, N., Doerr, C., Shadravan, N., Van Mieghem, P.: How much do your friends know about you?: reconstructing private information from the friendship graph. In: Proc. of the Fifth Workshop on Social Network Systems, pp. 1–6. ACM (2012) 4. Bonchi, F., Castillo, C., Gionis, A., Jaimes, A.: Social network analysis and mining for business applications. ACM Transactions on Intelligent Systems and Technology, 2(3), 1–37 (2011) 5. Chaabane, A., Acs, G., Kaafar, M.A.: You are what you like! information leakage through users interests. In: Proc. of the 19th Annual Network and Distributed System Security Symposium, The Internet Society (2012) 6. Chaudhari, G., Avadhanula, V., Sarawagi, S.: A few good predictions: selective node labeling in a social network. In: Proc. of the 7th ACM international conference on Web search and data mining, pp. 353–362. ACM (2014) 7. Chen, P. T., Hsieh, H. P.: Personalized mobile advertising: Its key attributes, trends, and social impact. Technological Forecasting and Social Change, 79(3), 543–557 (2012) 8. Dahimene, R., Constantin, C., Du Mouza, C.:Recland: A recommender system for social networks. In: Proc. 23rd ACM Intern. Conf. on Information and Knowledge Management, pp. 2063–2065 (2014) 9. Davis Jr, C. A. et al.: Inferring the location of twitter messages based on user relationships. Transactions in GIS, 15(6), 735–751 (2011) 10. Dong, Y., Yang, Y., Tang, J., Yang, Y., Chawla, V. N.: Inferring user demographics and social strategies in mobile social networks. In: Proc. of the 20th ACM international conference on Knowledge discovery and data mining, pp. 15–24. ACM (2014) 11. Dougnon, Y. R., Fournier-Viger, P., Nkambou, R.: Inferring User Profiles in Social Networks using a Partial Social Graph. In: Proc. 28th Canadian Conference on Artificial Intelligence, Springer, LNAI 9091, pp. 84–99 (2015) 12. Gong, N. Z., Talwalkar, A., Mackey, L., Huang, L., Shin, E. C. R., Stefanov, E., Song, D.: Jointly predicting links and inferring attributes using a social-attribute network (san). Proc. 6th SNA-KDD Workshop (SNA-KDD12), Aug.12, 2012, Beijing, China (2011). 13. Huang, W., Weber, I., Vieweg, S.: Inferring nationalities of Twitter users and studying inter-national linking. In: Proc. 25th ACM conference on Hypertext and social media, pp. 237–242 (2014) 14. He, J., Chu, W. W., Liu, Z. V.: Inferring privacy information from social networks. In: Proc. of 2006 IEEE International Conference on Intelligence and Security Informatics. pp. 154–165. Springer, Heidelberg (2006) 15. Heatherly, R., Kantarcioglu, M., Thuraisingham, B.: Preventing private information inference attacks on social networks. IEEE Transactions on Knowledge and Data Engineering. 25(8), 1849–1862 (2013)
34
Dougnon, R. Y., Fournier-Viger, P., Lin, J.C.W., Nkambou, R.
16. Jurgens, D.: Thats what friends are for: Inferring location in online social media platforms based on social relationships. In: Proc. of the 7th International AAAI Conference on Weblogs and Social Media, pp 273–282, AAAI Press (2013) 17. Kong, X., Shi, X., Yu, P.S.: Multi-Label Collective Classification. In: Proc. 2011 SIAM International Conference on Data Mining, pp. 618-629 (2011) 18. Kosinski, M., Stillwell, D., Graepel, T.: Private traits and attributes are predictable from digital records of human behavior. National Academy of Sciences, 110(15), 5802–5805 (2013) 19. Li, R., Wang, C., Chang, K. C. C. User profiling in an ego network: co-profiling attributes and relationships. In: Proc. of the 23rd international conference on World wide web, pp. 819–830. ACM (2014) 20. Lindamood, J., Heatherly, R., Kantarcioglu, M., Thuraisingham, B.: Inferring private information using social network data. In: Proc. of the 18th international conference on World wide web, pp. 1145–1146. ACM (2009) 21. Mazhari, S., Fakhrahmad, S. M., Sadeghbeygi, H.: A user-profile-based friendship recommendation solution in social networks. Journal of Information Science, 41(3), 284–295(2015) 22. Mislove, A., Viswanath, B., Gummadi, K. P., Druschel, P.: You are who you know: inferring user profiles in online social networks. In: Proc. of the 3rd ACM international conference on Web search and data mining, pp. 251–260. ACM (2010) 23. Papadopoulos, S., Kompatsiaris, Y., Vakali, A., Spyridonos, P.: Community detection in social media. Data Mining and Knowledge Discovery, 24(3), 515–554 (2012) 24. Pennacchiotti, M., Popescu, A. M.: A Machine Learning Approach to Twitter User Classification. In: Proc. 5th Intern. AAAI Conf. on Weblogs and Social Media, 11(1), 281–288 (2011) 25. Petrovic, I., Perkovic, P., Stajduhar, I.: A profile-and community-driven book recommender system. In: 38th International Convention on Information and Communication Technology, Electronics and Microelectronics, pp. 631–635 (2015) 26. Quercia, D., Kosinski, M., Stillwell, D., Crowcroft, J.: Our Twitter profiles, our selves: Predicting personality with Twitter. In: Proc. of the 3rd IEEE international conference on social computing, pp. 180–185, IEEE Press (2011) 27. Scott, J., Carrington, P. J.: The SAGE handbook of social network analysis. SAGE publications (2011) 28. Takaffoli, M., Sangi, F., Fagnan, J., Z¨ aane, O. R.: Community evolution mining in dynamic social networks. Procedia-Social and Behavioral Sciences, 22, 49–58 (2011) 29. Tang, J., Yi, C., Huan, L.: Mining Social Media with Social Theories: A Survey. SIGKDD Explor. Newsl., 15(2), 20–29 (2013) 30. Traud, A. L., Mucha, P. J., Porter, M. A.: Social structure of Facebook networks. Physica A: Statistical Mechanics and its Applications. 391(16), 4165–4180 (2012) 31. Tiroshi, A., Kuflik, T., Kay, J., Kummerfeld, B.: Recommender systems and the social web. In: Proc. 19th international conference on Advances in User Modeling, pp. 60–70 (2012) 32. Tucker, C. E.: Social networks, personalized advertising, and privacy controls. Journal of Marketing Research, 51(5), 546–562 (2014) 33. Wakita, K.,Tsurumi, T.: Finding community structure in mega-scale social networks. In: Proc. 16th international conference on World Wide Web, pp. 1275–1276 (2007) 34. Varshney, U., Vetter, R.: A framework for the emerging mobile commerce applications. In: Proc. 34th Intern. Annual Hawaii Conf. on System Sciences, pp. 1–10 (2001)
Inferring Social Network User Profiles
35
35. Xu, D. J., Liao, S. S., Li, Q.: Combining empirical experimentation and modeling techniques: A design research approach for personalized mobile advertising applications. Decision Support Systems, 44(3), 710–724 (2008) 36. Vatanparast, R.: Piercing the fog of mobile advertising. In: Proc. Intern. Conf. on Management of Mobile Business, pp. 1–19 (2007) 37. Wang, X., Sukthankar, G.: Multi-label relational neighbor classification using social context features. In: Proc. 19th ACM SIGKDD Intern. Conf. on Knowledge Discovery and Data Mining, pp. 464–472 (2013) 38. Al Zamal, F., Liu, W., Ruths, D.: Homophily and Latent Attribute Inference: Inferring Latent Attributes of Twitter Users from Neighbors. In: Proc. 6th Intern. AAAI Conf. on Weblogs and Social Media (2012) 39. Zhao, Z., Cheng, Z., Hong, L., Chi, E.H.: Improving User Topic Interest Profiles by Behavior Factorization. In: Proc. 24th Intern. Conf. on World Wide Web, pp. 1406– 1416 (2015) 40. Zhao, Y., Wang, G., Yu, P. S., Liu, S., Zhang, S.: Inferring social roles and statuses in social networks. In: Proc. of the 19th ACM SIGKDD Intern. Conf. on Knowledge Discovery and data mining, pp. 695–703 (2013) 41. Zhong, Y., Yuan, N. J., Zhong, W., Zhang, F., Xie, X.: You are where you go: Inferring demographic attributes from location check-ins. In: Proc. 8th ACM Intern. Conf. on Web Search and Data Mining, pp. 295–304 (2015) 42. Zhou, X., Xu, Y., Li, Y., Josang, A., Cox, C.: The state-of-the-art in personalized recommender systems for social networking. Artificial Intelligence Review, 37(2), 119–132 (2012)
Acknowledgement This work is financed by a National Science and Engineering Research Council (NSERC) of Canada research grant.