influence of aeration rate and liquid temperature on ammonia ...
Recommend Documents
Shooting speed of camera is 5000 frames per second at full-screen scanning (1280 Ã 1024 resolution, 10 ... zhidkosti s vyisokotemperaturnoy stenkoy: Ph.D. thesis in Engineering Science, â Moscow, 2007. â. 212 p. ... Izvestiia. 10, 13 (2012).
N AT ION A L LA I3 0 R AT0 RY. Los Alamos National Laboratory, an affirmative action/equal opportunity employer, is operated by the University of California for ...
Influence of temperature on the differential capacitance of ionic liquid electrolytes on charged surfaces. Jenel Vatamanu*a, Lidan Xingb, Weishan Lib, Dmitry ...
Aeration rate and detention time are two of the important parameters in TAD ... were to investigate the effects of various aeration rates and detention time on.
ABSTRACT: Tilapia, Oreochromis niloticus, (Linneaus, 1758) is an im- portant aquaculture species in Nigeria and other parts of the world. We obtained ...
ment rate over the whole temperature range and extrapolation or subjective vertical cutoff of the rate function in rate summation for varying temperatures.
FOUNDRY ENGINEERING. Published quarterly as the organ of the Foundry Commission of the Polish Academy of Sciences ..... experimental data, J. Phys.
Peppelenbos and Leven (1996) presented two hypotheses that could occur during the respiratory process. The first hypothesis is that the available substrate ...
glass pipette whose tip extended just above the bottom of the test tube. Immediately following aeration (0 h), the semen samples were further divided into 3 test ...
wastewater with high ammonium concentrations or low C/N ratios are treated. Nitritation can ... brought to the recent developement of the SHARON process for ...
Aug 9, 2010 - In bread and bakery industry, ... bread volume, and shelf life (Romanowska et al.,. 2003). ... culture can be ensured by agitation and aeration of.
Jun 3, 2014 - All cultures were grown at 37°C with constant aeration (225 rpm) and growth (OD600), and pHs were measured at hourly intervals for 12 h. For ... 1H dimension and a total of 64 data points with a spectrum width of. 140.00 ppm in the ....
Nov 5, 2013 - but no difference was found among different N forms. Despite higher urease ... Introduction. Nitrogen (N) is an essential element and is one of the most .... NaNO3 for the Ni treatment, and NH4NO3 for the AN treat- ment. The two ... wer
Ammonia-based aeration control of the activated sludge process can lead ... flow designs; more often than not, the effluent shows some .... control structures are discussed later. ... (1) a cascade controller is used where the ammonia controller.
influence of deposition temperature on the growth of the films and phase ... XRD pattern is recorded for NiTi films deposited at substrate temperature of 300 °C ...
Key words: Ruppia drepanensis, ammonia toxicity, temperature effects, photosynthesis, growth. Abstract. In a laboratory experiment, Ruppia drepanensis Tineo ...
meteorological data for the period under the study and its influence on seed ... on germination percentage (ISTA 1993) seedling length, vigour index (Abdul.
Jan 8, 2011 - David B. Bunnell & J. Jeffery Isely. To cite this article: David ... Suture failure (Meyers et al. 1992), incision .... Shielded-needle technique for sur-.
Aug 18, 2016 - Background: Since heart rate variability (HRV) is associated with average heart rate (HR) and respiratory rate (RespRate), alterations in these ...
THe unique features of tHe Spar7 PLasMa Sintering (SPS) tecHnique were used to ... MiLLing of Ni for 20Hrs was found to be producing Larger coLd weLded ...
ABSTRACT. Among the traditional herbs and spices, cinnamon bark oil (Cinnamon cassia) and Murraya koenigii commonly known as curry leaf oil have had ...
changeâ as more serious while Democrats rank âglobal warmingâ as more .... keyword search to track linguistic patterns based on training by human coders. To.
study is to assess how change in temperature and soil moisture affect biochemical biomarkers in ..... tion mixture contained CDNB (1 mM), GSH (25 mM), and sample (S9). ... served, a three-way ANOVA was used to detect whether pesticide.
Williams, Edwards, and Uribe, 1982), and Nerium oleander L. (Berry and ... on the kinetics of light activation in intact leaves of white clover and relates the results ...
influence of aeration rate and liquid temperature on ammonia ...
Co., Valley Forge, Pa.). In operation, the manure temperature in each column was controlled continuously by the tempera- ture sensor connected to the ...
INFLUENCE OF AERATION RATE AND LIQUID TEMPERATURE ON AMMONIA EMISSION RATE AND MANURE DEGRADATION IN BATCH AEROBIC TREATMENT K. J. Park, J. Zhu, Z. Zhang ABSTRACT. The influence of aeration rates (26, 63, and 100 mg O2 g VS−1 min−1) at different temperatures (5°C, 15°C, and 25°C) on ammonia emission and breakdown of organic materials was studied using 15.3 L batch reactors for 21 days. The removal of total Kjeldahl nitrogen (TKN) ranged from 9.7% to 37.7% during the experiment, with higher values corresponding to higher manure temperatures and aeration rates. Ammonia loss ranged from 0.7% to 25.8% of initial TKN and increased with increase in manure temperature and aeration rate. In a similar pattern, the ratio of volatilized ammonia gas to removed TKN varied from 6.5 to 68.5. In addition, high BOD5 removal was also observed when both the temperature and the aeration rate were high, with the exception for airflow rates between 26 and 63 mg O2 g VS−1 min−1 for the manure at temperatures between 5°C and 15°C. The combinations of high aeration rate (100 mg O2 g VS−1 min−1) with low temperature (5°C) or low aeration rate (26 mg O2 g VS−1 min−1) with high temperature (15°C to 25°C) were found to be desirable to reduce ammonia emission while still achieving satisfactory BOD5 removal at the same time. Keywords. Aeration, Ammonia emission, BOD, Nitrogen loss, Swine manure.
R
aising pigs in confinement facilities has increased in recent years, resulting in massive manure production that impacts soil−water ecology and deteriorates air quality due to gaseous emissions. Because the land that receives manure is limited in many places in the U.S., reducing the nutrient content in manure becomes necessary to avoid potential soil and water pollution as a result of excessive nutrient loading in land. Aerobic treatment of manure can effectively break down organic compounds, but it may also cause unwanted side effects such as ammonia emission, which is a major concern because of air pollution as well as the nitrogen loss in the manure (Dewes, 1999). It has been reported that aerobic treatment can potentially incur high ammonia emission by stripping out ammonia from uncontrolled or excessively aerated slurry (Burton, 1992). Ammonia emission in aerobic treatment systems is influenced by many factors such as manure properties (total solid, pH, etc.), manure temperature, and aeration rate (Loynachan et al., 1976; Dewes, 1999; Arogo et al., 1999). As manure temperature increases, the viscosity and density of the manure decrease, leading to increased diffusivity of the
Article was submitted for review in January 2004; approved for publication by the Structures & Environment Division of ASAE in October 2004. The authors are Keum J. Park, ASAE Member Engineer, Visiting professor from Sunchon National University, Republic of Korea, Jun Zhu, ASAE Member Engineer, Associate Professor, and ZhiJian Zhang, Post−Doctoral Associate, Department of Biosystems and Agricultural Engineering, Southern Research and Outreach Center, University of Minnesota, Waseca, Minnesota. Corresponding author: Jun Zhu, University of Minnesota, Southern Research and Outreach Center, 35838 120th St., Waseca, MN 56093; phone: 507−837−5625; fax: 507−835− 3622; e−mail: [email protected].
solutes in the liquid, which promotes ammonia emission (Arogo et al., 1999). Arogo et al. (1999) also reported that the ammonia release from swine manure without aeration increased with temperature. Practically, when liquid manure is treated using continuous or intermittent aeration, the ambient temperature, which may change constantly, is not controlled. In addition, the organic matter in manure is biodegraded by various microorganisms that are subject to fluctuations in manure temperature (psycrophilic, mesophilic, and thermophilic) and oxygen content (aerobic, facultative, and anaerobic). Therefore, it is desirable to determine aeration conditions with respect to manure properties and temperature so that ammonia volatilization, biodegradation performance, and energy consumption for aeration can be optimized. This study was intended to investigate the influence of aeration rate and manure temperature on ammonia emission and organic matter biodegradation during batch aerobic treatment of swine manure.
MATERIALS AND METHODS MANURE SOURCE The manure used for the experiment was collected from the shallow pit of a swine finishing barn (located at the University of Minnesota Southern Research and Outreach Center at Waseca) and then diluted with tap water to 2% TS. The barn was equipped with a pull−plug manure handling system that emptied the manure in the shallow pit every two weeks. The pigs were fed on a regular corn/soybean ration consisting of 71.7% maize, 25.0% soya bean meal, 1.0% tallow, 0.8% dicalcium phosphate, 0.25% vitamin/mineral premix, 0.8% CaCO3, and 0.5% salt. The physical, chemical, and biological properties of the raw manure are presented in table 1.
Transactions of the ASAE Vol. 48(1): 321−330
E 2005 American Society of Agricultural Engineers ISSN 0001−2351
321
pH
TS (g L−1)
6.88
19.3
Table 1. Physical, chemical, and biological properties of raw manure. TVS TKN NH4+−N BOD5 VFAs ORP (Eh) −1 −1 (g L ) (mg N L ) (mg N L−1) (mg L−1) (mg L−1) (mV) 12.2
3055
2150
11100
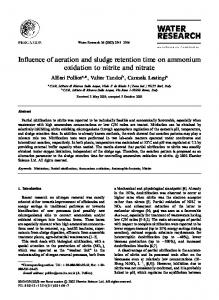
EXPERIMENTAL APPARATUS The experimental apparatus was composed of nine PVC columns (reactors), each measuring 914 mm in height and 153 mm in internal diameter (fig. 1). The sampling port on each column was located 381 mm from the bottom. To control manure temperature, the columns were placed in a water basin filled with ice cubes to keep the temperature below 5°C. Each column had a separate heating system consisting of a temperature sensor located in the middle of the liquid, a temperature controller (model A−94460−45, Cole− Parmer Instrument Company, Vernon Hills, Ill.), and a heating probe (Water heater screw−in element, John Wood Co., Valley Forge, Pa.). In operation, the manure temperature in each column was controlled continuously by the temperature sensor connected to the controller, which operated the heating probe immersed in the manure. Air was supplied to individual reactors by an air compressor (2 HP peak, model VS401103AJ, Campbell Hausfeld), and the airflow rate to each reactor was controlled using an airflow meter (0.1 to 1 LPM, Catalog No. A−32460−42, or 0.4 to 5 LPM, Catalog No. A−32460−44, Cole−Parmer Instrument Company, Vernon Hills, Ill.). EXPERIMENTAL PROCEDURE The experiment was conducted for 21 days (May 20 to June 10, 2003) in a building where air temperature was
6527
−166
TP (mg P L−1)
DRP (mg P L−1)
421.3
385.7
controlled no lower than 7.2°C. Each reactor was initially filled with the diluted raw manure up to 762 mm (14 L), leaving a headspace for managing scum. Three temperatures (5°C, 15°C, and 25°C) were examined against three airflow rates (26, 63, and 100 mg O2 g VS−1 min−1), which constituted a 3 × 3 factorial design. The three airflow rates chosen in this study were intended to cover a range of oxygen transfer rates from 24 to 120 mg O2 L−1 h−1 to promote the biodegradation of solids in manure (Ginnivan, 1983). However, the actual oxygen transfer rates were unknown in this study since no measurements were taken. The manure pH and oxidation−reduction potential (ORP) were measured daily at the center of each reactor using a pH and ORP meter (Digi−Sense pH/mV/ORP meter, Catalog No. P−05938−10, Cole−Parmer Instrument Company, Vernon Hills, Ill.). The ammonia in the exhaust air during aeration was captured using a boric acid solution, which was proved effective by past researchers (Loynachan et al., 1976; Ginnivan, 1983). The procedure used in this study employed two plastic bottles (250 and 150 mL) connected in series for double collection of ammonia emitted from each reactor by absorbing it in the boric acid solution contained in the two bottles. Quantities of 150 and 50 mL of 4.0% saturated boric acid solution with an indictor (Kjel−sorb, Fisher Scientific) were placed in the first and second bottles, respectively. In the first 13 days of the experiment, only boric acid was used for both collection
Heating probe
ORP and pH sensor
Temp. controller & sensor
Manure port Airflow rate
Air compressor
Exhaust air
Boric acid 914
Sampling port 762
381
153 Unit : mm Figure 1. Schematic of the reactor (all units in mm).
322
TRANSACTIONS OF THE ASAE
phosphorus (TP), dissolved reactive phosphorus (DRP), total solids (TS), and total volatile solids (TVS) were determined for all samples using the Standard Methods (APHA, 1998). The concentration of ammonium was measured at a wavelength of 490 nm using a DR/3000 spectrophotometer (Hach Company, 1993).
bottles, while in the next 8 days, 0.5 M sulfuric acid was used for all the second collection bottles due to unexpected shortage of boric acid. The absorbent solution (boric and sulfuric acid) was sampled and analyzed every 24 h for NH4+−N concentration using a Kjeldahl nitrogen analyzer to determine the daily ammonia emission. As two columns, aerated at 63 and 100 mg O2 g VS−1 min−1 at 25°C, suffered from manure losses (1 or 2 L maximum) due to overflow in the early stage of the experiment, the same quantities of diluted raw manure were added to those columns on the 6th day of operation. No manure was added to other columns because the loss of liquid from those columns was considered insignificant. For chemical analysis, manure samples of 100 mL were taken from each reactor every day during the first 7 days, and every other day during the rest of the experimental period. After sampling, all the samples were kept frozen and were only thawed to the room temperature when they were analyzed. Total Kjeldahl nitrogen (TKN), biochemical oxygen demand (BOD5), volatile fatty acids (VFA), total
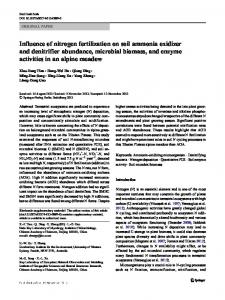
RESULTS AND DISCUSSION MANURE pH The manure pH increased dramatically from the initial value of 6.9 to a range of 8.3 to 8.6 on the first day of aeration for all columns, and continued to increase gradually to a range of 8.7 to 9.1 thereafter (fig. 2), showing a similar tendency to that observed in previous research by Zhu et al. (2001). For manure at temperatures of 5°C and 15°C, the pH values slightly increased with increase in aeration rates except for a period from day 10 to 15. For manure at 25°C, there was no difference in pH between airflow rates of 63 and
9.0 8.5
pH
8.0
5 oC
26 µg O2/g VS/min 63 µg O2/g VS/min
7.5
100 µg O2/g VS/min
7.0 6.5 0
2
4
6
8
10
12
14
16
18
20
22
Time (days) 9.0
pH
8.5 8.0
15 oC
26 µg O2/g VS/min 63 µg O2/g VS/min
7.5
100 µg O2/g VS/min
7.0 6.5 0
2
4
6
8
10
12
14
16
18
20
22
Time (days) 9.0 8.5 8.0
26 µg O2/g VS/min
25 oC
pH
63 µg O2/g VS/min 7.5
100 µg O2/g VS/min
7.0 6.5 0
2
4
6
8
10
12
14
16
18
20
22
Time (days) Figure 2. pH variations at different temperatures and aeration rates during batch aerobic treatment of swine manure.
Vol. 48(1): 321−330
323
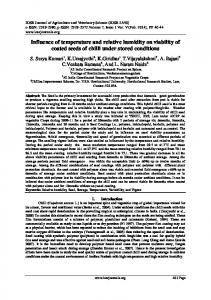
and to the maximum value of 216 mV (5°C, 100 mg O2 g VS−1 min−1) on the first day and started to decrease gradually, possibly due to the increased microbial activity in manure biodegradation (fig. 3). Little difference in ORP was observed in response to different aeration rates until day 12 for manure at temperatures of 5°C and 25°C. The ORP decreased with increase in manure temperature, which was anticipated because temperature rises would militate against the solubility of oxygen in the manure. In addition, the increasing respiration of microorganisms in manure at raised liquid temperatures would lead to decline of ORP (Hissett et al., 1982). From the second day, the oxygen demand by microorganisms probably exceeded the oxygen supply by aeration for all columns, as indicated by the decreases in ORP in the treated manure. However, from day 13 to 17, the ORPs with 100 mg O2 g VS−1 min−1 of aeration for all the
100 mg O2 g VS−1 min−1. Passing air through the manure purged CO2 out of the liquid and therefore caused the pH to rise. The pH increased more at the higher aeration rate, which could be attributed to an increased rate of organic matter degradation and urea hydrolysis, leading to increased ammonia production (Stevens and Cornforth, 1974). MANURE ORP VARIATIONS An aeration level can be defined as the concentration of dissolved oxygen (DO) maintained in the manure. However, for DO levels less than 10% of the saturation concentration, ORP is typically used instead. The levels of DO from 1% to 10% of the saturation concentration correspond to ORPs from +150 to +400 mV (Burton, 1992). In this study, the manure ORP rose from the initial value of −166 mV to the minimum value of −72 mV (25°C, 63 mg O2 g VS−1 min−1) 300
26 µg O2/g VS/min 63 µg O2/g VS/min
200 ORP (mV)
5 oC
100 µg O2/g VS/min
100 0 −100 −200 0
2
4
6
8
10
12
14
16
18
20
22
16
18
20
22
16
18
20
22
Time (days) 250
63 µg O2/g VS/min
150 ORP (mV)
15 oC
26 µg O2/g VS/min 100 µg O2/g VS/min
50 −50 −150 −250 0
2
4
6
8
10
12
14
Time (days) 26 µg O2/g VS/min
250
63 µg O2/g VS/min 100 µg O2/g VS/min
150 ORP (mV)
25 oC
50 −50 −150 −250 0
2
4
6
8
10
12
14
Time (days) Figure 3. ORP changes in the manure with different aeration rates and different liquid manure temperatures during batch aerobic treatment of swine manure.
324
TRANSACTIONS OF THE ASAE
temperatures and with 63 mg O2 g VS−1 min−1 of aeration for 15°C started to increase, indicating a slowdown in biological activity in the manure, possibly due to substrate depletion. An anomaly was observed in the ORP readings at 15°C and 25°C around days 15 and 16 where a steep drop in ORP occurred, which could not be explained based on the available information in this study and could be a result of measurement error. TKN AND AMMONIA EMISSION The concentrations of TKN in the manure decreased during treatment, as shown in figure 4. The TKN reductions due to increase in aeration rate in the manure at 25°C were more pronounced than in the manure at 5°C. The percent decrease of TKN during the experiment varied from 9.7% to 37.7% (fig. 5), which was similar to the data reported by Luo et al. (2002), in which 26.5% of TKN was removed during 15 days of aeration at 22°C with an airflow rate of 66.7 mL
min−1 L−1 (approximately at 31 mg O2 g VS−1 min−1). In this experiment, NO2−N and NO3−N were not measured, so the degree to which nitrification developed could not be determined. In general, if the oxygen level in the manure is sufficient for microbial activity, then nitrification that converts ammoniacal nitrogen to NO2−N and NO3−N will proceed during the treatment. On the other hand, if the aeration level is kept close to the minimum for nitrifying activity, then denitrification may occur (Smith and Evans, 1982). The daily ammonia (NH3−N) emission showed different values for different temperatures and aeration rates, as shown in figure 6. Higher NH3−N emissions came with higher temperatures and aeration rates, which was in agreement with the comments made by Dewes (1999) in that the dissociation equilibrium between NH4+ and NH3 would shift to NH3 at higher temperatures, resulting in more NH3−N emission. For aeration at 26 mg O2 g VS−1 min−1 at all
Figure 4. TKN changes in the manure with different aeration rates and different liquid manure temperatures during batch aerobic treatment of swine manure.
Manure temperature (°C) Figure 5. TKN removal from swine manure after 21−day batch aerobic treatment at different aeration rates and manure temperatures.
Time (days) NH3−N emission (mg/L/day) NH (mg/L/day) 3 −N emission
40
15 oC 26 µg O2/g VS/min
30
63 µg O2/g VS/min 100 µg O2/g VS/min
20
10 0 0
2
4
6
8
10
12
Time (days)
NH3 N emission (mg/L/day)
80
25 oC
60
26 µg O2/g VS/min
40
100 µg O2/g VS/min
63 µg O2/g VS/min
20 0 0
2
4
6
8
10
12
14
16
18
20
22
Time (days) Figure 6. Daily NH3−N emissions at different aeration rates and manure temperatures during batch aerobic treatment of swine manure.
326
TRANSACTIONS OF THE ASAE
temperatures and 63 mg O2 g VS−1 min−1 at 15°C, the daily NH3−N emissions featured a relatively constant value, while the rest increased with time during the experiment. It was found that NH3−N emission would increase with an increase in manure pH, with a relationship close to 2nd−order polynomial at all temperatures (fig. 7). In a study on the diet influence on pH and NH3−N emission, it was also reported that the NH3−N emission was reduced by 53% when the manure pH was lowered by 0.8 (Canh et al., 1998). During the experiment, the manure overflowed on some days, so the corresponding NH3−N emission data for those days were lost. To obtain the cumulative emission, each missing data point due to overflow was represented by the average of the two data points collected before and after the missing day. For the manure temperature of 5°C, the cumulative NH3−N emissions during 21 days were 20, 115, and 161 mg L−1 for aeration rates of 26, 63, and 100 mg O2 g VS−1 min−1, respectively, while for 15°C and 25°C, those values were 87, 236, and 418 mg L−1, and 204, 499, and
788 mg L−1 (fig. 8). The ratios of the cumulative NH3−N emission to the initial TKN ranged from 0.7% to 25.8%, usually less than 8% for all treatments except for those with airflow rates of 63 mg O2 g VS−1 min−1 at 25°C and 100 mg O2 g VS−1 min−1 at 15°C and 25°C (fig. 9). These values were a little lower than the results of Loynachan et al. (1976), in which 16% to 26% of the total nitrogen was evolved as NH3−N gas during 83 days of aeration for swine slurry (TS levels of 1.5% to 3.0%) with airflow rates from 0.5 to 1.5 L min−1 (42 to 88 mg O2 g VS−1 min−1) at 25°C. Clearly, more ammonia gas would volatilize from manure at higher temperatures and higher aeration rates. The ratios of the cumulative NH3−N emission to the removed TKN during the experiment ranged from 6.5% to 68.5%. According to this study, ammonia emission represented a major portion of nitrogen loss for manure at higher temperature and higher aeration, but represented a relatively small portion for manure at lower temperature and lower aeration (fig. 9).
Figure 7. Relationships between pH and NH3−N emission at different temperatures during batch aerobic treatment of swine manure.
Vol. 48(1): 321−330
327
Cumulative NH3−N emission (mg/L)
BOD5 CHANGES DURING THE TREATMENT The BOD5 level remained almost unchanged at an initial value of 11,100 mg L−1 for all columns in the first 3 days (fig. 10) but started to decrease abruptly for the manure treated with high aeration from day 5 to 7. At 5°C, the BOD5 levels in the manure with airflow rates of 26 and 63 mg O2 g VS−1 min−1 only decreased slightly to 10,050 and 9,450 mg L−1, respectively, at the end of study, and there was little difference between the two treatments. However, the final BOD5 level at the aeration rate of 100 mg O2 g VS−1 min−1 reached 6,000 mg L−1, showing a clear enhancement in BOD5 removal as opposed to the two lower aeration rates. For manure at 15°C, the BOD5 level with aeration rate of 26 mg O2 g VS−1 min−1 remained almost unchanged until day 18 and then was reduced to 7,050 mg L−1 at the end of experiment (day 20). In contrast, a reduction in BOD5 was
5 oC
200
26 µg O2/g VS/min
160
63 µg O2/g VS/min
120
100 µg O2/g VS/min
80 40 0
Cumulative NH3−N emission (mg/L)
0
2
4
6
8
10
12
14
16
18
20
22
Time (days) 15 oC
500 400
26 µg O2/g VS/min
300
100 µg O2/g VS/min
63 µg O2/g VS/min
200 100 0 0
Cumulative NH3−N emission (mg/L)
observed on day 10 for aeration rate of 63 mg O2 g VS−1 min−1, with a final BOD5 level of 6,900 mg L−1. Increasing the aeration rate apparently incurred an early reduction in BOD5. For the aeration rate of 100 mg O2 g VS−1 min−1, the BOD5 level in the manure was distinctly reduced to 2,550 mg L−1 at the end of the experiment, clearly showing the effect of aeration rate on BOD5 removal as compared to the two lower rates. At 25°C, the end BOD5 levels for aeration rates of 26, 63, and 100 mg O2 g VS−1 min−1 were 5,100, 2,550 and 1,200 mg L−1, respectively. Although it varied from 9.5% to 89.2%, the BOD5 removal increased by 4.8 times (from 9.5% to 45.9%) for the manure at 5°C, and by 1.6 times (from 54.1% to 89.2%) for the manure at 25°C, as the aeration rate increased from 26 to 100 mg O2 g VS−1 min−1 (fig. 11). Therefore, the effect of aeration rate increase on BOD5 removal appears to be greater at lower temperatures.
2
4
6
8
10
12
14
16
18
20
22
Time (days) 25 oC
800
26 µg O2/g VS/min
600
63 µg O2/g VS/min 100 µg O2/g VS/min
400 200 0 0
2
4
6
8
10
12
14
16
18
20
22
Time (days) Figure 8. Cumulative NH3−N emissions at different aeration rates and for different liquid manure temperatures during batch aerobic treatment of swine manure.
Figure 9. Ratios of cumulative NH3−N emissions to (a) the initial TKN and (b) TKN reduction at different aeration rates and manure temperatures during batch aerobic treatment of swine manure.
BOD5 levels (mg/L)
12000 10000 8000 5 oC
6000 4000
26 µg O2/g VS/min
2000
100 µg O2/g VS/min
63 µg O2/g VS/min
0 0
2
4
6
8
10
12
14
16
18
20
22
14
16
18
20
22
14
16
18
20
22
Time (days)
BOD5 levels (mg/L)
12000 10000 8000 15 oC
6000 4000
26 µg O2/g VS/min
2000
63 µg O2/g VS/min 100 µg O2/g VS/min
0 0
2
4
6
8
10
12
Time (days)
BOD5 levels (mg/L)
12000 10000 8000 25 oC
6000 4000
26 µg O2/g VS/min 63 µg O2/g VS/min
2000
100 µg O2/g VS/min
0 0
2
4
6
8
10
12
Time (days) Figure 10. BOD5 changes in the manure at different aeration rates and manure temperatures during batch aerobic treatment of swine manure.
Manure temperature (°C) Figure 11. BOD5 removal at different aeration rates and manure temperatures during batch aerobic treatment of swine manure.
CONCLUSION The manure pH increased rapidly from the initial value of 6.9 to a range of 8.3 to 8.6 on the first day of aeration, followed by a slow increase to a range of 8.7 to 9.1 over the 21−day experimental period. The ORP also increased rapidly on the first day; however, it decreased from day 2 to 12, possibly because the oxygen consumption by microbial activity surpassed the oxygen transfer by aeration. After two weeks, the ORP rebounded greatly for manure with higher aeration rates, indicating a decrease of microbial activity, possibly due to depletion of substrates. Higher ammonia volatilization occurred when temperature, pH, and aeration rate increased. Daily NH3−N emission increased for the medium (63 mg O2 g VS−1 min−1) and high (100 mg O2 g VS−1 min−1) aeration rates, while remaining relatively constant for the low aeration rate (26 mg O2 g VS−1 min−1). The ratios of the cumulative NH3−N emission to the initial TKN ranged from 0.7% to 25.8%, with higher values corresponding to higher temperatures and aeration rates. The ratios of the cumulative NH3−N emission to the removed TKN after the 21−day treatment ranged from 6.5% to 68.5%. As the manure temperature and aeration rates increased, the ratio of NH3−N loss to TKN reduction increased. The BOD5 removal was different for different aeration rates at temperature of 25°C but was similar at temperatures of 5°C and 15°C between the aeration rates of 26 and 63 mg O2 g VS−1 min−1. Increasing aeration had a greater effect on BOD5 removal for liquid manure at the low temperature than at the high temperature. Considering NH3−N emission control (less than 8% of initial TKN) and BOD5 removal efficiency, using a higher aeration rate (100 mg O2 g VS−1 min−1 in this case) to treat manure at a lower temperature (5°C), or vice versa (26 mg O2 g VS−1 min−1 and 15°C to 25°C), was desirable.
330
ACKNOWLEDGEMENT This project was funded by the Sunchon National University of Korea under the Overseas Study Program for Professors and by the University of Minnesota Agricultural Experiment Station.
REFERENCES APHA. 1998.S tandard Methods for the Examination of Water and Waste. 20th ed. Washington, D.C.: American Public Health Association. Arogo, J., R. H. Zhang, G. L. Riskowski, L. L. Christianson, and D. L. Day. 1999. Mass transfer coefficient of ammonia in liquid swine manure and aqueous solutions. J. Agric. Eng. Res. 73(1): 77−86. Burton, C. H. 1992. A review of the strategies in the aerobic treatment of pig slurry: Purpose, theory, and method. J. Agric. Eng. Res. 53(3): 249−272. Canh, T. T. A. J. A. Aarnink, M. W. A. Verstegen, and J. W. Schrama. 1998. Influence of dietary factors on the pH and ammonia emission of slurry from growing−finishing pigs. J. Anim. Sci. 76(4): 1123−1130. Dewes, T. 1999. Ammonia emission during the initial phase of microbial degradation of solid and liquid cattle manure. Bioresource Tech. 70(3): 245−248. Ginnivan, M. J. 1983. The effect of aeration rates on odour and solids of pig slurry. Agric. Wastes 7(4): 197−207. Hach Company. 1993. Procedure Manual. Loveland, Colo.: Hach Co. Hissett, R., E. A. Deans, and M. R. Evans. 1982. Oxygen consumption during batch aeration of piggery slurry at temperatures between 5 and 50°C. Agric. Wastes 4(6): 477−487. Loynachan, T. E., W. V. Bartholomew, and A. G. Wollum. 1976. Nitrogen transformation in aerated swine manure slurries. J. Environ. Qual. 5(3): 293−297. Luo, A., J. Zhu, and P. M. Ndegwa. 2002. Removal of carbon, nitrogen, and phosphorus in pig manure by continuous and intermittent aeration at low redox potentials. Biosystems Eng. 82(2): 209−215. Smith, M. P. W., and M. R. Evans. 1982. The effects of low dissolved oxygen tension during the aerobic treatment of piggery slurry in completely mixed reactors. J. Appl. Bacteriol. 53: 117−126. Stevens, R. J., and I. S. Cornforth. 1974. The effect of aeration on the gases produced by slurry during storage. J. Sci.Food Agric. 25: 1249−1261. Zhu, J., A. Luo, and P. Ndegwa. 2001. Raising pH by low−level aeration for soluble phosphorus removal of swine manure. Trans. ASAE 44(2): 391−396.