Earth’s Future RESEARCH ARTICLE 10.1002/2015EF000317 Key Points: • Scenarios of 21st-century trans-Arctic shipping are presented for 10 global climate models • Projected shipping viability of Arctic routes depends critically on model choice • Central Arctic routes will gradually displace Northern Sea Route
Corresponding authors: S. R. Stephenson,
[email protected]; L. C. Smith,
[email protected]
Citation: Stephenson, S. R., and L. C. Smith (2015), Influence of climate model variability on projected Arctic shipping futures, Earth’s Future, 3 331–343, doi:10.1002/2015EF000317.
Received 11 AUG 2015 Accepted 15 OCT 2015 Accepted article online 24 OCT 2015 Published online 24 NOV 2015
Influence of climate model variability on projected Arctic shipping futures Scott R. Stephenson1 and Laurence C. Smith2,3 1 Department of Geography, University of Connecticut, Storrs, Connecticut, USA, 2 Department of Geography, University
of California, Los Angeles, California, USA, 3 Department of Earth, Planetary & Space Sciences, University of California, Los Angeles, California, USA
Abstract Though climate models exhibit broadly similar agreement on key long-term trends, they have significant temporal and spatial differences due to intermodel variability. Such variability should be considered when using climate models to project the future marine Arctic. Here we present multiple scenarios of 21st-century Arctic marine access as driven by sea ice output from 10 CMIP5 models known to represent well the historical trend and climatology of Arctic sea ice. Optimal vessel transits from North America and Europe to the Bering Strait are estimated for two periods representing early-century (2011–2035) and mid-century (2036–2060) conditions under two forcing scenarios (RCP 4.5/8.5), assuming Polar Class 6 and open-water vessels with medium and no ice-breaking capability, respectively. Results illustrate that projected shipping viability of the Northern Sea Route (NSR) and Northwest Passage (NWP) depends critically on model choice. The eastern Arctic will remain the most reliably accessible marine space for trans-Arctic shipping by mid-century, while outcomes for the NWP are particularly model-dependent. Omitting three models (GFDL-CM3, MIROC-ESM-CHEM, and MPI-ESM-MR), our results would indicate minimal NWP potential even for routes from North America. Furthermore, the relative importance of the NSR will diminish over time as the number of viable central Arctic routes increases gradually toward mid-century. Compared to vessel class, climate forcing plays a minor role. These findings reveal the importance of model choice in devising projections for strategic planning by governments, environmental agencies, and the global maritime industry. 1. Introduction
© 2015 The Authors.
As the Arctic Ocean transitions toward a seasonally ice-free state, efforts to predict new connections between the Arctic and the global economy are underway. Record lows in September sea ice extent from 2007 to 2014 [NSIDC, 2014] have recast Arctic shipping routes as emerging international seaways for export of resources and as potential alternative pathways for north Atlantic-north Pacific trade, owing to their significant distance savings (35–60%) over the Suez or Panama Canals [AMSA, 2009]. Despite a clear trend toward greater marine accessibility in the Arctic [Khon et al., 2010; Stephenson et al., 2013], the economic viability of Arctic routes is constrained not only by significant ice variability and shallow bathymetry [Stephenson et al., 2014], but also by numerous economic (commodity prices, shipping schedules, port infrastructure, insurance premiums), and regulatory (icebreaker fees, ice-class vessel requirements, national, and international governance regimes) considerations [AMSA, 2009; Somanathan et al., 2009; Verny and Grigentin, 2009; Liu and Kronbak, 2010; Lasserre and Pelletier, 2011; Schøyen and Bråthen, 2011; Stephenson, 2012; Brigham, 2013; Smith and Stephenson, 2013; Farré et al., 2014; Lasserre, 2014; Pizzolato et al., 2014; Sarrabezoles et al., 2014]. The relative importance of these factors and the degree to which they represent impediments to shipping is a subject of active academic and political debate, with some leading figures projecting optimism [Bryanski, 2011; Restino, 2013] and others taking a more measured view [Brigham, 2010; Lasserre and Pelletier, 2011; Carmel, 2013; Farré et al., 2014].
This is an open access article under the terms of the Creative Commons Attribution-NonCommercial-NoDerivs License, which permits use and distribution in any medium, provided the original work is properly cited, the use is non-commercial and no modifications or adaptations are made.
These uncertainties have large potential implications for planning future marine activities in the Arctic. Scientific, government, and industry groups have therefore identified a need for improved seasonal and long-term forecasting of shipping potential for strategic planning and decision-making. In the United States, two research objectives outlined in the President’s Implementation Plan for the National Strategy for the Arctic Region [2014] aim to ensure sufficient resources to support future shipping activity and search and rescue operations (“Prepare for Increased Activity in the Maritime Domain”; “Enhance Arctic Domain Awareness”).
STEPHENSON AND SMITH
CLIMATE MODEL INFLUENCE ON ARCTIC SHIPPING
331
Earth’s Future
10.1002/2015EF000317
Similarly, the National Research Council [2014] highlighted forecasting requirements for sea ice, weather, shipping, and resource development within a broad research agenda for the Arctic region, specifically Question 4.4: “How can we prepare forecasts and scenarios to meet emerging management needs?” (p. 95). For Canada, recent trans-Arctic voyages via the Northwest Passage (NWP) [McGarrity and Gloystein, 2013] raise the potential for Halifax and Saint John’s to become premier north Atlantic transshipment hubs. However, most shipping in the Canadian Arctic Archipelago (CAA) is destinational rather than trans-Arctic, and operational awareness along the NWP is lacking as few search and rescue stations and no deepwater ports currently exist along the 3,500 km route [AMSA, 2009]. Russia’s plan to modernize its ports and build search and rescue stations along the Northern Sea Route (NSR) aims to increase operational awareness and support Arctic petroleum development in the face of declining production in mature west Siberian oilfields [EIA, 2014]. New Arctic Council observer states China, Korea, and Japan are supporting development of the NSR through shipbuilding and scientific research in an effort to secure alternative sources and supply lines of energy [Bennett, 2014]. For Arctic and non-Arctic states alike, a warming Arctic represents both a growth opportunity and an operational challenge. To support these activities, forecasts and projections must account for uncertainties in the rate and spatial pattern of ice loss. These uncertainties stem from our incomplete understanding of the climate system, as well as numerous other uncertainties in emissions scenarios tied to different trajectories of economic and technological development [Tebaldi and Knutti, 2007]. While the observed overall trends in sea ice extent (−13% per decade over the satellite record relative to the 1981–2010 September average) and thickness (65% reduction from 1975 to 2012) are strongly negative [Perovich et al., 2014; Lindsay and Schweiger, 2015], prediction efforts are complicated by high interannual and spatial variability [Goosse et al., 2009; Stroeve et al., 2012b; Stroeve et al., 2014], particularly when combined with so-called “sudden ice loss” events as observed during the record-low year of 2012 [Holland et al., 2006; Goosse et al., 2009; Parkinson and Comiso, 2013]. When initialized with observed ice concentration parameters, climate models have been shown to be a promising tool for seasonal ice prediction [Massonnet et al., 2015]. However, climate models highlighted in the IPCC AR5 have generally underpredicted the observed steep rate of ice loss [Stroeve et al., 2012a; Rogers et al., 2015], and also exhibit strong individual differences in their timing and geography [Massonnet et al., 2012; Liu et al., 2013; Overland and Wang, 2013; Semenov et al., 2015]. Decisions based on model output are likewise subject to the weaknesses and biases of the chosen model or multi-model ensemble. Because all climate models produce errors in their representations of the physical processes of the climate system, different results from multiple models are required to reflect the true range of climate variability. Summary reports for policymakers [IPCC, 2014] have tended to focus on overall ice decline derived from averaged outputs from many models (so-called “ensemble averaging”) rather than specific sea ice decline scenarios targeting operational and long-term planning needs. Ensemble averages generally compare better with observations than single-model output, as combining models causes errors in individual models to at least partly cancel, resulting in more skillful projections [Tebaldi and Knutti, 2007]. However, ensemble averages carry a risk of producing implausible results that do not resemble those of any single model, as variables related in a nonlinear way in a single model will not necessarily be related in the same way when averaged over several models. For example, if two variables are related nonlinearly, their respective averages will not follow the original relation between the variables [Knutti et al., 2010]. Similarly, regional dynamics represented well in some models may be absent or poorly represented in a multimodel ensemble [Tebaldi and Knutti, 2007; Semenov et al., 2015]. Alternative aggregation methods using weighted averages in which weights are assigned to models based on performance have achieved mixed results [Min and Hense, 2006; Eyring et al., 2007; Waugh and Eyring, 2008], explained by low correlation between the observations used to weight the models and the models’ future projections [Knutti et al., 2010]. Weighted averages also have the potential to produce results worse than unweighted averages due to improper weighting, as there is a lack of consensus on which metrics should be used to evaluate model performance (e.g., climatological means, seasonal dynamics, spatial pattern, trend) and how to quantify them [Knutti et al., 2010]. Analysis of projections for decision-making should therefore incorporate both aggregate results that reflect robust outcomes of multiple models, as well as spatiotemporal differences and divergent outcomes among individual models. Identifying a range of plausible outcomes is often more informative for decision-making than a series of prescribed narrative scenarios based on permutations of variables [Groves and Lempert, 2007]. In this paper, we present several scenarios of future trans-Arctic shipping potential based on output STEPHENSON AND SMITH
CLIMATE MODEL INFLUENCE ON ARCTIC SHIPPING
332
Earth’s Future
10.1002/2015EF000317
from 10 CMIP5 models shown to represent well the historical trend and climatology of Arctic sea ice. Multimodel analysis of optimal vessel transits from North America and Europe to the Bering Strait is performed for all months during two periods representing early (2011–2035) and mid-twenty-first century (2036–2060) conditions. Projections are based on sea ice simulations for two climatic forcing scenarios (RCP 4.5/8.5), and assuming Polar Class 6 (PC6) and open-water vessels with medium and no ice-breaking capability, respectively. Results illustrate a range of variability in future trans-Arctic shipping access driven by differences in model choice, vessel capability, and climate forcing.
2. Methods 2.1. Data and Model Selection The methodology extends the approach of Smith and Stephenson [2013] and Stephenson et al. [2013]. Monthly sea ice concentration and thickness output were obtained from 10 General Circulation Models (GCM) from the World Climate Research Programme Coupled Model Intercomparison Project (CMIP5) archive. CMIP5 is the fifth phase of an international framework for coordinating the development and analysis of global coupled ocean–atmosphere GCMs, and represents the efforts of over 20 modeling groups using more than 50 models [Taylor et al., 2012]. While all CMIP5 models project decline in summer sea ice extent over the twenty-first century with a faster response under a higher emissions scenario (RCP 8.5), the spread in projected interannual variability, seasonality, and trend remains large [Massonnet et al., 2012]. Liu et al. [2013] narrowed this spread by identifying nine models that simulated properly the observed climatology and trend in September sea ice extent: ACCESS1.0, ACCESS1.3, BNU-ESM, CESM1-BGC, CESM1-CAM5, HADGEM2-CC, MIROC5, MIROC-ESM-CHEM, and MPI-ESM-MR. Massonnet et al. [2012] employed a similar approach, further evaluating models based on their ability to simulate the observed amplitude of seasonal cycle of sea ice extent and the reanalyzed annual mean sea ice volume. From a set of 29 models, six were retained: ACCESS1.0, ACCESS1.3, GFDL-CM3, IPSL-CM5A-LR, IPSL-CM5A-MR, and MPI-ESM-MR. For the present study, these six models were selected in addition to three identified by Liu et al. [2013] that were also evaluated by Massonnet et al. (HADGEM2-CC, MIROC5, and MIROC-ESM-CHEM). A tenth model, CCSM4, was selected owing to its ability to capture well the observed twentieth-century sea ice climatology [Jahn et al., 2012]. Of the ten models selected, CCSM4 is relatively conservative, owing to its weaker Arctic climate response than other models, including a ∼16% reduced Arctic amplification relative to its predecessor, CCSM3 [Vavrus et al., 2012]. Data were obtained for two end-member climate change scenarios, the RCP 4.5 (“medium-low” radiative forcing of +4.5 W/m2 ) and RCP 8.5 (“high” radiative forcing of +8.5 W/m2 ) for two 25 year study periods representing early-century (2011–2035) and mid-century (2036–2060) conditions. For each GCM, individual time series of monthly mean sea ice concentration and thickness output for the region north of 45∘ N were projected to a Lambert Azimuthal Equidistant projection at 20 km2 resolution using nearest-neighbor interpolation. 2.2. Transit Simulations To derive optimal least-cost navigation routes, GCM output was adapted for use with the Arctic Ice Regime Shipping System (AIRSS) [Transport Canada, 1998], a widely-used maritime navigation framework that characterizes the relative risk of different ice conditions. Under AIRSS, the ability of a ship to enter a particular ice regime is given by the Ice Numeral (IN): ) ( ) ( ) ( IN = Ca ∗ IMa + Cb ∗ IMb + … + Cn ∗ IMn where Ca /Cb is the concentration in tenths of ice type a/b and IMa /IMb is the Ice Multiplier (Table 1) of ice type a/b. A negative Ice Numeral signifies that the ice regime presents a significant hazard and should be avoided. The Ice Multiplier is a non-zero integer variable (ranging from −4 to 2) indicating the risk to a given vessel class from a given ice type, with higher values denoting lower risk. Ice type describes the physical properties of ice and is closely related to ice age: older ice tends to be thicker and stronger than younger ice due to annual accretion of ice layers and reduced brine inclusions thus posing greater hazard to ships [Bjerkelund et al., 1985; Johnston and Timco, 2008; Hunke and Bitz, 2009]. Ice thickness is a critical constraint on navigation and is a central element of both AIRSS and IMO (International Maritime Organization) Polar Class specifications [IMO, 2002]. GCM ice thickness ranging from 0 to STEPHENSON AND SMITH
CLIMATE MODEL INFLUENCE ON ARCTIC SHIPPING
333
Earth’s Future
10.1002/2015EF000317
Table 1. Ice Multipliers for Selected Vessel Classes Ice Type
PC6
OW
Open water
2
2
Gray
2
1
Gray-white
2
−1
Thin first-year, first stage
2
−1
Thin first-year, second stage
2
−1
Medium first-year
1
−2
Thick first-year
−1
−3
Second-year
−3
−4
Multiyear
−4
−4
Adapted from Transport Canada [1998].
120 cm was categorized into six ice types (plus one “open-water” type) according to AIRSS guidelines as follows: “gray” (10–15 cm), “gray-white” (15–30 cm), “thin first-year first stage” (30–50 cm), “thin first-year second stage” (50–70 cm), “medium first-year” (70–120 cm), “thick first-year” (first-year ice over 120 cm). Ice with thickness less than 10 cm was aggregated with “gray ice.” Thickness ranges for older ice classes (second-year ice and multiyear ice; thickness exceeding 120 cm) were calculated based on empirical analysis of remotely sensed age and thickness data. Median proxy ice thicknesses for yearly age classes for February–March (2004–2008) and October–November (2003–2007) were calculated by combining ICESat (Ice, Cloud, and land Elevation Satellite) freeboard ice thickness measurements [Kwok et al., 2007] with ice age grids derived from Lagrangian drift tracking. Weekly ice age grids from Maslanik et al. [2007] were averaged to obtain February–March and October–November mean ice age. Age grids were overlain with ICESat thickness in a geographic information system (GIS) and the median thickness value spatially coincident with a given age class averaged over 2004–2008 (February–March) and 2003–2007 (October–November). Age-thickness relationships for other months were interpolated from a linear regression model in which February–March and October–November thickness values represent maximum and minimum annual thickness, respectively. Two vessel classes were chosen: a moderately ice-strengthened Polar Class 6 (PC6) vessel capable of “summer/autumn operation in medium first-year ice which may include old ice inclusions,” and a common open-water vessel (no ice strengthening). Ice Multipliers for these ships were used to calculate Ice Numeral grids following AIRSS guidelines. Vessel access was considered feasible if the Ice Numeral for that class was non-negative. In accordance with Polar Class nomenclature, this study follows the convention that the AIRSS “Type A” class is nominally equivalent to IMO Polar Class 6 [IMO, 2002]. The “Type E” class is referred to in this study as “open-water.” Monthly Ice Numeral rasters were created for every year from 2011 to 2060 for each vessel class under two climate scenarios (RCP 4.5 and RCP 8.5). Optimal navigation routes from two north Atlantic ports (Rotterdam, the Netherlands; Halifax, Nova Scotia) to the Bering Strait were computed using a least-cost path algorithm. Raster cells identified with a negative Ice Numeral were reclassified as inaccessible. Ship travel times (minutes/km) were computed for all remaining areas using Ice Numeral–vessel speed relationships [McCallum, 1996]. Each travel time raster was converted in GIS to a vector line grid of uniformly spaced nodes (20 km), with each node linked by eight segments to its eight immediately adjacent neighbors, and each segment coded with the travel time required to traverse the segment. Each grid was then treated as a network dataset in GIS with the least-cost path computed as the route accumulating the lowest travel time between origin and destination. For any year in which no trans-Arctic voyage was possible, no least-cost route was computed. Routes were restricted in areas with ocean depth less than 15 m in order to simulate transits by medium and larger capacity vessels (∼20,000 dwt cargo, assuming 30 m beam) [Brigham et al., 1999]. Least-cost routes in months in which a transit was possible were aggregated in 20 km2 density grids such that each grid cell represents the number of potential routes over the period of study. Due to lack of coverage in the southern CAA and near the Queen Elizabeth Islands in some models (GFDL-CM3, IPSL-CM5A-LR, IPSL-CM5A-MR, and MIROC-ESM-CHEM), routes via NWP were restricted to the northern route encompassing Lancaster Sound, STEPHENSON AND SMITH
CLIMATE MODEL INFLUENCE ON ARCTIC SHIPPING
334
Earth’s Future (a)
140°W
160°W
180°
10.1002/2015EF000317
160°E
(b)
140°E
!( 1
1. Bering Strait 2. Long Strait 3. Wrangel Island 4. Dmitry Laptev Strait 5. Sannikov Strait 6. New Siberian Islands 7. Vilkitsky Strait 8. Severnaya Zemlya 9. Novaya Zemlya 10. Kara Strait 11. Svalbard 12. Fram Strait 13. Rotterdam 14. Halifax 15. Davis Strait 16. Lancaster Sound 17. Barrow Strait 18. Viscount Melville Sound 19. M’Clure Strait 20. Prince of Wales Strait
3
60°N 4 5
6 20 18
19 7 8
17
140°W
16
160°W
160°E
180°
2 3
60°N 4 5
6 20 18
19 7 8
17 16
9 12
140°E
!( 1
1. Bering Strait 2. Long Strait 3. Wrangel Island 4. Dmitry Laptev Strait 5. Sannikov Strait 6. New Siberian Islands 7. Vilkitsky Strait 8. Severnaya Zemlya 9. Novaya Zemlya 10. Kara Strait 11. Svalbard 12. Fram Strait 13. Rotterdam 14. Halifax 15. Davis Strait 16. Lancaster Sound 17. Barrow Strait 18. Viscount Melville Sound 19. M’Clure Strait 20. Prince of Wales Strait
2
9
11
12
10
15
11
10
15
60°N
( !14
40°N
60°N
( !14
40°N
50°N
50°N
!( 13
40°W
20°W
0°
!( 13
20°E
40°W
20°W
0°
20°E
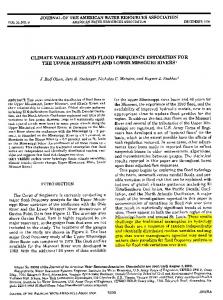
Figure 1. 10-model average of density of least-cost navigation routes from Rotterdam, The Netherlands and Halifax, Nova Scotia to the Bering Strait by open-water vessels under RCP 4.5 W/m2 climate forcing at early-century (2011–2035; a) and mid-century (2036–2060; b).
Barrow Strait, Viscount Melville Sound, and the M’Clure Strait. The lack of coverage of narrow straits in the CAA in many models, coupled with the coarse resolution of GCMs (∼1∘ ), is a significant limitation on the robustness of shipping simulations in this region. Prescribing a single route in the CAA limits analysis to the largest and best-resolved waterway while enabling comparison of routes among multiple models.
3. Results 3.1. Ensemble-Averaged Route Densities Several general patterns can be observed in the 10-model ensemble average. Figure 1 depicts the 10-model average of aggregate density of least-cost routes projected during the early-century (2011–2035) and mid-century (2036–2060) periods by open-water vessels under RCP 4.5. Figure 2 shows the number of months in which a least-cost route was projected via the eastern or central Arctic vs. the NWP. Density
Figure 2. Number of months in which an eastern/central Arctic route (E/C; includes the NSR) or the Northwest Passage (NWP) was projected to be the least-cost route from Rotterdam, Halifax, or both, under RCP 4.5 and RCP 8.5. Colors indicate values greater (green) or less (red) than the 10-model average by one (numbers) or two (cells) standard deviations.
STEPHENSON AND SMITH
CLIMATE MODEL INFLUENCE ON ARCTIC SHIPPING
335
Earth’s Future
10.1002/2015EF000317
is greatest in the eastern/central Arctic (Figure 1a), encompassing the least-cost route on 49 months on average from 2011 to 2030. The majority of Rotterdam-originating routes circumvent the Kara Strait by passing north of Novaya Zemlya and entering the Laptev Sea via the Vilkitsky Strait. All routes pass north of the New Siberian Islands due to depth restrictions in the Sannikov Strait (13 m) and Dmitry Laptev Strait (6.7 m); other straits of the NSR do not force route diversions. Most routes enter the Chukchi Sea via Long Strait. Eastbound routes originating from North America broadly replicate these patterns. Most of these routes transit the Fram Strait between Greenland and Svalbard, continuing southeast to join Europe-originating routes near Severnaya Zemlya. Route density along the NWP from 2011 to 2035 is relatively low (13; Figure 2). The majority of these routes originate from North America, following a single least-cost path through the Davis Strait and Parry Channel, and converging near Barrow on the Alaskan coast. The central Arctic Ocean is projected to have very limited, sporadic accessibility before 2035. By mid-century, these spatial patterns remain broadly similar as overall route density increases (Figure 1b). Most routes remain concentrated in the eastern Arctic with the majority of routes entering the NSR north of Novaya Zemlya. Many of these routes migrate north of the coastal NSR in parallel with the northward retreat of the marginal ice zone, and continue north of Severnaya Zemlya (∼82∘ N) and Wrangel Island (∼72∘ N). Average route density in the central Arctic Ocean (high seas) also increases substantially relative to early-century (162%). Most of these routes are concentrated along a central corridor roughly aligning with the great-circle route over the North Pole. Together, the eastern and central Arctic comprise 70% of the total routes by mid-century (80/114), while the NWP remains minor (34/114) (Figure 2). In relative terms, route density along the NWP increases substantially by mid-century (260%). NWP density originating from Europe is low throughout 2011–2060. 3.2. Intermodel Variability Analysis of route densities from individual models reveals considerable spatial differences in projected trans-Arctic routes. Figure 3 illustrates the deviation of single-model route densities from the 10-model average for open-water vessels under RCP 4.5 (Figure 1) expressed in standard deviation units, where red and blue areas indicate higher and lower densities than average, respectively. All models project at least some accessibility in the eastern Arctic throughout the study period. However, the NSR as narrowly defined in Russian law from the Kara Strait to the Bering Strait is the dominant route in only two models from 2011 to 2035 (CCSM4 and IPSL-CM5A-LR), while it is only one of many possible routes spanning the eastern/central Arctic in most models (ACCESS1.0, ACCESS1.3, GFDL-CM3, HADGEM2-CC, IPSL-CM5A-MR and MIROC-ESM-CHEM). By 2060, five models (ACCESS1.0, GFDL-CM3, HADGEM2-CC, IPSL-CM5A-MR, and MIROC-ESM-CHEM) exhibit higher-than-average route density via the central Arctic, reflecting substantially reduced ice cover less than 10 cm thick. Only two models (CCSM4 and MIROC5) project no central Arctic routes by 2060. In contrast, route density in the western Arctic is strongly dominated by only a few models. GFDL-CM3, MIROC-ESM-CHEM, and MPI-ESM-MR together account for 73% of the total routes via the NWP by 2060 (Figure 2). MPI-ESM-MR is a clear outlier here, with projected NWP routes greater than two standard deviations above average at early-century (56). While MIROC5 accounts for a relatively small proportion of the total NWP routes (14%), its routes are strongly skewed toward the NWP at both early- (NWP: 15; eastern/central: 2) and mid-century (NWP: 22; eastern/central: 49). MIROC5 and MPI-ESM-MR are the only models for which a majority of routes transit the NWP (73% and 62%, respectively). This may be due to regional biases promoting thick ice in the Kara Sea in MIROC5 and warm temperatures over northern Canada in MPI-ESM-MR [Komuro et al., 2012; Notz et al., 2013]. No NWP routes are projected by 2060 in four models (ACCESS1.0, CCSM4, HADGEM2-CC, and IPSL-CM5A-LR); NWP route density in these models appears uniformly blue (negative standard deviation; Figure 3). NWP routes for all other models increase from early-century to mid-century, with the greatest increases occurring in MIROC-ESM-CHEM (+63) and GFDL-CM3 (+60). The overall density of projected routes also varies significantly among models. In general, CCSM4, IPSL-CM5A-LR, and MIROC5 are conservative, together accounting for only 11% of the total routes for open-water vessels from 2011 to 2060 under RCP 4.5 (Figure 2; 2%, 4%, 5% respectively). The number of projected routes is greater than one standard deviation below the 10-model mean for these models at early-century and remains so by mid-century for CCSM4 and MIROC5. The increase in routes projected STEPHENSON AND SMITH
CLIMATE MODEL INFLUENCE ON ARCTIC SHIPPING
336
Earth’s Future
10.1002/2015EF000317
Figure 3. Single-model deviation from 10-model average density of least-cost routes for open-water vessels under RCP 4.5, at early-century (2011–2035; left) and mid-century (2036–2060; right), expressed in standard deviation units. Red (blue) areas indicate higher (lower) projected route densities than the average.
by 2060 for CCSM4 is very small (9) and limited to the NSR, while IPSL-CM5A-LR and MIROC5 gain substantially more routes (33 eastern/central, 0 NWP; 20 eastern/central, 34 NWP). In contrast, GFDL-CM3, MIROC-ESM-CHEM, and ACCESS1.3 are comparatively aggressive, together accounting for 49% of the total open-water routes under RCP 4.5 (18%, 16%, and 14%). GFDL-CM3 stands out as the only model to exceed the average aggregate projected routes from 2011 to 2060 by more than one standard deviation (1.6). Furthermore, routes in GFDL-CM3 and MIROC-ESM-CHEM are more evenly distributed between the eastern/central Arctic and the NWP than in most models (67% and 64% eastern/central), indicating that trans-Arctic accessibility is high in a large area of the Arctic in these models. While overall route density varies widely, the 10 models exhibit fairly good agreement in their rate of change. Figure 4 depicts the number of trans-Arctic accessible months for open-water vessels under RCP 4.5 for individual models and the 10-model average from 2011 to 2060. In a majority of years (35), the interannual STEPHENSON AND SMITH
CLIMATE MODEL INFLUENCE ON ARCTIC SHIPPING
337
Earth’s Future
10.1002/2015EF000317
ACCESS1.0
8
ACCESS1.3 CCSM4 6
Months
GFDL-CM3 HADGEM2-CC 4
IPSL-CM5A-LR IPSL-CM5A-MR
2
MIROC5 MIROC-ESM-CHEM MPI-ESM-MR
0 2010
2020
2030
2040
2050
2060
Average
Year Figure 4. Time series of trans-Arctic accessible months for open-water vessels under RCP 4.5 for 10 individual models (colored lines) and the 10-model average (thick black line). Boxes indicate years in which the interannual change in at least five models was equal to (dark gray) or within one month of (light gray) that of at least five other models.
12 10 8 6 4 2 0 2012 2014 2016 2018 2020 2022 2024 2026 2028 2030 2032 2034 2036 2038 2040 2042 2044 2046 2048 2050 2052 2054 2056 2058 2060
Figure 5. 10-model average (standard deviation; black bars) of trans-Arctic accessible months for open-water (blue) and Polar Class 6 (red) vessels under RCP 4.5 (solid) and RCP 8.5 (hollow).
change in at least five models was ±1 month of the interannual change in at least five other models (light gray boxes). These periods of agreement are fairly evenly distributed throughout the study period. Only once (2026–2029) did at least five models fail to agree for more than 3 years in a row. Temporal agreement is significantly lower when the criteria for agreement are strengthened; for example, the interannual change in at least five models was equal to that of at least five other models in only 6 years (dark gray boxes: 2016, 2030, 2034, 2038, 2049, 2054). Similarly, if seven models must exhibit interannual change ±1 month of at least seven other models, temporal agreement occurs in only 5 years (2034, 2038, 2049, 2053, and 2054). The range of trans-Arctic accessible months is at least 2 in every year and reaches a maximum of 7 months in 2043. 3.3. Choice of Vessel Class and Climate Scenario Several observations are apparent when analysis is expanded to include Polar Class 6 (PC6) vessels. Route density is markedly higher in all models throughout the study period when PC6 vessels are assumed, more than doubling total trans-Arctic routes in the 10-model average and in eight individual models by 2060 compared to vessels with no ice strengthening (Figures 2 and 5, RCP 4.5). Interestingly, PC6 vessels fail to enable any NWP routes in three models by 2060 (ACCESS1.0, CCSM4, HADGEM2-CC, and only 1 route in a fourth model, IPSL-CM5A-LR), indicating persistence of ice >1.2 m thick in the Canadian STEPHENSON AND SMITH
CLIMATE MODEL INFLUENCE ON ARCTIC SHIPPING
338
Earth’s Future
10.1002/2015EF000317
Arctic for several decades. The addition of PC6 vessels more than doubles NWP routes by 2060 for the other six models and more than triples NWP routes for ACCESS1.3, GFDL-CM3, MIROC-ESM-CHEM, and MPI-ESM-MR. Compared to vessel class, climate forcing plays a minor role. Total projected routes in the 10-model average increases from 176 to 197 for open-water vessels and from 401 to 447 for PC6 vessels under RCP 8.5 as compared to RCP 4.5 (Figure 2). Most of this increase occurs by mid-century, reflecting the rapid divergence of RCP 8.5 from RCP 4.5 in greenhouse gas emissions after 2030 [van Vuuren et al., 2011]. In general, models observed to be conservative under RCP 4.5 such as CCSM4 and MIROC5 remain conservative under RCP 8.5, while models that project high route density under RCP 4.5 such as GFDL-CM3 and MIROC-ESM-CHEM exhibit similar results under RCP 8.5.
4. Discussion Our results demonstrate that consideration of both individual models and ensemble averages is necessary to fully present the range, as well as most probable, of plausible futures for trans-Arctic shipping routes. The analysis benefited from an initial round of model selection to identify best performers in the Arctic region [Massonnet et al., 2012; Liu et al., 2013], thus narrowing projections to those broadly representative of observed sea ice climatology and historical extent. Despite this narrowing, we find significant variability among models in the projected density and spatial distribution of trans-Arctic routes. Notably, whether the NSR or NWP becomes the preferred route to either Europe or North America depends critically on model choice. Our ensemble average suggests moderate route density through the NWP at both early- and mid-century, masking the fact that most NWP routes come from only three models. Omitting GFDL-CM3, MIROC-ESM-CHEM, and MPI-ESM-MR, our results would indicate minimal NWP potential even for routes from North America. Such spatial heterogeneity reveals large differences in regional biases among models. In MIROC5 and MPI-ESM-MR, these biases manifest in persistent low ice thickness along Parry Channel coupled with thicker ice in the eastern Arctic frequently extending to the Russian coast, producing a strong preference for the NWP even for routes originating from Europe. Other models exhibit a moderate to strong preference for the NSR that more closely mirrors the present-day observed pattern of vessel activity. In this context, MIROC5 and MPI-ESM-MR may be viewed as outliers even as their overall climatology and projected trend correlate well with observations. We also find substantial differences in overall route density, with 61% of the total open-water vessel routes under RCP 4.5 coming from four models (ACCESS1.3, GFDL-CM3, MIROC-ESM-CHEM, and MPI-ESM-MR). While such disparities might ostensibly suggest that models offer little decision-making utility, in fact, these intermodel differences mirror the range of natural variability in the climate system. For example, natural fluctuations in the ocean–atmosphere system can mask or enhance the impact of anthropogenic warming on Arctic sea ice [Swart et al., 2015]. While oceanic poleward heat transport currently amplifies Arctic warming, a future weakening of the Pacific or Atlantic conveyor or alteration of central Arctic wind patterns could inhibit sea ice decline [Zhang, 2015]. These fluctuations could delay the arrival of the first Arctic “ice-free” summer on record, defined as ice extent below 1 M km2 for five consecutive summers. Such a slowdown likely would be temporary, however, as multidecadal sea ice decline is expected to continue in the long term [Stroeve et al., 2012b; Overland and Wang, 2013]. Despite the described variability, our results suggest two robust conclusions about the future of trans-Arctic marine access. First, the eastern Arctic will remain the most reliably accessible marine space for shipping by mid-century. While the NSR will remain an important corridor for destinational traffic serving Russian ports such as the Yamal LNG/Sabetta terminal on the Yamal Peninsula, its relative importance as a trans-Arctic transit corridor will diminish over time. Ensemble-average model results at early-century broadly reflect the current seasonal concentration of vessel activity along the NSR with relatively few transits of the NWP. As the ice edge recedes toward a summer ice-free Arctic by mid-century, a small but increasing number of central Arctic routes will become possible each year as projected by a majority of models. Many of these routes circumvent the Russian EEZ entirely, allowing vessel operators to avoid tariffs currently levied on vessels plying the NSR. While tariff rates vary with season, ice conditions, vessel class, and gross tonnage, current estimates exceed $10 per unit gross tonnage for an open-water vessel with a gross tonnage of more than 100,000 [Northern Sea Route Information Office, 2014]. Central Arctic routes are also generally shorter than STEPHENSON AND SMITH
CLIMATE MODEL INFLUENCE ON ARCTIC SHIPPING
339
Earth’s Future
10.1002/2015EF000317
the NSR, offering further advantages in time and fuel savings. However, these advantages are offset by the enhanced risk of traveling at greater distance from shore in a region with very sparse support infrastructure. Outside of summer, the NSR is expected to retain a competitive advantage over central Arctic routes as the ice edge restricts open-water navigation to coastal routes and raises requirements for icebreaker support. This suggests that Russian plans to expand search and rescue infrastructure along the NSR will be essential to support continued expansion of the Arctic navigation season. Second, access to Polar Class vessels (PC6) increases trans-Arctic potential to a much greater degree (128%) than accelerated climate warming (RCP 8.5; 12%) in all models, even by mid-century. This suggests that even under the most aggressive climate forcing assumptions, most of the Arctic Ocean will remain inaccessible to open-water vessels for all but a few months each year, though certain areas such as northwest Russia will be accessible for longer periods. Most of the additional routes available to PC6 vessels occur in winter, and four models project at least some trans-Arctic access in every month with PC6 vessels by 2060 (ACCESS1.3, GFDL-CM3, IPSL-CM5A-MR, and MIROC-ESM-CHEM). While nominally equivalent in our analysis, winter routes do not represent the same degree of accessibility as summer routes because winter ice is colder, and therefore stronger, than summer ice [Prowse et al., 2009]. Minimal sunlight and lack of leads (cracks) in the ice create further hazards to winter navigation. While summer ice extent has accelerated over the past decade, winter decline has been relatively modest (−3% per decade) [NSIDC, 2015], suggesting that Polar Classes will retain their winter advantage for some time. The relative impact of climate is likely to increase beyond 2060 in parallel with the divergence of the Representative Concentration Pathways [van Vuuren et al., 2011] regardless of model choice, as most CMIP5 models exhibit enhanced climate sensitivity by mid-century under RCP 8.5 compared to RCP 4.5 and all models exhibit Arctic amplification in every season by 2100 [Barnes and Polvani, 2015; Smith et al., 2015]. It is also possible that trans-Arctic potential could accelerate nonlinearly due to feedbacks not well represented in models, such as methane release from thawing permafrost [Schuur et al., 2015] and local surface winds [Ogi and Wallace, 2012]. Our analysis considers only trans-Arctic voyages originating and terminating outside the Arctic. These are presumed to be commercial transit voyages as destinational shipping activities such as resource, fishing, resupply, and tourism voyages rarely cross the entire Arctic [AMSA, 2009; Lasserre and Têtu, 2013; Farré et al., 2014]. At present, the vast majority of Arctic shipping is destinational, mainly serving to transport resources out of the region to world markets. This use pattern is likely to continue in the near future as numerous oil, gas, and mineral (e.g. bauxite, copper, iron, nickel, palladium, phosphate) projects are underway while transit container shipping is limited by low reliability and lack of intermediate ports along Arctic routes [Lasserre and Pelletier, 2011; Carmel, 2013; Lasserre, 2014]. Therefore, our results broadly reflect scenarios of bulk cargo shipping between Asia and the North Atlantic, demonstrated by recent transport of hydrocarbons through the NSR and nickel concentrate through the NWP [Bennett, 2014]. The potential of the Arctic as a transit corridor will increase with the number of “ice-free” summer days throughout the twenty-first century. In the near term, however, the likelihood of the Arctic rivaling the Suez or Panama Canals is highly remote. It is important to recognize that the NWP route examined in this study (Viscount Melville Sound—M’Clure Strait) represents only one of several possible routes through the Canadian Archipelago, and one which is most heavily choked with ice. Several alternative routes with less ice, such as the Viscount Melville Sound—Prince of Wales Strait route and the Prince Regent Inlet—Larsen Sound—Victoria Strait—Coronation Gulf route, were unavailable due to lack of model coverage. The NWP might therefore offer greater trans-Arctic potential than the models examined here indicate. However, satellite and field observations show that climate warming is likely to promote drift of multiyear ice from the central Arctic Ocean into the NWP, increasing shipping hazards even as overall ice extent declines [Melling, 2002; Howell et al., 2013]. In the near future, the NWP is likely to remain impassible in early spring as April–May modal ice thicknesses measure at least 1.8 m in all regions of the NWP [Haas and Howell, 2015]. The coarse resolution of GCMs further limits the utility of climate projections in complex regions such as the Canadian Archipelago. Several other factors constrain the results of these projections and provide opportunities for further research. Glacier ice (icebergs, growlers, bergy bits) and sea ice ridging are not currently included in climate model simulations, yet are known to present a hazard to navigation. Pressure ridges, in particular, are very strong barriers even to the most powerful icebreakers [Bourbonnais and Lasserre, 2015] and may occur with greater frequency with continued ice thinning and increased ice mobility [Rampal et al., 2009; Stern STEPHENSON AND SMITH
CLIMATE MODEL INFLUENCE ON ARCTIC SHIPPING
340
Earth’s Future
10.1002/2015EF000317
and Lindsay, 2009; Kwok et al., 2013]. Sea ice decay is also not included in climate models and may either increase access through weakened ice [Transport Canada, 1998] or decrease access by promoting ice mobility, leading to more ice ridges [Stern and Lindsay, 2009]. Finally, this study does not attempt to address the economic viability of Arctic routes, which depend on numerous factors other than sea ice. For example, while ice strengthening (e.g., Polar Class) helps to overcome the technical challenges of navigation in ice, such ships are expensive and consume significantly more fuel than regular cargo vessels, rendering them uneconomic in open water [Bourbonnais and Lasserre, 2015].
5. Conclusion Our results illustrate a range of potential futures for trans-Arctic shipping access owing to differences in model choice, vessel capability, and climate forcing. While ensemble-averaged results suggest significant increases in vessel access by mid-century, intermodel differences reveal considerable uncertainties in the magnitude and location of future vessel access. As it is today, the eastern Arctic remains the most reliably accessible marine space in model projections, though the NSR as narrowly defined in Russian law gradually loses prominence by mid-century as shorter central Arctic routes become accessible for brief periods each year in a majority of models. The NSR will remain important for destinational shipping at Russian Arctic ports and will continue to serve as a transit corridor when the central Arctic Ocean is inaccessible. Despite these similarities, models project widely varying densities and distributions of trans-Arctic routes, with season lengths ranging from one to six months and spatial coverage ranging from coastal-only access to great-circle routes traversing the North Pole. The NWP is particularly model-dependent, exhibiting greater access than the NSR in only two of the models studied. In all models, PC6 were shown to increase trans-Arctic accessibility to a considerably greater degree than accelerated climate warming (RCP 8.5). While Arctic shipping depends on numerous nongeophysical factors including economics and infrastructure, this research reveals the importance of model choice in devising projections for strategic planning by governments, environmental agencies, and the global maritime industry. Quantifying the range of variability in future marine access is critical to better understand requirements for search and rescue, maritime interdiction, customs and border protection, disaster preparedness and relief operations, environmental protection and monitoring, military surveillance and reconnaissance operations, and impacts on native communities. The considerable uncertainties in the Arctic pose significant challenges for such planning efforts because investment requirements are often substantial and are not particularly relevant to operations at lower latitudes. Given the right climatic, economic, and geopolitical conditions, distant ports (e.g., in Alaska and Iceland) could become more globally connected, with implications for port construction activities, logistics planning and operations, environmental protection and monitoring, national security, and diplomatic relationships. To the extent that climate models will continue to be used to measure impacts as well as projections of future climate change, our findings suggest that cautious application of model results incorporating divergent outcomes from multiple models holds greater promise for decision-making than single-model studies alone. Acknowledgments The authors are grateful to Lawson Brigham, Abbie Tingstad, and two anonymous reviewers for their insightful comments and suggestions. This work was supported by the National Science Foundation and the National Aeronautics and Space Administration (NASA) Cryosphere Program. Data in this paper were derived from climate projections obtained from the CMIP5 archive and are freely available from the Earth System Grid Federation Portal: http://dev.esg.anl.gov/esgf-web-fe/
STEPHENSON AND SMITH
References AMSA (2009), Arctic Marine Shipping Assessment 2009 Report. Arctic Council, April 2009. Barnes, E. A., and L. M. Polvani (2015), CMIP5 projections of Arctic amplification, of the North American/North Atlantic circulation, and of their relationship, J. Clim., 28, 5254–5271, doi:10.1175/jcli-d-14-00589.1. Bennett, M. M. (2014), North by Northeast: Toward an Asian-Arctic region, Eurasian Geogr. Econ., 55, 71–93, doi:10.1080/15387216.2014.936480. Bjerkelund, C. A., D. J. Lapp, R. O. Ramseier, and N. K. Sinha (1985), The texture and fabric of the second year sea ice cover at Mould Bay, Prince Patrick Island, NWT, April 1983, in Proceedings of IEEE International Geoscience and Remote Sensing Symposium, Amherst, Mass. Bourbonnais, P., and F. Lasserre (2015), Winter shipping in the Canadian Arctic: Toward year-round traffic?, Polar Geogr., 38, 70–88, doi:10.1080/1088937x.2015.1006298. Brigham, L. W. (2010), Think again: The Arctic, Foreign Policy, 72, 70–74. Brigham, L. W. (2013), Arctic marine transport driven by natural resource development, Baltic Rim Econ. Q. Rev., 2, 13–14. Brigham, L. W., V. D. Grishchenko, and K. Kamisaki (1999), The natural environment, ice navigation and ship technology, in The Natural and Societal Challenges of the Northern Sea Route, edited by W. Østreng, Kluwer Academic Publishers, London. Bryanski, G. (2011), Russia’s Putin says Arctic trade route to rival Suez (September 22). Reuters. Carmel, S. (2013), The cold, hard realities of Arctic shipping. USNI Proceedings Magazine 139/7/1,325. EIA (2014), Russia looks beyond West Siberia for future oil and natural gas growth. US Energy Information Administration. [Available at http://www.eia.gov/todayinenergy/detail.cfm?id=18051.] Eyring, V., et al. (2007), Multimodel projections of stratospheric ozone in the 21st century, J. Geophys. Res., 112, D16303, doi:10.1029/2006JD008332.
CLIMATE MODEL INFLUENCE ON ARCTIC SHIPPING
341
Earth’s Future
10.1002/2015EF000317
Farré, A. B., et al. (2014), Commercial Arctic shipping through the Northeast Passage: Routes, resources, governance, technology, and infrastructure, Polar Geogr., 37, 298–324, doi:10.1080/1088937x.2014.965769. Goosse, H., O. Arzel, C. M. Bitz, A. de Monety, and M. Vancoppenolle (2009), Increased variability of the Arctic summer ice extent in a warmer climate, Geophys. Res. Lett., 36, L23702, doi:10.1029/2009GL040546. Groves, D. G., and R. J. Lempert (2007), A new analytic method for finding policy-relevant scenarios, Global Environ. Change, 17, 73–85, doi:10.1016/j.gloenvcha.2006.11.006. Haas, C., and S. E. L. Howell (2015), Ice thickness in the Northwest Passage, Geophys. Res. Lett., 42, 7673–7680, doi:10.1002/2015GL065704. Holland, M. M., C. M. Bitz, and B. Tremblay (2006), Future abrupt reductions in the summer Arctic sea ice, Geophys. Res. Lett., 33, L23503, doi:10.1029/2006GL028024. Howell, S. E. L., T. Wohlleben, M. Dabboor, C. Derksen, A. Komarov, and L. Pizzolato (2013), Recent changes in the exchange of sea ice between the Arctic Ocean and the Canadian Arctic Archipelago, J. Geophys. Res. Oceans, 118(7), 3595–3607, doi:10.1002/JGRC.20265. Hunke, E. C., and C. M. Bitz (2009), Age characteristics in a multidecadal Arctic sea ice simulation, J. Geophys. Res., 114, C08013. IMO (2002), Guidelines for ships operating in Arctic ice-covered waters. IPCC (2014), Climate change 2014 synthesis report: Summary for policymakers. Jahn, A., et al. (2012), Late-twentieth-century simulation of Arctic sea ice and ocean properties in the CCSM4, J. Clim., 25, 1431–1452, doi:10.1175/jcli-d-11-00201.1. Johnston, M. E., and G. W. Timco (2008), Understanding and identifying old ice in summer. Canadian Hydraulics Centre, National Research Council Canada, Ottawa. Khon, V. C., I. I. Mokhov, M. Latif, V. A. Semenov, and W. Park (2010), Perspectives of Northern Sea Route and Northwest Passage in the twenty-first century, Clim. Change, 100, 757–768, doi:10.1007/s10584-009-9683-2. Knutti, R., R. Furrer, C. Tebaldi, J. Cermak, and G. A. Meehl (2010), Challenges in combining projections from multiple climate models, J. Clim., 23, 2739–2758, doi:10.1175/2009jcli3361.1. Komuro, Y., T. Suzuki, and T. T. Sakamoto (2012), Sea-ice in twentieth-century simulations by new MIROC coupled models: A comparison between models with high resolution and with ice thickness distribution, J. Meterol. Soc. Jpn., 90A, 213–232, doi:10.2151/jmsj.2012-A11. Kwok, R., G. F. Cunningham, H. J. Zwally, and D. Yi (2007), Ice, Cloud, and land Elevation Satellite (ICESat) over Arctic sea ice: Retrieval of freeboard, J. Geophys. Res., 112, C12013, doi:10.1029/2006JC003978. Kwok, R., G. Spreen, and S. Pang (2013), Arctic sea ice circulation and drift speed: Decadal trends and ocean currents, J. Geophys. Res., 118, 2408–2425, doi:10.1002/JGRC.20191. Lasserre, F. (2014), Case studies of shipping along Arctic routes: Analysis and profitability perspectives for the container sector, Transport. Res. Part A, 66, 144–161, doi:10.1016/j.tra.2014.05.005. Lasserre, F., and P.-L. Têtu (2013), The cruise tourism industry in the Canadian Arctic: Analysis of activities and perceptions of cruise ship operators, Polar Rec., 51, 24–38, doi:10.1017/s0032247413000508. Lasserre, F., and S. Pelletier (2011), Polar super seaways? Maritime transport in the Arctic: An analysis of shipowners’ intentions, J. Transport Geogr., 19, 1465–1473, doi:10.1016/j.jtrangeo.2011.08.006. Lindsay, R., and A. Schweiger (2015), Arctic sea ice thickness loss determined using subsurface, aircraft, and satellite observations, Cryosphere, 9, 269–283, doi:10.5194/tc-9-269-2015. Liu, J., M. Song, R. M. Horton, and Y. Hu (2013), Reducing spread in climate model projections of a September ice-free Arctic, Proc. Natl. Acad. Sci. U. S. A., 110, 12571–12576, doi:10.1073/pnas.1219716110. Liu, M., and J. Kronbak (2010), The potential economic viability of using the Northern Sea Route (NSR) as an alternative route between Asia and Europe, J. Transport Geogr., 18, 434–444, doi:10.1016/j.jtrangeo.2009.08.004. Maslanik, J. A., C. Fowler, J. C. Stroeve, S. Drobot, J. Zwally, D. Yi, and W. Emery (2007), A younger, thinner Arctic ice cover: Increased potential for rapid, extensive sea-ice loss, Geophys. Res. Lett., 34, L24501, doi:10.1029/2007GL032043. Massonnet, F., T. Fichefet, H. Goosse, C. M. Bitz, G. Philippon-Berthier, M. M. Holland, and P.-Y. Barriat (2012), Constraining projections of summer Arctic sea ice, Cryosphere, 6, 1383–1394, doi:10.5194/tc-6-1383-2012. Massonnet, F., T. Fichefat, and H. Goosse (2015), Prospects for improved seasonal Arctic sea ice predictions from multivariate data assimilation, Ocean Model., 88, 16–25, doi:10.1016/j.ocemod.2014.12.013. McCallum, J. (1996), Safe speed in ice: An analysis of transit speed and ice decision numerals. Ship Safety Northern, Transport Canada, Ottawa. McGarrity, J., and H. Gloystein (2013), Big freighter traverses Northwest Passage for 1st time (September 27). Reuters. Melling, H. (2002), Sea ice of the northern Canadian Arctic Archipelago, J. Geophys. Res., 107, 3181, doi:10.1029/2001JC001102. Min, S.-K., and A. Hense (2006), A Bayesian approach to climate model evaluation and multi-model averaging with an application to global mean surface temperatures from IPCC AR4 coupled climate models, Geophys. Res. Lett., 33, L08708, doi:10.1029/2006GL025779. National Research Council (2014), The Arctic in the Anthropocene: Emerging Research Questions. National Academy of Sciences. Northern Sea Route Information Office (2014), On approval of the tariff rates for provision of icebreaking pilotage services provided by the FSUE «Atomflot» on the Northern Sea Route water area. Federal Tariff Service of Russia, Moscow. Notz, D., F. A. Haumann, H. Haak, J. H. Jungclaus, and J. Marotzke (2013), Arctic sea-ice evolution as modeled by Max Planck Institute for Meteorology’s Earth system model, J. Adv. Model. Earth Syst., 5, 173–194, doi:10.1002/JAME.20016. NSIDC (2014), 2014 melt season in review. [Available at http://nsidc.org/arcticseaicenews/2014/10/.] NSIDC (2015), Arctic sea ice news and analysis monthly archives: March 2015. [Available at https://nsidc.org/arcticseaicenews/2015/03/.] Office of the President (2014), Implementation plan for the national strategy for the Arctic region. The White House. Ogi, M., and J. M. Wallace (2012), The role of summer surface wind anomalies in the summer Arctic sea ice extent in 2010 and 2011, Geophys. Res. Lett., 39, L09704, doi:10.1029/2012GL051330. Overland, J. E., and M. Wang (2013), When will the summer Arctic be nearly sea ice free?, Geophys. Res. Lett., 40, 2097–2101, doi:10.1002/GRL.50316. Parkinson, C. L., and J. C. Comiso (2013), On the 2012 record low Arctic sea ice cover: Combined impact of preconditioning and an August storm, Geophys. Res. Lett., 40, 1356–1361, doi:10.1002/GRL.50349. Perovich, D., S. Gerland, S. Hendricks, W. Meier, M. Nicolaus, and M. Tschudi (2014), Arctic report card: Update for 2014. National Oceanic and Atmospheric Administration. Pizzolato, L., S. E. L. Howell, C. Derksen, J. Dawson, and L. Copland (2014), Changing sea ice conditions and marine transportation activity in Canadian Arctic waters between 1990 and 2012, Clim. Change, 123, 161–173, doi:10.1007/s10584-013-1038-3.
STEPHENSON AND SMITH
CLIMATE MODEL INFLUENCE ON ARCTIC SHIPPING
342
Earth’s Future
10.1002/2015EF000317
Prowse, T. D., C. Furgal, R. Chouinard, H. Melling, D. Milburn, and S. L. Smith (2009), Implications of climate change for economic development in northern Canada: Energy, resource, and transportation sectors, Ambio, 38, 272–281, doi:10.1579/0044-7447-38.5.272. Rampal, P., J. Weiss, and D. Marsan (2009), Positive trend in the mean speed and deformation rate of Arctic sea ice, 1979–2007, J. Geophys. Res., 114, C05013. Restino, C. (2013), Treadwell speaks of obstacles to burgeoning Arctic at Norway conference (January 23). Alaska Dispatch. Rogers, T., J. E. Walsh, M. Leonawicz, and M. Lindgren (2015), Arctic sea ice: Use of observational data and model hindcasts to refine future projections of ice extent, Polar Geogr., 38, 22–41, doi:10.1080/1088937X.2014.987849. Sarrabezoles, S., F. Lasserre, and Z. Hagouagn’rin (2014), Arctic shipping insurance: Towards a harmonisation of practices and costs?, Polar Rec., doi:10.1017/S0032247414000552. Schøyen, H., and S. Bråthen (2011), The Northern Sea Route versus the Suez Canal: Cases from bulk shipping, J. Transport Geogr., 19, 977–983, doi:10.1016/j.jtrangeo.2011.03.003. Schuur, E. A. G., et al. (2015), Climate change and the permafrost carbon feedback, Nature, 520, 171–179, doi:10.1038/nature14338. Semenov, V. A., T. Martin, L. K. Behrens, and M. Latif (2015), Arctic sea ice area in CMIP3 and CMIP5 climate model ensembles – Variability and change, Cryosphere Discuss., 9, 1077–1131, doi:10.5194/tcd-9-1077-2015. Smith, L. C., and S. R. Stephenson (2013), New trans-Arctic shipping routes navigable by midcentury, Proc. Natl. Acad. Sci. U. S. A., 110, E1191–E1195, doi:10.1073/pnas.1214212110. Smith, S. J., J. Edmonds, C. A. Hartin, A. Mundra, and K. Calvin (2015), Near-term acceleration in the rate of temperature change, Nat. Clim. Change, 5, 333–336, doi:10.1038/nclimate2552. Somanathan, S., P. Flynn, and J. Szymanski (2009), The Northwest Passage: A simulation, Transport. Res. Part A, 43, 127–135, doi:10.1109/wsc.2006.322929. Stephenson, S. R. (2012), Collaborative infrastructures: A roadmap for international cooperation in the Arctic, Arctic Yearbook 2012, 1, 311–333. Stephenson, S. R., L. C. Smith, L. W. Brigham, and J. A. Agnew (2013), Projected 21st-century changes to Arctic marine access, Clim. Change, 118, 885–899, doi:10.1007/s10584-012-0685-0. Stephenson, S. R., L. W. Brigham, and L. C. Smith (2014), Marine accessibility along Russia’s Northern Sea Route, Polar Geogr., 37, 111–133, doi:10.1080/1088937x.2013.845859. Stern, H. L., and R. W. Lindsay (2009), Spatial scaling of Arctic Sea ice deformation, J. Geophys. Res., 114, C10017. Stroeve, J., L. C. Hamilton, C. M. Bitz, and E. Blanchard-Wrigglesworth (2014), Predicting September sea ice: Ensemble skill of the SEARCH sea ice outlook 2008–2013, Geophys. Res. Lett., 41, 2411–2418, doi:10.1002/2014GL059388. Stroeve, J. C., V. Kattsov, A. Barrett, M. Serreze, T. Pavlova, M. Holland, and W. N. Meier (2012a), Trends in Arctic sea ice extent from CMIP5, CMIP3 and observations, Geophys. Res. Lett., 39, L16502, doi:10.1029/2012GL052676. Stroeve, J. C., M. C. Serreze, M. M. Holland, J. E. Kay, J. Maslanik, and A. P. Barrett (2012b), The Arctic’s rapidly shrinking sea ice cover: A research synthesis, Clim. Change, 110, 1005–1027, doi:10.1007/s10584-011-0101-1. Swart, N. C., J. C. Fyfe, E. Hawkins, J. E. Kay, and A. Jahn (2015), Influence of internal variability on Arctic sea-ice trends, Nat. Clim. Change, 5, 86–89, doi:10.1038/nclimate2483. Taylor, K. E., R. J. Stouffer, and G. A. Meehl (2012), An overview of CMIP5 and the experiment design, Bull. Am. Meteorol. Soc., 93, 485–498, doi:10.1175/BAMS-D-11-00094.1. Tebaldi, C., and R. Knutti (2007), The use of the multi-model ensemble in probabilistic climate projections, Philos. Trans. R. Soc., 365, 2053–2075, doi:10.1098/rsta.2007.2076. Transport Canada (1998), Arctic ice regime shipping system (AIRSS) standards. Ottawa. van Vuuren, D. P., et al. (2011), The representative concentration pathways: An overview, Clim. Change, 109, 5–31, doi:10.1007/s10584-011-0148-z. Vavrus, S. J., M. M. Holland, A. Jahn, D. A. Bailey, and B. A. Blazey (2012), Twenty-first-century Arctic climate change in CCSM4, J. Clim., 25, 2696–2710, doi:10.1175/jcli-d-11-00220.1. Verny, J., and C. Grigentin (2009), Container shipping on the Northern Sea Route, Int. J. Prod. Econ., 122, 107–117, doi:10.1016/j.ijpe.2009.03.018. Waugh, D. W., and V. Eyring (2008), Quantitative performance metrics for stratospheric-resolving chemistry-climate models, Atmos. Chem. Phys., 8, 5699–5713, doi:10.5194/acp-8-5699-2008. Zhang, R. (2015), Mechanisms for low-frequency variability of summer Arctic sea ice extent, Proc. Natl. Acad. Sci. U. S. A., 112, 4570–4575, doi:10.1073/pnas.1422296112.
STEPHENSON AND SMITH
CLIMATE MODEL INFLUENCE ON ARCTIC SHIPPING
343