Hindawi Publishing Corporation The Scientific World Journal Volume 2013, Article ID 408560, 6 pages http://dx.doi.org/10.1155/2013/408560
Research Article Influence of Disturbance on Soil Respiration in Biologically Crusted Soil during the Dry Season Wei Feng, Yu-qing Zhang, Bin Wu, Tian-shan Zha, Xin Jia, Shu-gao Qin, Chen-xi Shao, Jia-bin Liu, Zong-rui Lai, and Ke-yu Fa Yanchi Research Station, College of Soil and Water Conservation, Beijing Forestry University, Beijing 100083, China Correspondence should be addressed to Yu-qing Zhang;
[email protected] and Bin Wu;
[email protected] Received 6 September 2013; Accepted 26 November 2013 Academic Editors: D. Businelli and C. Sławi´nski Copyright © 2013 Wei Feng et al. This is an open access article distributed under the Creative Commons Attribution License, which permits unrestricted use, distribution, and reproduction in any medium, provided the original work is properly cited. Soil respiration (Rs) is a major pathway for carbon cycling and is a complex process involving abiotic and biotic factors. Biological soil crusts (BSCs) are a key biotic component of desert ecosystems worldwide. In desert ecosystems, soils are protected from surface disturbance by BSCs, but it is unknown whether Rs is affected by disturbance of this crust layer. We measured Rs in three types of disturbed and undisturbed crusted soils (algae, lichen, and moss), as well as bare land from April to August, 2010, in Mu Us desert, northwest China. Rs was similar among undisturbed soils but increased significantly in disturbed moss and algae crusted soils. The variation of Rs in undisturbed and disturbed soil was related to soil bulk density. Disturbance also led to changes in soil organic carbon and fine particles contents, including declines of 60–70% in surface soil C and N, relative to predisturbance values. Once BSCs were disturbed, 𝑄10 increased. Our findings indicate that a loss of BSCs cover will lead to greater soil C loss through respiration. Given these results, understanding the disturbance sensitivity impact on Rs could be helpful to modify soil management practices which promote carbon sequestration.
1. Introduction Biological soil crusts (BSCs) are diminutive communities consisting of bacteria, cyanobacteria, fungi, lichens, mosses, and liverworts, all of which form a cohesive thin horizontal layer in association with the mineral soil surface [1, 2]. BSCs have several important identified roles in desert ecosystems, including significant contribution to carbon (C) and nitrogen (N) input (an estimate of 1.0 Pg ha−1 and 30 Tg ha−1 for net uptake of C and N by biocrusts in arid and semiarid regions), soil stability, and influence over patterns of erosion [3–5]. In total, the deserts of the world are estimated to contain 10 Pg C [6], with 56 × 1012 g C held in cyanobacterial biomass (a component of biocrusts) in arid and semiarid regions [7]. These numbers illustrate that BSC can sequester substantial C in the crust layer [8]. Soil stability is a primary control over carbon sequestration of managed ecosystems in arid and semiarid regions [9]. Most studies worldwide have shown that a protective cover of BSC can be a critical factor in soil stability [1, 3]. However, BSCs are highly susceptible to
disturbance, especially in soils with low aggregate stability and dry conditions, such as sands in dry conditions [3, 10]. Studies on disturbance of BSCs have focused on soil nutrient losses, microbial communities, surface hydrology, erosion dynamic, and recovery rate [10, 11]. The impacts of disturbances on Rs in crusted soil have been less addressed. Rs is a major component of the biosphere’s carbon (C) cycle and represents approximate three-quarters of total ecosystem respiration [12], and thus changes in Rs ultimately affect C storage. Therefore it is unclear whether disturbances on BSC will alter desert ecosystems from functioning as carbon sinks to functioning as carbon sources [13, 14]. A recent study in the Kalahari suggests a complex process because inhibition of BSC development led to greater Rs losses [15]. We argue that more work is needed to understand the disturbance of different types of crusted soil on Rs. The landscape of the study area is characterized by a mosaic distribution of shrubs, BSCs, and bare land. Characteristics of the site are long dry periods and very infertile soils. Efforts to mitigate anthropogenic disturbance
2
The Scientific World Journal Table 1: Physical and chemical characteristics of the study sites. Values are the mean ± standard error. SOC (%)
TNC (%)
SBD (g⋅cm−3 )
TP (%)
Particle content (3 m apart from plants to minimize potential risk on Rs from roots and mycorrhiza. During each measurement, we used aluminium containers with a surface area of 22.89 cm2 to collect soil samples. In each disturbed quadrat and bare land plot, samples were collected by inserting three 5.4 cm diameter cutting rings into soil about 5 cm deep, two were carefully removed to the aluminium containers to measure soil water content (SWC), soil organic carbon (SOC), total nitrogen content (TNC), and soil particle content, and the other cutting ring was put by a hole round cover with filter paper to examine soil bulk density (SBD). In each undisturbed soil quadrat, the BSC layer was carefully removed using a small shovel before sample being collected (as above) and then the removed BSC layer was carefully collected to examine SBD. 2.3. Field Respiration Measurements. Rs was measured with a non-steady-state flow-through chamber (LI-6400-09 soil chamber, volume 1000 cm3 ) connected to the portable Li6400 (Li-COR, Lincoln, NE, USA). Measurements were performed at 2 h intervals on clear days from 7:00 a.m. to 19:00 p.m. on April 28, May 7, May 16, May 25, June 4, June 11, July 7, July 13, and July 25, 2010, during dry conditions and SWC was below 0.07 mm and photosynthesis of BSCs was limited (water compensation level of photosynthesis in BSCs is usually below 0.10 mm [16]). Soil temperature (Ts) of the top 2 cm of the soil profile was also recorded at each plot when conducting Rs measurements. The physical and chemical characteristics of the soils studied are shown in Table 1.
3 Soil respiration (𝜇mol m−2 s−1 )
The Scientific World Journal
Temperature (∘ C)
25 20 15 10 5 0
7:00
9:00
11:00 13:00 15:00 Time of a day
17:00
19:00
2.0 1.6 1.2 0.8 0.4 0.0 9:00
7:00
1.2
0.8
9:00
19:00
(b) Soil respiration (𝜇mol m−2 s−1 )
Soil respiration (𝜇mol m−2 s−1 )
(a)
1.6
7:00
17:00
HAC NAC BL
Temperature
0.4
11:00 13:00 15:00 Time of a day
11:00 13:00 Time of a day
15:00
17:00
19:00
1.6 1.2 0.8 0.4 0.0
7:00
9:00
11:00 13:00 Time of a day
15:00
17:00
19:00
HMC NMC BL
HLC NLC BL (c)
(d)
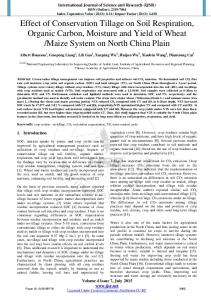
Figure 1: Diurnal variations in soil temperature (2 cm depth, bars a) and Rs in biocrusted soil (black solid circle), disturbed biocrusted soil (hollow circle), and bare land (upward triangle) in algae crusted soil (b), lichen crusted soil (c), and moss crusted soil (d). Error bars indicate standard deviation.
Description of thermally driven biological and soil microbial processes such as respiration is often based upon an Arrhenius model using the 𝑄10 exponential relationship [17]:
total porosity were calculated using the following equations, respectively: 𝛾𝑠 =
(𝑇−𝑇0 )/10
Rs (𝑇) = Rs10 𝑄10
,
(1)
where Rs is the total soil respiration at temperature 𝑇 and Rs10 the respiration at 10∘ C. The sample was oven-dried at 105∘ C to determine SWC. The samples were air-dried and homogenized, then passed through a 2 mm sieve, and analyzed for SOC by potassium dichromate oxidation-outer heating, TNC by semimicroKjeldahl method, soil particle content by a laser particle analyzer (Mastersizer 2000, Malvern Instruments Ltd., Malvern, UK), and SBD of disturbed and bare land soil by a Soil Moisture Equipment (Santa Barbara, CA, USA) model 0200 soil core sampler. SBD and total porosity of BSCs layer were determined by the wax seal method [18] and SBD and
100𝑔1 , {[(𝑔4 − 𝑔3 ) /𝜌1 − (𝑔2 − 𝑔1 ) /𝜌2 ] × (100 + 𝑊)}
(2)
where 𝛾𝑠 is soil bulk density (g⋅cm−3 ), same below; 𝑔1 is sample weight (g); 𝑔2 is sample weight completely wrapped by wax (g); 𝑔3 is original reading of electronic balance (g); 𝑔4 is reading of electronic balance with sample (g); 𝜌1 is specific gravity of water, 𝜌1 = 1.0 g⋅cm−3 ; 𝜌2 is specific gravity of wax, 𝜌2 = 0.9 g⋅cm−3 ; 𝑊 is water content of sample: 𝑓 = (1 −
𝛾𝑠 ) × 100, 𝜌𝑠
(3)
where 𝑓 is soil total porosity (%); 𝜌𝑠 is soil particle density (g⋅cm−3 ), 𝜌𝑠 = 2.65 g⋅cm−3 . 2.4. Statistical Analysis. Mean diurnal cycles of Rs and Ts were computed by averaging the hourly means for each time
The Scientific World Journal Soil respiration (𝜇mol m−2 s−1 )
4
Temperature (∘ C)
30
25 20 15 10 5
4-28 5-7 5-16 5-25 6-4 6-11 7-7 7-13 7-25 Date (M-D)
2.0 1.6 1.2 0.8 0.4 0.0
4-28 5-7 5-16 5-25 6-4 6-11 7-7 7-13 7-25 Date (M-D)
HAC NAC BL
Temperature
(b)
1.6 1.2 0.8 0.4 0.0
4-28 5-7 5-16 5-25 6-4 6-11 7-7 7-13 7-25 Date (M-D)
HLC NLC BL
Soil respiration (𝜇mol m−2 s−1 )
Soil respiration (𝜇mol m−2 s−1 )
(a)
1.6 1.2 0.8 0.4 0.0
4-28 5-7 5-16 5-25 6-4 6-11 7-7 7-13 7-25 Date (M-D)
HMC NMC BL (c)
(d)
Figure 2: Mean daily soil temperature (a) and Rs in biocrusted soil (black solid circle), disturbance biocrusted soil (hollow circle), and bare land (upward triangle) in algae crusted soil (b), lichen crusted soil (c), and moss crusted soil (d). Error bars indicate standard deviation. Table 2: The effects of soil cover type (𝐶), measurement time (𝑇), and their interactions (𝐶 × 𝑇) on mean daily Rs (𝜇mol m−2 s−1 ) in the three biocrusted soil cover areas.
𝐶 𝑇 𝐶×𝑇
df 2 8 16
Algae crust cover area 𝐹 𝑃 33.65 0.046 39.27