Jul 10, 1993 - Inc., Sarnia, Ontario. This project was supported in part by a NAPIAP. Grant NA-21 provided by Northeastern Area State and Private For-.
Arch. Environ. Contam. Toxicol. 26, 124-129 (1994)
ARCHIVES
OF
Environmental Contamination a n d Toxicology © 1994 Springer-Verlag New York Inc.
Influence of Exposure Duration on the Toxicity of Triclopyr Ester to Fish and Aquatic Insects D. P. Kreutzweiser t, S. B. Holmes 1, D. C. Eichenberg 2'* i Forestry Canada, Forest Pest M~,nagement Institute, 1219 Queen St. East, Sault Ste. Marie, Ontario, P6A 5M7, Canada
2 Biology and Chemistry Department, Lake Superior State University, Sanlt Ste. Marie, Michigan 49783, USA Received: 7 May 1993/Revised: 10 July 1993
Abstract. Flow-through toxicity tests were conducted to determine the effects of exposure time on the toxicity of triclopyr butoxyethyl ester (Garlon ® 4) to fish (rainbow trout and chinook salmon) and stream insects (Hydropsyche sp. and lsonychia sp.). The toxicity of triclopyr ester to fish increased with exposure time, but the rate of increase in toxicity declined with increasing exposure duration. Median lethal concentrations for rainbow trout exposed for 1, 6, or 24 h were 22.5, 1.95, and 0.79 mg/L triclopyr ester (expressed as acid equivalent, nominal concentrations), respectively. Comparable values for chinook salmon were 34.6, 4.7, and 1.76 mg/L. The toxicity of triclopyr ester to aquatic insects also increased with increasing exposure time, but was considerably less than the toxicity to fish. There was no significant mortality (chi-square p > 0.05) of insects following 3-h exposures to the maximum test concentration of approximately 110 mg/L. Median lethal concentrations following 9- and 24-h exposures were 14.9 and 4.0 ml/L for Hydropsyche sp., and 37.0 and 8.8 mg/L for Isonychia sp., respectively. At each exposure time in the toxicity tests, there was a sharp increase in mortality over relatively small increases in concentration, resulting in extremely steep slopes of the probit lines (6.3-33.8), and indicating an apparent response threshold. The herbicide exhibited delayed lethal effects, particularly in fish, but only at short term exposures to higher concentrations. The risk of adverse effects on fish and aquatic insects from triclopyr ester contamination, based on the results of these time-toxicity tests, is discussed.
The herbicide triclopyr, formulated as the butoxyethyl ester (Garlon ® 4; [(3,5,6-trichloro-2-pyridinyl)oxy]acetic acid, butoxyethyl ester) has been registered for use in forest vegetation management in the United States since 1979. This herbicide has
*Current address: Biology Dept., Central Michigan University, Mt. Pleasant, M148859. Correspondence to: D. P. Kreutzweiser
been registered for ground applications in Canadian forestry (under the trade name Release) since 1991. Registration for aerial use in Canada is currently being pursued by the manufacturer (Campbell 1991). Triclopyr butoxyethyl ester (TBEE) is effective in forestry for both conifer release and site preparation. Applications of Garlon 4 in forest vegetation management programs, particularly when applied aerially, can result in residues of TBEE in water bodies via runoff, aerial drift, or inadvertent overspray. This contamination may pose a risk of adverse effects to aquatic organisms. The use of TBEE in the United States, and the registration submission for aerial use of this herbicide in Canadian forests, have increased the need for a thorough evaluation of the potential for harmful effects on aquatic organisms and their environment. Previous investigators have determined that TBEE is quite toxic to salmonids with acute median lethal concentrations of 0.74-2.7 mg/L (average of 2.0 mg/L from seven reported values) for rainbow trout (Oncorhynchus mykiss) (USDA 1984; Wan et al. 1987; Servizi et al. 1987; Morgan et al. 1991; Wan et al. 1991), 0.87 mg/L for coho salmon (Oncorhynchus kisutch) (Johansen and Geen 1990), and 2.7 mg/L for chinook salmon (Oncorhynchus tshawytscha) (Wan et al. 1987). Several of these investigators have concluded that the risk of fish mortality from exposure to this herbicide in vegetation management applications is quite high, but these toxicity assessments were derived from 96-h bioassays and, apart from Johansen and Geen (1990), were conducted in static test systems. In natural water bodies, aqueous residues resulting from pesticide applications are highly transient (Muirhead-Thomson 1987), and even in standing water, may be rapidly dissipated and reduced by natural degradation processes (McCall et al. 1988). In previous field experiments with TBEE, residues in stream water rapidly declined within several hours of the applications (Thompson et al. 1991; Mayes et al. 1989). For this reason, standard 96-h toxicity tests are not necessarily appropriate for assessing risk to aquatic organisms of pulsed or short-term exposures to contaminates in water courses (Moore et al. 1990; Crossland and La Pointe 1992). Toxicity tests that employ short-term and variable exposure durations can provide insight into delayed toxic effects (Moore et al. 1990) and can facilitate increased accuracy in predicting
Time-Toxicity Tests with Triclopyr Ester
TOXICANT
125
WATI::R
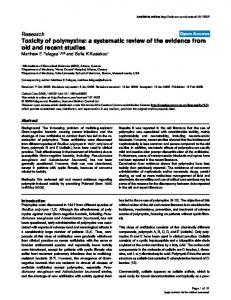
Fig. 1. Laboratory flow-through test unit
the impact o f toxicants on aquatic organisms under natural conditions (Parsons and Surgeoner 1991; Poirier and Surgeoner 1987). The objective of our toxicity tests was to determine the effects of exposure time on toxicity of T B E E to rainbow trout and c h i n o o k salmon in laboratory flow-through units, within a realistic exposure framework. This approach was also used to assess the time-toxicity relationships for aquatic insects, for comparison to results from 1-h m a x i m u m - h a z a r d tests previously conducted (Kreutzweiser et al. 1992). These investigations into effects of exposure duration on toxicity were expected to provide some predictive capability for estimating the risk o f fish and invertebrate mortality in water bodies contaminated b y T B E E .
Materials and Methods Experiments were conducted in laboratory flow-through test units that were modified from the recirculating system described by Rodrigues and Kaushik (1984). Ten test units were contained in a large tank, which directed the run-off from each unit through a filter system and into the laboratory outflow. Natural surface water (drawn from Lake Superior) was pumped to a head tank in the laboratory to provide a gravity-fed water supply, which was used for the toxicity tests. Water temperature was controlled, when ambient water temperatures fell below 10°C, by mixing ambient and heated water. Each test unit consisted of a glass mixing chamber and a dosing trough (Figure 1) set at an angle in the tank to provide an appropriate velocity of water flow for the test animals in the dosing trough (approximately 5 cm/s for fish and 20 crn/s for insects). Water from the head tank drained through tygon tubing into the mixing chambers of the test units, through the dosing troughs, and into the collecting tank. The dosing troughs that were used for testing aquatic insects were longitudinally divided into two sections (Figure 1) to allow duplicate testing of a species at each concentration/duration. The insect troughs contained pieces of stainless steel mesh to provide sites for attachment. Fish were tested in larger, single dosing troughs to provide greater water volumes. Test animals were not fed during the experiments.
The TBEE was delivered to the mixing chambers from stock solutions, by a multichannel peristaltic pump. Concentrations were varied by measuring the water inflows to individual test units and adjusting the concentrations of the test material in the stock solutions. Stock solutions (Garlon ® 4 mixed in de-chlorinated tap water) were dispensed from dark bottles set in a shaker that was operated for 30 s every 15 min for the duration of the dosing periods. Control units were operated in similar fashion, without the addition of the test material. Residue analyses were not available for these experinaents (because of limited resources allocated to the project), and all toxicity test results are reported as nominal concentrations of triclopyr butoxyethyl ester (TBEE), expressed as mg/L acid equivalent. Nominal concentrations were expected to represent actual concentrations because (1) the mixing chambers were designed and tested to ensure adequate mixing, (2) pesticide delivery to the mixing chambers was constant, (3) the close proximity of the dosing troughs to the mixing chambers and the high flow rates of the water reduced the potential for pesticide adsorption or degradation, and (4) nominal concentrations were corrected for the actual pesticide delivery rate (measured separately for each channel of the peristaltic pump for each experiment) and the water inflow volume for each test unit. Rainbow trout and chinook salmon eggs were obtained from a commercial hatchery and reared in the Lake Superior State University Aquatic Research Laboratory, where the aquatic toxicology laboratory is also located. Fish were used in the toxicity tests several weeks after they had reached the feeding stage and were 30-50 mm in length. Aquatic insect larvae (the mayfly lsonychia sp. and the caddisfly Hydropsyche sp.) were collected from local streams, transported to the laboratory, and acclimated to the test system for 24-48 h. All insects were in late instar stages of development. The rainbow trout and chinook salmon were exposed to the TBEE treatments for 1, 6, or 24 h, at each of three or four concentrations. Mortality was recorded at 1, 6, 24, 48, and 96 h after the treatments were begun. Data from previous experiments (Kreutzweiser et al. 1992) indicated that 1-h exposures to TBEE at 80 mg/L or greater were not lethal to most aquatic insects. Consequently, the exposure durations for the aquatic insects in these experiments were set at 3, 9, and 24h, with a maximum test concentration of approximately 110 nag/L. Mortality of insects (no response to gentle prodding) was recorded at 1, 6, 24, 48, and 72 h after the treatments were initiated. Several preliminary tests were required for all species to determine a suitable concentration range for the three exposure durations in final time/toxicity tests. Estimates of lethal concentrations to fish and aquatic insects were obtained by probit and logistic analysis of the concentration-response data at each exposure duration, using the POLO-PC program of Russell et al. (1977). While estimates of lethal concentrations from the two models were similar, the logit model tended to yield broader confidence intervals, and only the probit results are presented. A test in POLO-PC for equality of response between replicates in aquatic insect tests was used to determine if mean lethal concentration estimates and confidence intervals could be calculated. When the test for equality was rejected (p < 0.05), lethal concentration estimates were calculated from the replicates separately. During the rainbow trout bioassays, water temperatures ranged from 17 to 19°C, dissolved oxygen (D.O.) was 9.8-10.7 mg/L, and pH was 6.8-7.0. The chinook salmon bioassays were conducted when temperatures were 10-11°C, D.O. was 10.1-12.4 mg/L, and pH was 6.8-7.4. During the aquatic insect bioassays, water temperatures were 9-11°C, D.O. was 10.5-11.9 mg/L, and pH was 7.0-7.5. Hardness was always 40-50 mg/L C a C O 3.
Results Toxicity to Fish A t each exposure time in the fish toxicity tests, there was a sharp increase in mortality over relatively small increases in
D.P. Kreutzweiseret al.
126
Table 1. Mortality at 96 h of rainbow trout exposed to triclopyr butoxyethyl ester (expressed as mg/L acid equivalent) for 1, 6, and 24 h in flow-through toxicity tests Exposure Concentration duration Dead/ Estimates of lethal (mg/L) (h) Total concentrations (mg/L) 13.0 17.6 24.0 27.5
1 1 1 1
0.91
6
1.97
6
2.40
6
0.73 0.83 0.86 0.95
24 24 24 24
Control
None
0/15 1/14 10/15 1-h LC10 (95%CI) = 18.1 (14.2-20.0), LC50 (95%CI) = 13/15 22.5 (20.8-24.0), slope = 13.5 1/15 2/15 6-h LC10 = 1.23, LC50 = 1.95, slope = 6.3 15/15 No confidence intervals estimated because of poor fit 2/15 12/15 13/15 24-h LC10 (95%CI) = 0.72 (0.66-0.75), LC50 (95%CI) = 15/15 0.79 (0.764).81), slope = 33.1 0/15
Table 2. Mortality at 96 h of chinook salmon exposed to triclopyr butoxyethyl ester (expressed as mg/L acid equivalent) for 1, 6, and 24 h in flow-through toxicity tests Exposure Concentration duration Dead/ Estimates of lethal (mg/L) (h) Total concentrations (mg/L) 21.5 26.9 34.7 38.7
1 1 1 1
2.8 3.8 4.7 5.5
6 6 6 6
1.55 1.75 1.85
24 24 24
1.95
24
Control
None
0/15 2/15 7/15 1-h LC10 (95%CI) = 26.8 (20.9-29.6), LC50 (95%CI) = 11/15 34.6 (31.8-38.4), slope = 11.6 0/15 1/15 7/15 6-h LC10 (95%CI) = 4.0 (3.4-4.3), LC50 (95%CI) = 14/15 4.7 (4.4--5.0), slope = 18.5 0/15 9/15 10/15 24-h LC10 = 1.61, LC50 = 1.76, slope = 33.8 14/15 No confidence intervals estimated because of poor fit 0/15
concentration, resulting in extremely steep slopes of the probit lines (6.3-33.8), and little differences between LC50s and LC10s (Tables 1 and 2). In preliminary and final toxicity tests, there was essentially an "all or nothing" response in terms of mortality. For example, the 24-h exposure to rainbow trout resulted in 13% mortality at 0.73 mg/L and 80% mortality at 0.83 mg/L, while the LC50 and LC10 estimates were 0.79 and 0.72 mg/L, respectively (based on nominal concentrations). The steepness of the concentration-response curves appeared to be related to exposure duration, with steeper slopes at longer exposures (r 2 = 0.80, p = 0.01 linear regression of slope on exposure duration). The steep concentration-response curves presented difficulties in determining response midpoints. In many cases, several
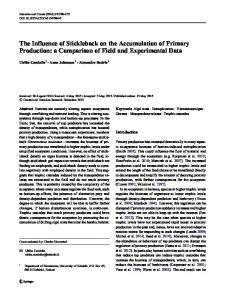
tests were necessary at a given exposure duration to establish concentration ranges and response endpoints between 0 and 100% mortality. In some instances, the concentration-response relationship resulted in a poor fit of the data to the probit model and no confidence limits for the estimated lethal concentrations. Because of the poor fit of the concentration-responsedata to the probit model in some toxicity tests, the actual response data are presented (Tables 1-4) to provide "best eye fit" support of the estimated median lethal concentration. Exposure duration had a marked influence on the toxicity of TBEE to both species of salmonids. Increased exposure time resulted in substantial increases in toxicity (Tables 1 and 2). While toxicity to fish increased with exposure time, the rate of increase in toxicity declined with increasing exposure duration. The increase in toxicity was much greater between 1- and 6-h exposures than between 6- and 24-h exposures, resulting in a nonlinear relationship between exposure time and acute toxicity to fish (Figure 2). At all exposure durations, TBEE was 1.52.4 times more toxic to rainbow trout than to chinook salmon. This suggests that rainbow trout are more sensitive to TBEE, but the higher toxicity to rainbow trout may be at least partly due to the different temperatures at which the tests were conducted (18°C for rainbow, 1I°C for chinook). Sublethal or behavioral effects of the TBEE treatments were not quantified or systematically recorded. However, recorded observations indicated that behavioral alterations including disorientation, coughing, gill flaring, and surfacing were often evident within 1 h of exposure initiation, even when mortality did not occur for up to 24 h. It was further observed that all fish that eventually died first exhibited obvious behavioral effects and most fish that exhibited disorientation (side swimming, surfacing) did not recover.
Toxicity to Aquatic Insects There was no significant mortality (p > 0.05, chi-square test of control vs. treated) of aquatic insects exposed for 3 h at maximum test concentrations (102-114 mg/L). The concentrationresponse data from aquatic insects exposed to TBEE for 9 and 24 h were more variable than the results with fish, but again indicated a sharp response in terms of mortality with steep probit lines (Tables 3, 4). Because of variable response data between replicates (POLO-PC test of equality rejected, p < 0.05), some replicates could not be combined and results in those cases are presented separately. The toxicity tests indicated that the aquatic insects were much less sensitive to TBEE than the salmonids. As with salmonids, exposure duration had considerable effect on the toxicity of TBEE to aquatic insects, with higher toxicity at longer exposure periods.
Delayed Lethal Effects The TBEE treatments exhibited delayed lethal effects, particularly in fish. This delayed toxicity was related to exposure duration and differed between species. Ratios of total mortality at the end of the observation periods (96 h for fish, 72 h for insects) to total mortality at the end of the exposure periods indicated that delayed toxicity was greater at shorter exposures (Table 5). This trend was less apparent in the limited data for aquatic insects, but, in fish toxicity tests, there was 4.5 and 34
Time-Toxicity Tests with Triclopyr Ester
127
Table 3. Mortality at 96 h of Hydropsyche sp. exposed to triclopyr butoxyethyl ester (expressed as mg/L acid equivalent) for 3, 9, and 24 h in flow-through toxicity tests
Concentration (mg/L)
Exposure duration (h)
114 27 32 40 2.7 7.0 11.8 14.0 Control
3 9 9 9 24 24 24 24 None
Dead/Total Rep 1
Rep 2
Estimates of lethal concentrations (mg/L)
2/15 2/15 3/15 9/15 1/15 6/15 9/15 15/15 0/30
0/15 0/15 2/15 12/15 1/15 5/15 12/15 13/15 2/30
No significant mortality at maximum test concentration Test of equality accepted (p > 0.05)--replicates combined LC10 (90%CI) = 29.3 (23.2-32.1), LC50 (90%CI) = 37.0 (34.0~2.9), slope = 12.6 Test of equality accepted (p > 0.05)---replicates combined LC10 (95%CI) = 5.2 (3.0-6.6), LC50 (95%CI) = 8.8 (7.2-10.1), slope = 5.6
Table 4. Mortality at 96 h of Isonychia sp. exposed to triclopyr butoxy ethyl ester (expressed as mg/L acid equivalent) for 3, 9, and 24 h in flow-through toxicity tests Concentration (rag/L)
Exposure duration (h)
102 5.2 9.3 17.6 29.7 1.5 4.0 9.5
3 9 9 9 9 24 24 24
Control
None
Dead/Total Rep 1
Rep 2
Estimates of lethal concentrations (mg/L)
0/15 1/15 7/15 6/15 14/15 4/15 9/15 15/15
0/15 3/15 0/15 8/15 15/15 1/15 2/15 15/15
No significant mortality at maximum text: concentration Test of equality rejected (p < 0.05), replicates separate No confidence intervals estimated because of poor fit Rep 1 LC10 = 6.1, LC50 = 14.9, slope = 3.3 Rep 2 LC10 = 16.2, LC50 = 17.6, slope = 35.6 Test of equality rejected (p < 0.05), replicates separate No confidence intervals estimated because of poor fit Rep 1 LC10 = 3.5, LC50 = 4.0, slope = 21.3 Rep 2 LC10 = 4.0, LC50 = 4.5, slope = 25.5
1/ 15
1/ 15
LC50 (mg/L) 40r ]
351~\
--)