the depiction of pedunculated and sessile polyps was assessed qualitatively. ... parameters on the rippling artifact and on associated polyp distortion in 2D ...
Experimental Studies Bruce R. Whiting, PhD Elizabeth G. McFarland, MD James A. Brink, MD
Index terms: Colon, CT, 75.12115, 75.12117 Colon neoplasms, 75.311 Computed tomography (CT), artifact Computed tomography (CT), image processing, 75.12115, 75.12117 Computed tomography (CT), threedimensional, 75.12115, 75.12117 Radiology 2000; 217:165–172 Abbreviations: T ⫽ table increment 2D ⫽ two-dimensional 3D ⫽ three-dimensional 1
From the Electronic Radiology Lab (B.R.W.) and Abdominal Imaging Section (E.G.M.), Mallinckrodt Institute of Radiology, 510 S Kingshighway Blvd, St Louis, MO 63110; and the Department of Diagnostic Radiology, Yale University School of Medicine, New Haven, Conn (J.A.B.). Received September 22, 1999; revision requested November 5; revision received February 1, 2000; accepted February 8. Supported in part by the National Cancer Institute, ProstateColon-Lung-Ovary Preventative Trial, grant N01-CN-25516; the Washington University Cancer Center; the GE Association of University Radiologists; and the Mallinckrodt Institute of Radiology Summer Research Program. Address correspondence to B.R.W. (e-mail: bwhiting @wuerl.wustl.edu).
©
RSNA, 2000
Author contributions: Guarantors of integrity of entire study, B.R.W., E.G.M, J.A.B.; study concepts and design, B.R.W., E.G.M, J.A.B.; definition of intellectual content, B.R.W., E.G.M., J.A.B.; literature research, E.G.M., B.R.W.; clinical studies, E.G.M., J.A.B.; experimental studies, B.R.W., E.G.M., J.A.B.; data acquisition, B.J.W., E.G.M.; data analysis, B.R.W., E.G.M., J.A.B.; manuscript preparation, editing, and review, B.R.W., E.G.M., J.A.B.
Influence of Image Acquisition Parameters on CT Artifacts and Polyp Depiction in Spiral CT Colonography: In Vitro Evaluation1 PURPOSE: To quantify the effects of spiral computed tomographic (CT) acquisition parameters on the magnitude of three-dimensional (3D) rippling artifacts and polyp depiction. MATERIALS AND METHODS: An in vitro colon phantom was constructed with air-filled acrylic cylinders that contained synthetic polyps of 3–13 mm. The phantom was submerged in fluid and positioned at four angles of inclination relative to the z axis. Image data were acquired at collimation and pitch combinations of 3 mm and 1.67 and 5 mm and 1.6, respectively. Rippling artifacts were quantified by measuring the longitudinal variation of in-plane phantom edge width, and the influence of these artifacts on the depiction of pedunculated and sessile polyps was assessed qualitatively. RESULTS: The in-plane magnitude of the rippling artifact was a function of the angle of inclination relative to the longitudinal axis and the table increment. The through-plane periodicity of the artifact was equal to one-half the table increment. CONCLUSION: The table increment and angle of inclination of the surface of the object relative to the z axis determine the periodicity and magnitude of the rippling artifact at 3D spiral CT colonography. Although the depiction of small pedunculated polyps was not compromised, some sessile polyps were degraded by the artifact.
Spiral computed tomographic (CT) colonography is a rapidly evolving technology that permits interactive two-dimensional (2D) and three-dimensional (3D) visualization techniques for the detection of colorectal polyps (1– 8). This process involves a conversion of 2D data sets into 3D images that simulate endoscopic views at fiberoptic colonoscopy. The final image quality is a function of several variables along a fairly complex “image chain”; however, the acquisition step establishes fundamental limits for the entire process. We have observed rippling artifacts introduced by the interpolation of spiral CT projection data that propagate through the 3D images and can distort the depiction of polyp morphologies (9). A better understanding of this artifact may be important as future clinical applications extend beyond transverse section– based image analysis with advances in 3D volumetric CT acquisition. Our purpose was to quantitatively characterize the effect of specific spiral CT acquisition parameters on the rippling artifact and on associated polyp distortion in 2D source images and to qualitatively assess the artifact-related degradation of the depiction of polyps with different sizes and morphologies in 3D volume-rendered images. The measurement tools and results of this study may be used to optimize system performance for spiral CT colonography, with further application to multiple– detector row CT acquisition.
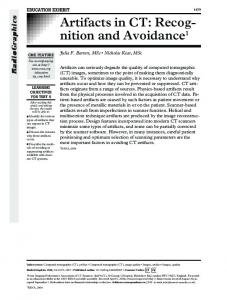
MATERIALS AND METHODS Phantom Construction We designed a phantom (9) to simulate the colon in various degrees of distention, with polyps of various shapes and sizes (Fig 1a). The phantom was constructed with polymethyl 165
Scanning Values of Collimation, Table Travel, and Angle of Inclination
Collimation (mm)
Travel (mm/sec)
Angle ⍜ (degrees)
Longitudinal Full Width at Half Maximum (mm)*
5 5 5 5 5 5 3 3 3 3 3 3
8 8 5 8 10 8 5 5 3 5 6 5
0.2 22.8 45.9 45.8 45.7 66.9 0.4 24.5 46.5 46.4 46.4 68.6
5.9 5.9 5.0 5.9 6.5 5.9 3.6 3.6 3.0 3.6 3.9 3.6
Edge Width Variation† (mm)
Longitudinal Periodicity‡ (mm)
0.10 ⫾ 0.03 0.56 ⫾ 0.04 0.79 ⫾ 0.02 1.39 ⫾ 0.04 2.26 ⫾ 0.07 3.27 ⫾ 0.40 0.11 ⫾ 0.02 0.34 ⫾ 0.0 0.62 ⫾ 0.14 0.91 ⫾ 0.08 1.23 ⫾ 0.03 2.20 ⫾ 0.35
NA 3.70 2.46 3.85 4.98 3.55 NA 2.46 1.48 2.46 2.82 2.42
Note.—NA ⫽ not applicable. * Refers to the section sensitivity profile, estimated from reference 12. † Edge width variation is the SD of the in-plane distances between two thresholds. ‡ Longitudinal periodicity is the position of the first harmonic of the Fourier transform of the edge width as a function of longitudinal position.
methacrylate (Plexiglas; AtoHaas North America, Philadelphia, Pa), with a density of 1.23 g/mL and with CT attenuation of approximately 150 HU. While the difference in attenuation between the acrylic and the soft tissue was recognized, experimental edge profile measurements of air-acrylic and air-water interfaces revealed no qualitative difference between their profile structures other than a scale change. Three sealed acrylic tubes (length, 230 mm; wall thickness, 8 mm; inner diameters, 25.4, 38.1, and 50.8 mm) were used to simulate the colonic lumen in varying degrees of distention. The straight, smooth surface of the tubes allowed exact quantification of artifact magnitude. The cylinder axes were placed horizontally and were aligned vertically above each other, 13 mm apart. To achieve comparable attenuation (and hence signal-to-noise ratio) with techniques used clinically, the cylinders were immersed in a liquid-filled box made of 1-inch acrylic walls, with outer dimensions of 30 cm. The cylinders were held in place by sliding panels with circular holes, which were fitted to the cylinders to counteract buoyancy effects. The entire phantom could be rotated in the horizontal plane to provide arbitrary angles of inclination between the cylinder axes and the longitudinal axis of the gantry. Two polyp morphologies were included in the phantom. Pedunculated polyps were made by attaching acrylic spheres to the inner surface of the cylinder. Sessile polyps were created with a “sunken sphere” method: By using a ball 166
䡠
Radiology
䡠
October 2000
mill, a hole was drilled to a defined depth into the tube wall; this hole opened partially into the inside of the tube. Acrylic spheres with the same radius of curvature as the machined semispherical holes were glued in place so that they protruded into the inner volume with precise geometry. Once the test objects were fabricated, actual positions and heights were verified by using a combination of calipers and bore gauges. A total of six polyps were constructed with acrylic spheres and differed in size and morphology to approximate a clinically relevant range (Fig 1b). The first two polyps were pedunculated, measuring 13 mm (polyp 1) and 6 mm (polyp 2) in diameter. The next four polyps were sessile, with varying width-by-height dimensions of 11 ⫻ 1 mm (polyp 3), 11 ⫻ 3 mm (polyp 4), 6 ⫻ 2 mm (polyp 5), and 3 ⫻ 1 mm (polyp 6). These six polyps were arranged along a line approximately 35 mm apart. An identical row of spheres was mounted across the inner wall of the cylinders and separated by 90°, so that the two rows were arranged at the four o’clock and seven o’clock orientations.
Image Acquisition The phantom was placed on the CT table, with the middle cylinder (38-mm diameter) in the center of the gantry, and was positioned at four angles of inclination relative to the z axis (approximately 0°, 25°, 45°, and 65°). Images were acquired by using standard clinical protocols currently used for single– detector row CT colonography (Table). Spiral CT
Figure 1. (a) Photograph of end view of phantom demonstrates cylinders arranged vertically, with incorporated synthetic polyps. (b) Sketch of side view of cylinders shows the sizes and shapes of the polyps (pedunculated and sunken spheres).
images were acquired by using a Somatom-Plus 4 scanner (Siemens Medical Systems, Iselin, NJ), with 120 kVp and 210 mAs. Collimation and pitch settings were 3 mm and 1.67 and 5 mm and 1.6, respectively, across the four angles of inclination. Additional scans were obtained at pitch values of one and two at a 45° angle of inclination. Transverse images were reconstructed with a 256-mm2 field of view, which resulted in in-plane pixel dimensions of 0.5 mm. The section reconstruction interval was 1 mm, which resulted in greater than 60% overlap relative to the effective section thickness (from 66% for 3-mm collimation, with a pitch of one, to 85% for 5-mm collimation, with a pitch of two).
Image Analysis Rippling artifact.—For quantitative analysis, the source image data sets were transferred to an independent research workstation (Sparc 10; Sun Microsystems, Mountain View, Calif), where the images were converted to a 12-bit image volume by using commercially available software (ANALYZE; Biomedical Imaging Resource, Mayo Foundation and Clinic, Rochester, Minn). The methods, described later, were developed to quantify each of the expected artifacts in the CT data sets. Image sets were viewed and analyzed by Whiting et al
Figure 2. Coronal multiplanar reformation along the long axis of the 38-mm cylinder, which was scanned with 5-mm-collimation, a 10-mm table increment (T), and a 45° angle of inclination to the z axis. Insert shows rippling artifact, with the longitudinal dimension of the artifact equal to T/2 (vertical axis is longitudinal pixel number [unit of distance, 1.0 mm]; the horizontal axis is transverse pixel number [unit of distance, 0.5 mm]).
Figure 3. Schematic representation of scanning geometry used for acquisition protocols. C ⫽ collimation.
using code written in MATLAB (MathWorks; Natick, Mass). We hypothesized that the rippling artifact is the 3D volume-rendered counterpart of the spiral “stair-step” artifact in the 2D reformations, which consists of periodic changes along the longitudinal axis in the sharpness of the air–plastic interface and is due to the interpolation of spiral projection data in the reconstruction process (10,11). Because of its small magnitude and extended spatial extent, this artifact is impossible to observe or measure in an individual transverse CT image. Thus, longitudinal reformations of the tube permitted adequate depiction of the artifact for measurement (Fig 2). In reformations through the horizontal diameter, components of the stair-step artifact at the simulated air-tissue interface are coplanar and can be anVolume 217
䡠
Number 1
alyzed by using 2D techniques. For convenience, we report the results of this analysis in terms of the in-plane (transverse horizontal) component magnitude and the through-plane (longitudinal) periodicity. An illustration of the scanning geometry of the physical phantom is shown in Figure 3. For the measurement of the rippling artifact, various methods were studied (9) to characterize the boundary surfaces of the phantom. The metric finally selected to measure the rippling artifact was based on the edge width in the transverse plane (Fig 4). This was computed as the distance between two points in the image edge, which corresponded with attenuation values that had been chosen to provide normalized and stable measurements (9). Specifically, an attenuation value was determined that minimized the variation from a straight line fitted through the center of the edge, nominally halfway between the air and plastic attenuation values. Two thresholds, for example, ⫾100 HU, were selected symmetrically about this minimizing attenuation value, and the distance between the corresponding points was measured. Since the partial volume blurring of the edge has a relatively linear profile, a normalized width could be computed by multiplying by the ratio of the total edge height to the difference of the thresholds. The observed edge width, when plotted as a function of longitudinal distance, contained complex waveforms.
Two techniques were used to characterize them. First, in the spatial domain, the mean and SD were calculated to describe the central tendency and variation; second, in the frequency domain, the Fourier transform was computed to measure the longitudinal periodicity and the inplane magnitude of the rippling artifact. Qualitative evaluation of polyp depiction.—For the qualitative analysis of polyp depiction, the source image data sets were transferred to an independent 3D workstation (O2; Silicon Graphics, Mountain View, Calif). Perspective volume-rendered images were evaluated qualitatively with the consensus of two reviewers (E.G.M. and J.A.B.). The perspective volume-rendered images were generated by using VITREA 1.2 (Vital Images, Minneapolis, Minn). All 3D endoscopic views were generated by using constant rendering parameters (field of view, perspective lighting, and nonlinear opacity assignment of the attenuation data) that were based on the findings of our prior investigation (3). Given the multiple rendering parameters that influence image content, it is important to hold these parameters constant while assessing the influence of the acquisition parameters. Since the field of view has a large influence on lesion depiction, a 45° field of view was chosen to exemplify a typical endoscopic view, with a long viewing distance to profile the lesions for optimal visualization. The reviewers evaluated the depiction of each polyp with the different acquisition protocols by using four-point grading scales to determine the overall morphologic depiction (a grade of 0 meant that the polyp was not depicted; 1, depiction was fair; 2, depiction was good; or 3, depiction was excellent) and the degree to which the rippling artifact degraded the conspicuity of the synthetic polyps (a grade of 0 meant that no degradation was present; 1, degradation was mild; 2, degradation was moderate; or 3, degradation was severe).
RESULTS Rippling Artifact Quantification Representative signal data for the width variation are shown in Figure 5. The waveform is seen to be complex; in this instance, the width was 3–7 mm, with a mean of 5 mm. The rippling artifact is hypothesized to be proportional to the SD of this waveform. Because the analysis of the artifact in different cylinders revealed no dependence on the cylinder diameter, results are presented for
CT Artifacts and Polyp Depiction in Spiral CT Colonography
䡠
167
only the middle cylinder that was placed at the isocenter of the gantry. In the Table, values for various scanning values of collimation, table travel, and angle of inclination are presented. The magnitude of the rippling increased linearly (r ⫽ 0.988) with the product of the table increment and the tangent of the angle of inclination (Fig 6). This product was equal to the in-plane displacement of the cylinder wall for each rotation of the gantry. The in-plane magnitude of the artifact quickly approached several millimeters as surfaces became increasingly oblique to the longitudinal axis. Insight into the complex structure of the waveforms can be gained by Fourier analysis techniques (Figs 7, 8) (9). Fundamental frequencies correspond to table increment per gantry revolution, with strong first harmonics indicating a sampling distance characteristic of the 180° linear interpolation process (T/2), where T is table increment. The existence of a fundamental frequency component indicates asymmetry or modulation in the stair-step waveform. For images acquired at a constant pitch but with varying angles of inclination, the spatial spectra for edge width variation are plotted in Figures 7 and 8b. Note that the position of the harmonics is constant and corresponds to a constant periodicity of T/2, with a magnitude that increases proportional to the tangent of the angle of inclination. In Figure 8, the angle of inclination (45°) is held constant, and the pitch is varied. Here, the position of the components shifts proportional to the travel distance, with a dominant component corresponding to T/2. In all cases, the spectral magnitude also increases linearly with travel distance (pitch).
Figure 4. Binary image of coronal multiplanar reformation obtained after the application of two thresholds 200 HU apart (⫺400 HU, ⫺600 HU) shows the variation in the edge width (vertical axis is longitudinal pixel number [unit of distance, 1.0 mm]; horizontal axis is transverse pixel number [unit of distance, 0.5 mm]).
Qualitative Evaluation of Polyp Depiction
Figure 5. Plot of edge width, as determined by measuring in-plane width between two thresholds, versus longitudinal position for a protocol of 3-mm collimation, a 5-mm table increment, and a 45° inclination angle. The corresponding Fourier spectrum is seen in Figure 8b. The rippling artifact is generated by the variation in width in the longitudinal direction.
The consensus assessment of overall morphologic depiction and degradation due to rippling was judged across all six lesions. First, at an angle of 0° (where effective section thickness would have the greatest influence, and rippling artifact would have the least) and at an intermediate pitch (1.60 and 1.67), the smallest polyp, polyp 6 (3 ⫻ 1 mm), was not seen (grade 0), with mild artifact present (grade 1). The other five polyps, at an angle of 0°, had excellent depiction (grade 3), with no rippling to mild rippling degradation (grades 0 and 1). Across the other protocols, as pitch and angle increased, the 13- and 6-mm pedunculated polyps (polyps 1 and 2)
and sessile polyp 4 (11 ⫻ 3 mm) demonstrated excellent morphology, with mild degradation from the rippling artifact across all acquisition protocols. Differences were seen in remaining sessile polyps 3 (11 ⫻ 1 mm) and 5 (6 ⫻ 2 mm). As pitch increased from one to two, at a constant angle of 45° and with 5-mm collimation, the depiction of polyp 3 decreased from good to poor, with an increase in rippling degradation from mild to moderate (Fig 9); these trends were seen best for the 5-mm acquisitions compared with the 3-mm acquisitions; this likely was due to the greater table incre-
168
䡠
Radiology
䡠
October 2000
Figure 6. Graph shows the magnitude of the rippling artifact, as measured by edge width variation, which is plotted as a function of displacement (product of table increment and tangent of inclination angle) (slope ⫽ 0.176, R ⫽ 0.988). The simple model in the text can be used to correctly predict the magnitude of the rippling artifact for all scanning protocols.
ment of 10 mm at 5-mm collimation. In polyp 5, the change in pitch did not influence depiction; thus, the effective section thickness appeared to be more influential, with good depiction at 5-mm collimation and with excellent depiction at 3-mm collimation. As the angle of inclination increased to 60°, there was good (5-mm collimation) to excellent (3-mm collimation) depiction of polyps 3 and 5, respectively, with mild rippling degradation. Of note, the 60° protocol had an intermediate pitch of 1.60 –1.67; Whiting et al
Figure 7. Spectral plots of edge width variation at specific angles of inclination relative to the z axis at constant collimation (3 mm) and table increment T (5 mm). The position of the peaks is constant (harmonics of T/2), while magnitude increases with angle: (a) 0°, (b) 23°, and (c) 68° (corresponding 45° spectrum is seen in Fig 8b).
Figure 8. Spectral plots of edge width variation at various table increments (T) at constant collimation (3 mm) and approximate angle of inclination (45°). Note that peak amplitude increases with T, and that the position of the fundamental and first harmonics varies with T. T values are: (a) 3 mm, (b) 5 mm, and (c) 6 mm.
thus, the counteracting influences of higher angle and lower pitch may have influenced the improved depiction compared with the pitch of two results.
DISCUSSION Spiral CT colonography had promising results in colorectal polyp detection in the early prospective clinical series that had been performed up to the time this article was written (1,2,4,6,8). Investigators in these studies used single– detector row CT, with protocols ranging in collimation from 3–5 mm and ranging in pitch from 1.2–2.0, as in this experiment, in which a phantom was used. The sensitivities for polyp detection in these prospective series, in which CT was compared with colonoscopy, were 50%–91% for polyps of 10 mm or greater and 33%– 82% for polyps of 5–9 mm (1,2,4,6,8). Of interest, Rex and colleagues (6) performed a study with 46 patients and reVolume 217
䡠
Number 1
ported a sensitivity of approximately 25% (one of four polyps detected in 11 patients) for polyps of 2 cm and greater and 60% (six of 10 polyps in 27 patients) for polyps of 1–2 cm. In their series, three of the four polyps missed in the 2-cm category were flat adenomas in the right side of the colon. Thus, the results of CT colonography for the detection of colorectal polyps have varied, which may in part reflect differences in the depiction of various polyp morphologies and sizes. Our purpose was to characterize and quantify the interpolation artifact and the resulting degradation of polyp depiction by using in vitro phantoms of varying sizes and morphologies. The fidelity with which polyp morphology is depicted is a function of both scanner resolution and image artifacts, such as the rippling artifact measured in this study. The occurrence of any of these phenomena is strongly dependent on the position and orientation of a structure of
interest in the image reconstruction process, which is unpredictable in clinical data acquisition. However, simple models can be used to understand the potential effects of CT acquisition parameters and the relative effects of artifacts compared with partial volume effects. The degree to which partial volume effects distort polyp morphology is determined by the polyp size relative to the effective section thickness and section sensitivity profile, which primarily are a function of the collimation, pitch, and interpolation algorithm (12,13). Estimates of the effective section thicknesses for the protocols used are listed in the Table. Edges will be blurred on a scale comparable to the effective section thickness; for standard abdominal protocols, this size typically is 5–10 mm, with tradeoffs made in such parameters as scanning time and patient dose. In polyps larger than the effective section thickness, morphology is reproduced
CT Artifacts and Polyp Depiction in Spiral CT Colonography
䡠
169
well. In polyps approximately equal to or smaller than the effective section thickness, morphology may be distorted or obliterated by partial volume averaging. The stair-step artifact has been observed in 2D reformations as regular discontinuities within high-contrast interfaces oblique to the direction of table travel (10,11). Although it resembles the aliasing artifact due to undersampling, Wang and Vannier (10) have shown that it is independent of the reconstruction interval and results from the linear interpolation used to convert spiral CT projection data into planar projection data sets for reconstruction by using filtered back projection. As the gantry rotates and the table translates simultaneously, data are gathered from different longitudinal positions, and interpolation is used to estimate data for a particular reconstruction plane (10 –12). Commonly, 180° linear interpolation is used with samples separated by approximately one-half gantry rotation. If the object cross section is changing with longitudinal position (eg, our cylinder is oblique with respect to the longitudinal axis), inconsistent data will be interpolated. Specifically, high-contrast interfaces at varying in-plane positions will be superimposed or summed. This is the situation encountered by the colon lumen-wall interface in an obliquely oriented colonic segment; it explains the periodic broadening of the colonic surface that results from this process. The rippling artifact that results from the interpolation of spiral CT projection data may degrade the conspicuity of sessile polyps when the magnitude of the artifact approaches the size of the polyp (10 –12). In general, this is a complicated process to model but is tractable for the geometry of a cylinder (9). For instance, if a cylinder is centered on the scanner isocenter with its axis inclined at an angle ⌰ with respect to the longitudinal axis of the gantry, projection data samples separated by one-half gantry rotation (180°) will be displaced by the equivalent of (T/ 2) 䡠 tan(⌰) (Fig 3). For the interpolation of spiral CT projection data in a particular longitudinal position, parts of the cylinder edge that are tangential to x rays at that longitudinal position will have minimal interpolation and maximal contrast and will appear sharp. At the other extreme, parts of the cylinder edge that are normal to x rays at the same longitudinal position will have contributions from rays at points 180° away from the plane that are parallel to the edge and will be highly interpolated. If there is in-plane 170
䡠
Radiology
䡠
October 2000
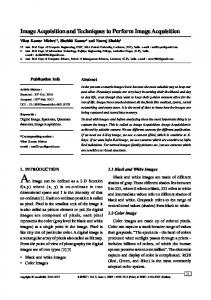
Figure 9. Perspective 3D volume-rendered CT colonographic views of the first five polyps (two pedunculated and three sessile), compared between (a) 5-mm collimation, 5-mm table increment (pitch, one), and a 45° angle of orientation and (b) 5-mm collimation, 10-mm table increment (pitch, two), and a 45° angle of inclination. Pedunculated polyps 1 and 2 (13 mm and 6 mm, respectively) and sessile polyps 4 (11 ⫻ 3 mm) and 5 (6 ⫻ 2 mm) are well depicted. In contrast, sessile polyp 3 (11 ⫻ 1 mm [arrow]) demonstrates degradation due to the artifact in b as the pitch increases to two.
displacement of the edges with longitudinal translation, the sums contributing to these edges will make them appear blurred. As a result, edge sharpness varies around the perimeter of a particular section. This blurring will appear at different angular positions in each section, depending on the relative angular orientations of the gantry that are used to form the section. Therefore, the degree of inplane blurring will vary periodically with longitudinal position. Thus, image quality is determined by a combination of collimator blurring and artifacts that are created by spiral interpolation. The underlying edge resolution of the scanner is determined by the collimator width, which, when sampling an edge, spreads the transition over a distance C in the longitudinal direction (effective section thickness) and over a distance C 䡠 tan(⌰) in the in-plane direction. However, this longitudinal collimator blurring is relatively constant for every section (10), while the blurring due to spiral interpolation varies for every section, with a maximum of T/2 䡠 tan(⌰). The rippling variation with longitudinal position roughly is sinusoidal, with an amplitude about its mean of one-half its maximum. Because the SD of a sinusoidal function is equal to 1/公2, the magnitude of the rippling artifact is predicted to be (T/2 䡠 tan(⌰) 䡠 (1/2) 䡠 (1/公2) ⫽ 0.177 䡠 T 䡠 tan(⌰). The regression analysis of our data in Figure 7 reveals a slope of 0.176, which is in excellent agreement. Thus, the magnitude of the rippling artifact rel-
ative to the effective section thickness blurring should have a general ratio of (approximately T 䡠 tan(⌰)/C ⫽ p 䡠 tan(⌰), where p is pitch (table increment divided by collimator width). In this study, the morphologies of the pedunculated (polyps 1 and 2) and larger sessile lesions (polyp 4) were well depicted, with only mild degradation by artifact, because the artifact magnitude and partial volume blur were small compared with the polyp size. The smallest 3 ⫻ 1-mm sessile polyp (polyp 6) was not depicted well with any tested protocols, as expected because of the small size of the polyp relative to the effective section thickness of our tested protocols. Visualization of the intermediate-sized polyps (11 ⫻ 1 mm, 6 ⫻ 2 mm) was degraded when the magnitude of the rippling artifact became comparable with the polyp size. However, when no rippling was present (angle, 0°), these polyps were well depicted. Previous investigators (14,15) have experimented with phantoms to determine differences in polyp depiction at spiral CT colonography with the variation of image acquisition protocols. Dachman et al (14) simulated colonic polyps by suturing the colonic lining of in vitro pig specimens to create sessile polyps of 3–10 mm. In their study, spiral CT data were acquired at collimations of 5 and 7 mm, with pitches of one to two, and at specific angles of inclination relative to the z axis (0°, 45°, and 90°). By using subjective grading scales of lesion conspicuity in 2D Whiting et al
source images and in 3D surface-based renderings, results with the different protocols showed that there was consistent depiction of the 10-mm polyps, variable depiction of the 7-mm polyps in 3D images, and poor depiction of the 3-mm polyps. Beaulieu et al (15) simulated polyps, with plastic beads embedded in waterimmersed tubing to simulate pedunculated polyps of 2.5–10.0 mm. Spiral CT data were acquired with a collimation of 3 and 5 mm, pitches of one and two, two angles of orientation relative to the z axis (0° and 90°), and reconstruction of sections from 0.5 to 4.0 mm. Qualitative scoring of lesion detection was applied to the transverse 2D source images and to the orthogonal 2D reformations. In their investigation, the detection of polyps of 4 mm and greater was maintained across all protocols, with variability in the detection of 2.5-mm polyps. In neither of these investigations were the quantitative relationships between CT acquisition parameters and lesion conspicuity or image artifacts evaluated. Several factors may have influenced our observations. Although our phantom was composed of in vitro synthetic polyps with homogenous densities and smooth boundaries that simulated in vivo ranges of polypoid morphologies, the geometric simplicity of phantom composition (which allows precise quantitation) cannot be extrapolated fully to replace the more diverse range of polypoid densities and morphologies in vivo. The synthetic phantom measurements also held constant the influential factor of degree of distention, which is difficult to control in vivo. Also, in 3D endoscopic visualization with spiral CT colonography, rendering parameters have a large influence on image quality. Field of view becomes a powerful but limitless parameter that has a great effect on visualization and must be controlled in making comparative observations. We report results with a constant field of view that was optimized to visualize the polyps, similar to that with endoscopy, but other fields of view could lead to individual variation of polyp depiction (note the variation in conspicuity between the two rows of polyps in Fig 9). Another rendering parameter such as the opacity function, which assigns a percent opacity to each value of the attenuation histogram, can have a powerful influence on image content (3,16). The shape of this function across the important boundary voxels of the air–soft-tissue interface can potentially smooth an image, without a significant loss of edge definition. In this investigation, we held conVolume 217
䡠
Number 1
stant the opacity assignment, which we had previously evaluated and optimized (3). In addition to the CT acquisition parameters we investigated, two other parameters could potentially influence polyp depiction. The reconstruction interval for all data sets in this investigation was held constant at 1 mm to best make quantitative comparisons; this resulted in all images being reconstructed with at least 60% overlap. While all images had sufficient percent overlap on the basis of the findings of prior investigations, further research may be warranted to better discriminate this influence with 3D visualization, in particular with multiple– detector row CT (17). The depiction of polyps in positions away from the gantry isocenter also may require further investigation (18). Our phantom was designed to allow the evaluation of different lumen diameters, but the object distance from the isocenter was kept short (the maximum as a percentage of the source to the isocenter distance was 14% [82 of 570 mm]) to minimize radial effects. In summary, in this investigation, the influence of specific CT acquisition parameters (collimation, pitch, and angle of inclination) on the 3D rippling artifact and on polyp depiction for in vitro spiral CT colonography was reported. A quantitative model was presented that clarified the effect of system interactions to predict the effect of the 3D rippling artifact. Specifically, the table increment determines the longitudinal periodicity, and the angle of inclination strongly influences the in-plane magnitude of the artifact. Qualitative evaluations to confirm these trends demonstrated that small pedunculated polyps were well depicted, with degradation by rippling seen among more sessile lesions. Thus, while image processing and rendering techniques can have a significant influence on the visibility of the colonic wall and associated polyps, the CT acquisition process sets fundamental limitations on the spatial detail present on the 2D or 3D images. The introduction of multiple– detector row CT could fundamentally advance CT colonography beyond the current limitations of single— detector row CT, with improved depiction of smaller or sessile lesions (19). Further investigation will be required to optimize the interaction of the new parameters introduced with multiple– detector row CT, such as the selective combination of multiple detector rows to allow potential improvements in effective section thick-
ness, acquisition time, and patient radiation dose. Practical application: For single– detector row spiral CT protocols with 3- and 5-mm collimations and with a pitch of one to two, there is excellent depiction of 6- and 13-mm pedunculated polyps and 10 ⫻ 3-mm sessile polyps. However, for the 5-mm collimation, pitch of two protocol, flatter sessile lesions of 11 ⫻ 1 mm and 6 ⫻ 2 mm can be degraded by rippling artifact. The clinical importance of these trends may relate to the poor sensitivity reported recently for the detection of flat adenomas with spiral CT colonography (6). Acknowledgments: We acknowledge the contributions of Barry Brunsden, BS, for early phantom design and image analysis, and Joel S. Parker, BS, for quantitative and qualitative image analyses.
References 1. Hara AK, Johnson CD, Reed JE, et al. Detection of colorectal polyps with CT colography: initial assessment of sensitivity and specificity. Radiology 1997; 205: 59 – 65. 2. Royster AP, Fenlon HM, Clarke PD, Nunes DP, Ferrucci JT. CT colonoscopy of colorectal neoplasms: two-dimensional and three-dimensional virtual-reality techniques with colonoscopic correlation. AJR Am J Roentgenol 1997; 169:1237–1242. 3. McFarland EG, Brink JA, Loh J, et al. Visualization of colorectal polyps with spiral CT colography: evaluation of processing parameters with perspective volume rendering. Radiology 1997; 205: 701–707. 4. Dachman AH, Kuniyoshi JK, Boyle CM, et al. CT colonography with three-dimensional problem solving for detection of colon polyps. AJR Am J Roentgenol 1998; 171:989 –995. 5. Fenlon HM, McAneny DB, Nunes DP, Clarke PD, Ferrucci JT. Occlusive colon carcinoma: virtual colonoscopy in the preoperative evaluation of the proximal colon. Radiology 1999; 210:423– 428. 6. Rex DK, Vining D, Kopecky KK. An initial experience with screening for colon polyps using spiral CT with and without CT colonography (virtual colonoscopy). Gastrointest Endosc 1999; 50:309 –313. 7. Beaulieu CF, Jeffrey Jr RB, Karadi C, Paik DS, Napel S. Visualization modes for CT colonography. II. Blinded comparison of axial CT, virtual endoscopy, and panoramic-view volume rendering. Radiology 1999; 212:203–212. 8. Fenlon HM, Nunes DP, Schroy III PC, et al. A comparison of virtual and conventional colonoscopy for the detection of colorectal polyps. N Engl J Med 1999; 341:1496 –1503. 9. Whiting B, McFarland EG, Dellabarca C, Brunsden BS. Study of CT artifacts in virtual colonoscopy. Proc SPIE 1999; 3660: 110 –116. 10. Wang G, Vannier MW. Stair-step artifacts in three-dimensional helical CT: an ex-
CT Artifacts and Polyp Depiction in Spiral CT Colonography
䡠
171
perimental study. Radiology 1994; 191: 79 – 83. 11. Polacin A, Kalender WA, Brink J, Vannier MA. Measurement of slice sensitivity profiles in spiral CT. Med Phys 1994; 21:133– 140. 12. Polacin A, Kalender WA, Marchal G. Evaluation of section sensitivity profiles and image noise in spiral CT. Radiology 1992; 185:29 –35. 13. Schlueter FJ, Wang G, Hsieh PS, Brink JA, Balfe DM, Vannier MW. Longitudinal image deblurring in spiral CT. Radiology 1994; 193:413– 418.
172
䡠
Radiology
䡠
October 2000
14.
Dachman AH, Lieberman J, Osnis RB, et al. Small simulated polyps in pig colon: sensitivity of CT virtual colography. Radiology 1997; 203:427– 430. 15. Beaulieu CF, Napel S, Daniel NL, et al. Detection of colonic polyps in a phantom model: implications for virtual colonoscopy data acquisition. J Comput Assist Tomogr 1998; 22:656 – 663. 16. Rubin GD, Beaulieu CF, Argiro V, et al. Perspective volume rendering of CT and MR images: applications for endoscopic imaging. Radiology 1996; 199:321–330. 17. Kopka L, He HD, Foley WD, Hu H, Jacob-
son DR, Grabbe EH. Low-contrast detectability of a new multislice versus a monoslice helical CT in a liver phantom (abstr). Radiology 1998; 209(P):284. 18. Rubin GD, Fleischmann D, He HD, Paik DS, Fox SH, Napel S. Comparison of 4 detector row and standard 1 detector row helical CT scanners: helical artifact and 3-D image quality (abstr). Radiology 1998; 209(P):285. 19. Berland LL, Smith JK. Multidetector-array CT: once again, technology creates new opportunities. Radiology 1998; 209:327– 329.
Whiting et al