GEOPHYSICAL RESEARCH LETTERS, VOL. ???, XXXX, DOI:10.1029/,
1
2
Influence of Initial Conditions and Climate Forcing on Predicting Arctic Sea Ice 1
1
2
E. Blanchard-Wrigglesworth, C. M. Bitz, and M. M. Holland,
E. Blanchard-Wrigglesworth, Department of Atmospheric Sciences, University of Washington, Seattle, WA 98195-1640, USA. (
[email protected]) C. M. Bitz, Department of Atmospheric Sciences, University of Washington, Seattle, WA 98195-1640, USA M. M. Holland, National Center for Atmospheric Research, Boulder, CO, 80307-3000, USA. 1
Department of Atmospheric Sciences,
University of Washington, Seattle, Washington, USA. 2
National Center for Atmospheric
Research, Boulder, Colorado, USA.
D R A F T
August 16, 2011, 4:24pm
D R A F T
X-2 3
BLANCHARD-WRIGGLESWORTH ET AL.: ARCTIC SEA ICE PREDICTABILITY
The recent sharp decline in Arctic sea ice has triggered an increase in the
4
interest of Arctic sea ice predictability, not least driven by the potential of
5
significant human industrial activity in the region. In this study we quan-
6
tify how long Arctic sea ice predictability is dominated by dependence on
7
its initial conditions versus dependence on its secular decline in a state-of-
8
the-art global circulation model (GCM) under a ‘perfect model’ assumption.
9
We demonstrate initial-value predictability of pan-Arctic sea ice area is con-
10
tinuous for 1-2 years, after which predictability is intermittent in the 2-4 year
11
range. Predictability of area at these longer lead times is associated with strong
12
area-thickness coupling in the summer season. Initial-value predictability of
13
pan-Arctic sea ice volume is significant continuously for 3-4 years, after which
14
time predictability from secular trends dominates. Thus we conclude predictabil-
15
ity of Arctic sea ice beyond 3 years is dominated by climate forcing rather
16
than initial conditions. Additionally, we find that forecast of summer con-
17
ditions are equally good from the previous September or January initial con-
18
ditions.
D R A F T
August 16, 2011, 4:24pm
D R A F T
BLANCHARD-WRIGGLESWORTH ET AL.: ARCTIC SEA ICE PREDICTABILITY
X-3
1. Introduction 19
Predicting Arctic sea ice has long been practiced by elders of Inuit communities in the
20
Arctic, whose livelihoods depend on sea ice for travel and hunting [Fox , 2003]. There is
21
increasing interest in predicting Arctic sea ice among shipping and resource extraction
22
industries, spurred in part by the recent sharp decline of Arctic sea ice area, particularly
23
in summer [Serreze et al., 2007]. For example, advanced knowledge of the opening of
24
the northwest and northeast passages could offer faster and cheaper travel between the
25
Atlantic and Pacific oceans [ACIA, 2004].
26
The persistence of anomalies in Arctic sea ice area has multiple important timescales
27
[Blanchard-Wrigglesworth et al., 2011]. There is an initial exponential decay of the lagged
28
correlation from a given month that results in a negligible correlation after 2-4 months.
29
For example, correlation of Arctic sea ice area anomalies in May with successive months
30
is essentially zero by September. Beyond this initial loss of persistence, there is a reemer-
31
gence that occurs in some seasons owing to coupled interactions between sea ice area
32
anomalies, thickness anomalies (which tend to persist much longer than area anomalies),
33
and sea surface temperature (SST) anomalies. The reemergence is observed in nature,
34
but it is more pronounced in a GCM analyzed in the study.
35
Global Climate Models (GCMs) have been employed to assess the prognostic pre-
36
dictability of Arctic sea ice in a few studies by using ‘perfect model’ approach in which
37
ensemble integrations are initialized from a reference model integration. Such studies ne-
38
glect errors from imperfect knowledge of the initial state and therefore give the upper limit
39
of predictability for the model. One study found central Arctic thickness predictability
D R A F T
August 16, 2011, 4:24pm
D R A F T
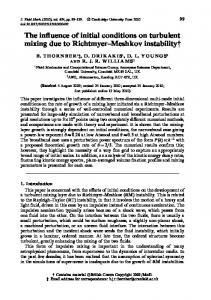
X-4
BLANCHARD-WRIGGLESWORTH ET AL.: ARCTIC SEA ICE PREDICTABILITY
40
for 2 years, while Arctic sea ice area predictability was only better than expected from
41
damped persistence for a few months near the ice edge [Koenigk and Mikolajewicz , 2009].
42
Another found sea ice area in a year with above average thickness generally exhibits
43
longer predictability than in a year with below average thickness [Holland et al., 2010].
44
These studies are valuable precursors to practical GCM predictions but they have only
45
evaluated predictability from initial conditions (‘predictability of the first kind’- Lorenz
46
[1975]). This ‘initial-value’ predictability is measured by comparing the time evolution of
47
the spread of an ensemble forecast distribution to its asymptotic limit.
48
Predictability from changing boundary conditions (‘predictability of the second kind’-
49
Lorenz [1975]), such as results from anthropogenic climate forcing, could be very impor-
50
tant for a system whose mean state is rapidly changing, as is the case for Arctic sea ice.
51
This ‘forced’ predictability results in a transient in the ensemble mean of an ensemble fore-
52
cast distribution. A question of interest is how long initial-value predictability dominates
53
over forced predictability in sea ice, or is there a gap when there is no predictability. A sim-
54
ilar question has been explored for Pacific upper ocean temperatures, which showed within
55
5-8 years predictability from climate forcings exceeds that from initial values [Branstator
56
and Teng, 2010]. We assess the ‘forced’ predictability in sea ice through the use of relative
57
entropy [Kleeman, 2002] from information theory, which has recently been applied in the
58
context of oceanic temperature predictability [Teng and Branstator , 2010].
2. Methods 59
We investigate predictability of pan-Arctic sea ice area and volume in perfect model
60
studies with the Community Climate System Model version 4 (CCSM4) [Gent et al.,
D R A F T
August 16, 2011, 4:24pm
D R A F T
BLANCHARD-WRIGGLESWORTH ET AL.: ARCTIC SEA ICE PREDICTABILITY
X-5
61
2011] at 1◦ resolution in all components. Because persistence of Arctic sea ice area varies
62
seasonally [Blanchard-Wrigglesworth et al., 2011], we designed our experiments to assess
63
initializations from two different times of the year as noted in table 1. The start times were
64
chosen to capture times near the maximum and minimum of sea ice area persistence. We
65
conduct an ensemble of prediction experiments (EPEs) for each start time composed of 60
66
runs with initial conditions drawn from six different 20th Century integrations (see Meehl
67
et al. Submitted, and table 1). We refer to runs with initial conditions from the same
68
start time and 20th century integration as a set. Each set has either 8 or 20 members of 2
69
or 5 years in length (as noted in table 1), and all members of the set have the same sea ice,
70
land, and ocean initial conditions. The set members are unique in their atmospheric initial
71
conditions, which are drawn from consecutive days centered on 1 January or September.
72
Given the rapid adjustment time scales of the atmosphere, each member of a set can be
73
considered independent. All integrations have time-varying, radiative forcing [Gent et al.,
74
2011]. We find that the varying number of members in the sets in the first two years does
75
not distort our results (see auxiliary materials).
76
We use monthly model output for all our computations. Anomalies are calculated as the
77
departure from the mean of each set. A time-evolving standard deviation (σ) is computed
78
from the anomalies across each January and September EPE. We use years 1996–2005 of
79
the six 20th century integrations to construct statistics of a ‘reference’ distribution, which
80
we assume has no memory of its initial conditions in 1850. The time-evolving mean (or
81
trend) of the reference distribution is estimated from a linear fit to the ensemble mean
82
of the six runs. The reference σ is estimated from anomalies of this time-evolving mean.
D R A F T
August 16, 2011, 4:24pm
D R A F T
X-6
BLANCHARD-WRIGGLESWORTH ET AL.: ARCTIC SEA ICE PREDICTABILITY
83
In the reference, σ is assumed to be monthly varying but annually periodic, a reasonable
84
assumption for the shortness of the period considered. All significance values are stated
85
at the 95% confidence interval.
86
87
Satellite observations of sea ice area [Fetterer et al., 2002, updated 2010] from 1979-2010 are used to compute the trends and standard deviation of observed sea ice area.
3. Results 88
Forecast accuracy is a user defined concept with no universally defined skill standard
89
[Collins, 2002], so we consider several measures. We begin by evaluating the growth of
90
the cross-ensemble standard deviation (or ensemble spread) of each EPE, which addresses
91
initial-value predictability only, using the Root Mean Square Deviation (RMSD, also
92
known as Root Mean Square Error). The RMSD is defined as v u 6 8,20 u1 ∑ ∑∑ u RM SD = t (xkj − xij )2 ,
N
(1)
j=1 i=1 k6=i
93
where xij is either pan-Arctic sea ice area or volume (henceforth refered to as just area
94
or volume) and the indexes j indicates the set, i indicates ensemble member, and N the
95
total number of variables in the summation minus 1 [see Collins 2002]. We note that our
96
interpretation of the RMSD is in close agreement with those from the Prognostic Potential
97
Predictability (PPP) [Pohlmann et al., 2004] and growth of the standard deviation of the
98
EPE (see auxiliary materials).
99
Figure 1 shows the RMSD for area and volume for January and September EPEs. An
100
RMSD of zero indicates perfect predictability, and the reference RMSD is the limit above
101
which there is no predictability. Predictability is considered significant when the RMSD
102
of the EPE is less than that of the reference judged using an F-test. As expected from
D R A F T
August 16, 2011, 4:24pm
D R A F T
BLANCHARD-WRIGGLESWORTH ET AL.: ARCTIC SEA ICE PREDICTABILITY
X-7
103
its shorter persistence timescale, the initial-value predictability is lower for area than for
104
volume. The time it takes for the RMSD for area to first lose significance is about 1.5–2
105
years (Fig. 1a,c). Beyond 2 years the RMSD for area is significant only intermittently, with
106
a tendency for significance to recur in some months, notably May–July and September–
107
October of years 3 and 4. After 4 years all initial-value predictability of area is lost. For
108
sea ice volume, the initial-value predictability of each EPE is significant continuously for
109
3–4 years (Fig. 1b,d).
110
We compare the RMSD for each EPE to an estimate from an autoregressive process
111
of order 1 (AR1 model, see, e.g., vonStorch and Zwiers [1999]) — an estimate of the
112
predictability from damped persistance alone. The AR1 model is based on the one-lag
113
correlation (a) and variance (σ 2 ) of the control for the month following the start time (e.g.,
114
for the January start, a is for January correlated with February and σ is for only the month
115
of January). Hence, the asymptotic limit of the AR1 model RMSD approaches that of the
116
reference for the start month. The parameters a and σ for area vary strongly with season
117
[Blanchard-Wrigglesworth et al., 2011], so the AR1 model RMSD for area should only
118
be considered relevant for the first few months. The initial rapid rise of the AR1 model
119
RMSD for area for the September EPE is due to both a low a and high σ. In other words,
120
damped persistence alone from September conditions offers poor predictability — much
121
worse than from January. However, the EPE predictability is just as good for September
122
as January start times (based on comparing the RMSD of EPEs and reference at similar
123
lead times), which offers hope that prognostic predictions of area can beat simple damped
124
persistence at least for a few months of lead time.
D R A F T
August 16, 2011, 4:24pm
D R A F T
X-8
BLANCHARD-WRIGGLESWORTH ET AL.: ARCTIC SEA ICE PREDICTABILITY
125
Initial value predictability for January and September EPEs is generally indistinguish-
126
able in spring of the first year for both area and volume, as evident by the similar mag-
127
nitude of RMSD in Fig. 1e and f. This season leads to a period of enhanced growth
128
in the RMSD of the area and volume distributions that recurs in June–July each year.
129
It is perhaps not a coincidence that initial-value predictability should decline at a time
130
of high solar insolation, when snow cover disappears, surface albedo drops sharply, and
131
atmospheric perturbations have been shown to produce the greatest variation in sea ice
132
volume [Bitz et al., 1996]. We emphasize that the decline does not result in complete loss
133
of predictability, at least not until several years have passed.
134
Our previous work showed that sea ice area anomalies could disappear and reemerge
135
by association with long-lived thickness anomalies during the summer season [Blanchard-
136
Wrigglesworth et al., 2011]. Such phenomena are possible if thickness and area anomalies
137
are only strongly correlated in summer and the area anomaly decays in fall while the
138
thickness anomaly in the central Arctic persists all year. Volume is the hemispheric
139
integral of local thickness weighted by the local fractional sea ice cover. Thus volume is
140
strongly related to central Arctic thickness. Figure 2 shows that sea ice area and volume
141
are indeed strongly correlated only in summer in both EPE and control. We thus expect
142
that negligible area predictability in spring followed by reemergence of area predictability
143
in summer-fall (e.g., see fig. 1a and c in 2002 and 2003) is a result of coupling between
144
the slowly-varying volume and the generally faster-varying area. While we do see winter
145
area predictability lasts up to 3 years, this is not imparted by volume anomalies, but
146
presumably originates from persistence in the ocean model component. Further evidence
D R A F T
August 16, 2011, 4:24pm
D R A F T
BLANCHARD-WRIGGLESWORTH ET AL.: ARCTIC SEA ICE PREDICTABILITY
X-9
147
of the controlling influence of volume on area is that once the EPE RMSD becomes
148
undistinguishable from the reference RMSD in the 5th year (see fig. 1 b and d), area loses
149
all initial-value predictability (see fig. 1 a and c).
150
Next we consider how the rapid decline in area and volume affect predictability through
151
analysis of relative entropy, which measures the information (in bits) provided by a pre-
152
diction over the climatology [Kleeman, 2002]. The univariate form of relative entropy is
153
defined as 1 σ2 σ 2 (µe − µc )2 RE = [ln( c2 ) + e2 + − 1], 2 σe σc σc2
(2)
154
where σc and σe are standard deviations of the control and experiment respectively, and
155
µc and µe is the mean of the control and experiment respectively. We refer to the first
156
two and fourth terms in equation 2 as the dispersion component and the third term
157
as the signal component of the relative entropy. Relative entropy evaluates both the
158
predictability of the spread (dispersion) and the evolution of the mean (signal) of the EPE
159
distribution. The initial-value predictability has both dispersion and signal components,
160
while the forced predictability affects only the signal component in the timeframe of
161
our experiments. We estimate a null hypothesis lower (rejection) level by calculating
162
the relative entropy with respect to the control of a synthetic data set whose mean and
163
standard deviation are constructed to be minimally significantly different from the control
164
at exactly the 95% level (see auxiliary materials).
165
From the relative entropy of the EPEs (see Figure 3), we see that most of the initial-
166
value predictive information in volume is a result of the dispersion component of the
167
ensemble, which provides predictability for about 3-4 years (in agreement with Fig. 1).
D R A F T
August 16, 2011, 4:24pm
D R A F T
X - 10
BLANCHARD-WRIGGLESWORTH ET AL.: ARCTIC SEA ICE PREDICTABILITY
168
The signal component also yields initial-value predictability in volume, which is much
169
smaller than the dispersion component during the first year, but comparable in years 2-3,
170
particularly in the September EPE. All initial-value predictability for volume disappears
171
by year 5. The forced predictability of volume becomes comparable with initial-value
172
predictability in year 3, and forced predictability exceeds initial-value predictability in
173
year 4. For volume, the sum of initial-value and forced predictability is significant all 5
174
years, except for a brief period in the January EPE at the end of year 3.
175
For area, dispersion provides continuous initial-value predictability for 2 years, and then
176
it is intermittently significant in years 3 and 4. Unlike volume, the greater contributor
177
to initial-value predictability of area is from the signal component in the first 6 months
178
and in the 2nd winter following the forecast start date. Given the more rapidly-varying,
179
noisier nature of area compared to volume, it is harder to define a precise time at which
180
all area initial-value predictability saturates (to use a term from Branstator and Teng
181
[2010]), but saturation is beyond 2 years for the signal component and 4 years for the
182
dispersion component. The first evidence of forced predictability in area does not appear
183
until year 5, which is much later than for volume. Thus, there are extensive periods in
184
the 2-5 year range where no significant total predictability is present.
4. Discussion and Conclusions 185
The evolution of volume and area in the 20th Century runs for 2000-2005 (see table1) can
186
be used as a window to the timescale for when forced predictability becomes significant. It
187
takes only about 4 years for the volume to reach a new mean state (when the secular change
188
exceeds -1 standard deviation), whereas for area it takes about 6 years. Unfortunately,
D R A F T
August 16, 2011, 4:24pm
D R A F T
BLANCHARD-WRIGGLESWORTH ET AL.: ARCTIC SEA ICE PREDICTABILITY
X - 11
189
the observational record of sea ice thickness is too incomplete to calculate this metric for
190
observed sea ice volume, yet we note that recent trends [Kwok and Rothrock , 2009] are
191
comparable to those in the model. Observed sea ice area retreat indicates it currently
192
takes about about 5 years to reach a new mean state. The near agreement between the
193
model and observations (where possible) supports the finding from our model results that
194
at present predictability of the Arctic sea ice system beyond about 3-5 years is principally
195
a boundary-forcing problem. In contrast, predictability for less than 3-5 years is an initial-
196
value problem.
197
Area predictability is considerably longer than the predictability yielded by its inherent
198
persistence timescale, in part due to the coupling of area and volume anomalies during
199
the summer season. In the model there are times when no significant area predictability
200
exists from either initial conditions or climate forcing, whereas for volume, significant
201
predictability is present almost continuously. We find that beyond the spring, model
202
predictions are equally good whether initialized in September or January, implying that
203
in practice forecasts of the summer sea ice may be made as early as the fall.
204
Acknowledgments. We thank Grant Branstator, Joe Tribbia, Andrew Madja and Ben
205
Kirtman for insightful discussions, and two anonymous reviewers for helpful comments.
206
This research was supported by NSF PP grant ARC-0909313. Computing support was
207
provided by NCAR’s Computational and Information Systems Laboratory, sponsored by
208
NSF.
D R A F T
August 16, 2011, 4:24pm
D R A F T
X - 12
BLANCHARD-WRIGGLESWORTH ET AL.: ARCTIC SEA ICE PREDICTABILITY
References 209
210
ACIA (2004), Atmospheric circulation and Arctic sea ice in CCSM3 at medium and high resolution, Impacts of a warming Arctic- Arctic climate impact assesment, p. 144.
211
Bitz, C. M., D. S. Battisti, R. E. Moritz, and J. A. Beesley (1996), Low-frequency vari-
212
ability in the Arctic atmosphere, sea ice and upper-ocean climate system, Journal of
213
Climate, 9.
214
Blanchard-Wrigglesworth, E., K. Armour, C. M. Bitz, and E. deWeaver (2011), Persis-
215
tence and inherent predictability of Arctic sea ice in a GCM ensemble and observations,
216
Journal of Climate, 24 (1), doi:10.1175/2010JCLI3775.1.
217
218
219
220
221
222
Branstator, G., and H. Teng (2010), Two limits of initial-value decadal predictability in a CGCM, Journal of Climate, 23, doi:10.1175/2010JCLI3678.1. Collins, M. (2002), Climate predictability on interannual to decadal time scales: the initial value problem, Climate Dynamics, 19, 671–692. Fetterer, F., K. Knowles, W. Meier, and M. Savoie (2002, updated 2010), Sea ice index, http://nsidc.org/data/go2135.html, accessed in April 2011.
223
Fox, S. (2003), When the weather is uggianaqtuq: Inuit observations of environmental
224
change, CD-ROM, Boulder, CO: University of Colorado Geography Department Car-
225
tography Lab. Distributed by National Snow and Ice Data Center.
226
Gent, P. R., G. Danabasoglu, L. Donner, M. Holland, E. Hunke, S. Jayne, D. Lawrence,
227
R. Neale, P. Rasch, M. Vertenstein, P. Worley, Z.-L. Yang, and M. Zhang (2011), The
228
Community Climate System Model version 4, Journal of Climate, N/A.
D R A F T
August 16, 2011, 4:24pm
D R A F T
BLANCHARD-WRIGGLESWORTH ET AL.: ARCTIC SEA ICE PREDICTABILITY
X - 13
229
Holland, M. M., D. A. Bailey, and S. Vavrus (2010), Inherent sea ice predictability in the
230
rapidly changing arctic environment of the Community Climate System Model, version
231
3, Climate Dynamics, doi:10.1007/s00382-010-0792-4.
232
233
Kleeman, R. (2002), Measuring dynamical prediction utility using relative entropy, Journal of Atmospheric Sciences, 59, 2057–2072.
234
Koenigk, T., and U. Mikolajewicz (2009), Seasonal to interannual climate predictability
235
in mid and high northern latitudes in a global coupled model, Climate Dynamics, 32,
236
doi:10.1007/s00382-008-0419-1.
237
Kwok, R., and D. A. Rothrock (2009), Decline in arctic sea ice thickness from
238
submarine and Icesat records: 1958-2008, Geophysical Research Letters, 36, doi:
239
10.1029/2009GL039035.
240
241
Lorenz, E. N. (1975), The physical bases of climate and climate modelling., in Climate Predictability, no. 16 in GARP, WMO.
242
Meehl, G. A., W. M. Washington, J. M. Arblaster, H. T. A. Hu, C. Tebaldi, W. G.
243
Strand, and J. B. White III (Submitted), Climate system response to external forcings
244
and climate change projections in CCSM4, Journal of Climate, N/A.
245
246
247
248
Pohlmann, H., M. Botzet, M. Latif, A. Roesch, M. Wild, and P. Tschuck (2004), Estimating the decadal predictability of a coupled AOGCM, Journal of Climate, 17. Serreze, M., J. Stroeve, and M. M. Holland (2007), Perspectives on the Arctic’s shrinking sea-ice cover, Science, 315 (5818), doi:10.1126/science.1139426.
249
Teng, H., and G. Branstator (2010), Initial-value predictability of prominent modes
250
of North Pacific subsurface temperature in a CGCM, Climate Dynamics, 24, doi:
D R A F T
August 16, 2011, 4:24pm
D R A F T
X - 14 251
252
253
BLANCHARD-WRIGGLESWORTH ET AL.: ARCTIC SEA ICE PREDICTABILITY
10.1007/s00382-010-0749-7. vonStorch, H., and F. W. Zwiers (1999), Statistical Analysis in Climate Research, 484 pp., Cambridge University Press.
D R A F T
August 16, 2011, 4:24pm
D R A F T
X - 15
BLANCHARD-WRIGGLESWORTH ET AL.: ARCTIC SEA ICE PREDICTABILITY
A
B
RMSD January IC Area
1
0.3
106km3
106km3
0.8 0.6 0.4
0 Jan01
Jan02
C
Jan03
Jan04
0 Jan01
Jan05
D
RMSD September IC Area
1
Jan02
Jan03
Jan04
Jan05
RMSD September IC Volume
0.4
0.8
0.3
106km3
106km3
0.2 0.1
0.2
0.6 0.4
0.2 0.1
0.2 0 Sep00 E
Sep01
Sep02
Sep03
0 Sep00
Sep04
F
RMSD January&September ICs Area
1
Sep02
Sep03
Sep04
RMSD January&September ICs Volume
106km3
0.3
0.6 0.4
0.2 0.1
0.2 0 Sep00
Sep01
0.4
0.8
106km3
RMSD January IC Volume
0.4
0 Sep00
Sep01
Sep01
Figure 1. RMSD of Arctic sea ice volume and area for the January (dark blue) and September (light blue) EPEs. Estimates of RMSD from the reference integration (black dashed) indicate the limit of no predictability. The blue lines are heavy when the RMSD of the ensemble is significantly below the control RMSD. The red lines are the RMSD of an AR1 model, which provide a measure of the RMSD expected from persistence alone. Table 1. Description 20th Century run used for initialization 1 2 3 4 5 6
D R A F T
of ensembles of prediction experiments Starting times Length of runs Number of members Sep Sep Sep Sep Sep Sep
2000, 2000, 2000, 2000, 2000, 2000,
Jan Jan Jan Jan Jan Jan
2001 2001 2001 2001 2001 2001
2 5 5 5 5 5
years years years years years years
August 16, 2011, 4:24pm
20 8 8 8 8 8
D R A F T
X - 16
BLANCHARD-WRIGGLESWORTH ET AL.: ARCTIC SEA ICE PREDICTABILITY
January IC September IC Reference 0.8
Correlation
0.6
0.4
0.2
0
−0.2
J
F
M
A
M
J
J
A
S
O
N
D
Month
Figure 2. Correlation between area and volume anomalies. Monthly r values for January and September IC EPEs and reference run.
D R A F T
August 16, 2011, 4:24pm
D R A F T
BLANCHARD-WRIGGLESWORTH ET AL.: ARCTIC SEA ICE PREDICTABILITY
January IC Area A
X - 17
January IC Volume B 4.5
3 IV dispersion IV signal BF signal Total
2.5 2
4 3.5 3 2.5
1.5 2 1
1.5 1
0.5 0.5 0 Jan01
Jan02
Jan03
Jan04
Jan05
0 Jan01
September IC Area C
Jan02
Jan03
Jan04
Jan05
September IC Volume D 4.5
3
4 2.5 3.5 2
3 2.5
1.5 2 1
1.5 1
0.5 0.5 0 Sep00
Sep01
Sep02
Sep03
Sep04
0 Sep00
Sep01
Sep02
Sep03
Sep04
Figure 3. Relative entropy (unitless) of sea ice volume and area for January and September IC EPEs. The dashed lines represent the 95% null hypothesis rejection levels for dispersion (blue), signal (green) and total (cyan).
D R A F T
August 16, 2011, 4:24pm
D R A F T