fermentation Article
Influence of Lysozyme Addition on Hydroxycinnamic Acids and Volatile Phenols during Wine Fermentation Stephan Sommer 1, * 1 2
*
ID
, Pascal Wegmann-Herr 2 , Michael Wacker 2 and Ulrich Fischer 2
Appalachian State University, Fermentation Sciences, 730 Rivers St., Boone, NC 28608, USA Institute for Viticulture and Enology (DLR—Rheinpfalz), Breitenweg 71, 67435 Neustadt, Germany;
[email protected] (P.W.-H.);
[email protected] (M.W.);
[email protected] (U.F.) Correspondence:
[email protected]; Tel.: +1-828-262-8136
Received: 10 December 2017; Accepted: 19 January 2018; Published: 21 January 2018
Abstract: Most yeast and bacteria in wine are able to metabolize hydroxycinnamic acids into volatile phenols via enzyme-mediated decarboxylation. Our trials performed in wine and model systems suggest that lysozyme addition prior to fermentation affects both bacterial activity and the release of hydroxycinnamic acids from their tartrate esters. This increases the potential for volatile phenol formation, as microorganisms can only metabolize free hydroxycinnamates. Wines with delayed malolactic fermentation due to lysozyme addition contained significantly higher concentrations of free hydroxycinnamic acids and elevated levels of volatile phenols in some cases. The reason for this is likely related to the side activity of lysozyme in combination with a detoxification mechanism that only occurs under stressful conditions for the yeast. Experiments in model systems indicate that lysozyme can affect the yeast at a pH higher than usually found in wine by attacking chitin in the bud scars of the cell walls and therefore weakening the cell structure. Free hydroxycinnamates can also affect yeast viability, making an increased release during fermentation problematic for a successful fermentation. Keywords: lysozyme; Saccharomyces; volatile phenols; hydroxycinnamic acids
1. Introduction Fresh and acid-driven white wines are commonly produced without intentional bacterial activity. Traditional ways to prevent bacterial growth are stabilization with sulfur dioxide (SO2 ), pasteurization at 60 ◦ C for two minutes [1], or lysozyme addition. Lysozyme is a 1,4-β-N-acetyl-muramidase, which cleaves the β 1,4-glycosidic bonds between N-acetyl-muramic acid and peptido-glycans in cell walls of Gram-positive bacteria [2]. Commercial lysozyme is a white slightly sweet powder that is purified from egg-white and was approved for wine treatment by the International Organisation of Vine and Wine in 2001 with a maximum legal limit of 0.5 g/L wine [3,4]. In contrast to sulfur dioxide, the efficiency of lysozyme increases with increasing pH [5], with an effective pH range from 3.5 to 12.0 [6] which makes it usable in all types and styles of wine. Malo-lactic fermentation (MLF) can be delayed by the addition of 250 mg/L and a treatment with 500 mg/L generally prevents any bacterial activity. The inhibiting effect of 500 mg/L lysozyme is comparable to the addition of 40 mg/L SO2 [5]. Saccharomyces yeast is not reported to be influenced by lysozyme under winemaking conditions. The phenolic composition of wine is complex, but the amount of hydroxycinnamic acid (HCA) usually varies between 100 and 200 mg/L, depending on the grape variety and winemaking process [7–9]. According to Suarez et al. (2007), most yeast and bacteria species in wine are able to metabolize hydroxycinnamic acids under winemaking conditions to form vinylphenols. However, further reduction of vinylphenols to ethylphenols can only be conducted by a few yeasts such as Dekkera/Brettanomyces, or Pichia. Lactic acid bacteria or Saccharomyces yeast strains form little or no ethylphenols [10].
Fermentation 2018, 4, 5; doi:10.3390/fermentation4010005
www.mdpi.com/journal/fermentation
Fermentation 2018, 4, 5
2 of 11
The predominant volatile phenols in wine are 4-vinylguaiacol, 4-vinylphenol, 4-ethylguaiacol, and 4-ethylphenol [11]. The formation during fermentation depends on the yeast strain and the concentration of phenolic inhibitors [12]. White wines are dominated by vinylphenols, while red wines mostly contain ethylphenols [13]. The corresponding enzyme for the decarboxylation of HCA is located in the yeast cell cytoplasm with a pH optimum of 6.5, which infers that this process is only active in living cells. The conversion rate is strain specific; although all strains appear to incorporate hydroxycinnamic acids, only some metabolize them into volatile phenols. A higher concentration of precursors does not necessarily correspond to increased enzyme activity, which peaks at the beginning of the stationary phase and remains at that level until cell death is induced [12]. Commercial strains might possess this decarboxylase activity but can only metabolize the free acid form and not the tartaric ester, which is the predominant form in the grape [14]. According to Grando et al. [15], vinylphenols are an indicator for yeast activity, although there is no proof that yeast is actively regulating the conversion. The objective of this study was to explain our previous observation that wines treated with lysozyme may display elevated levels of free hydroxycinnamic acids and, in some cases, volatile phenols and investigate this phenomenon using a model system. 2. Materials and Methods 2.1. Must Media Fermentations Preliminary experiments were conducted in grape must and wine under varying winemaking conditions. Trials were done in Vitis vinifera L. cv. Chardonnay and Pinot blanc in 2008 and 2009. Naturally occurring Botrytis cinerea was used to evaluate the effect of mold infections on HCA concentration. Infected grapes were treated separately and blended with healthy material where applicable. All fermentations were performed in 25 L glass carboys. Fermentation temperature was maintained at 18 ◦ C and all experiments were performed in duplicate. Where applicable, 100 mg/L lysozyme (Lallemand, Montréal, QC, Canada) or 50 mg/L sulfur dioxide were added to the juice prior to inoculation. If the experiment included a pH variation, the pH was adjusted with sodium hydroxide or phosphoric acid (both VWR, Radnor, PA, USA). Saccharomyces cerevisiae (CY 3079, Lalvin, Lallemand, Montréal, QC, Canada) was inoculated at a rate of 20 g/100 L. Malolactic fermentation (MLF) was induced with a commercial freeze-dried Oenococcus oeni culture (Enoferm® ALPHA, Lallemand; AWRI culture collection B421) where applicable. All organisms were used following the instructions of the manufacturer. MLF was either induced as mentioned above or was conducted spontaneously with native bacteria. Selected experiments were also performed with native yeast for alcoholic fermentation (AF) and native bacteria for MLF. The objective was to evaluate the effect of microbial interaction on general fermentation behavior and volatile phenol production. Grapes were crushed, pressed, and cold settled over night prior to fermentation. Initial juice analysis was performed via FT-MIR spectroscopy (FT 120 WineScan, FOSS, Hillerød, Denmark) and is shown in Table 1. Table 1. Analytical data of grape musts prior to fermentation. Cultivar
Total Sugar (g/L)
Titratable Acid (g/L)
pH
Amino-Nitrogen (NOPA) (mg/L)
Ammonium (mg/L)
2008 Chardonnay 2009 Chardonnay 2008 Pinot blanc 2009 Pinot blanc
209.1 229.1 200.2 203.4
8.3 7.2 7.0 6.5
3.5 3.5 3.4 3.6
147 168 210 227
94 38 108 62
Fermentation performance and yeast-related parameters (fermentable sugar, total acid, ethanol, and α amino acids) were monitored using FT-MIR. Samples for fermentation control were taken daily.
Fermentation 2018, 4, 5
3 of 11
The finished wines were stabilized with 100 mg/L sulfur dioxide, filtered through K100 cellulose filter pads (Seitz Pall, Port Washington, NY, USA), and bottled prior to final analysis. Table 2 summarizes the experiments that were performed with grapes. Table 2. Analytical data of grape musts prior to fermentation.
pH 3.4
No SO2 50 mg/L SO2 100 mg/L lysozyme
pH 3.6
No SO2 50 mg/L SO2 100 mg/L lysozyme
pH 3.4
No SO2 50 mg/L SO2 100 mg/L lysozyme
pH 3.6
No SO2 50 mg/L SO2 100 mg/L lysozyme
pH 3.5
100 mg/L lysozyme Spontaneous MLF Simultaneous MLF Sequential MLF Spontaneous fermentation
Pinot Blanc 0% Botrytis cinerea Infection
Pinot Blanc 50% Botrytis cinerea Infection
Chardonnay
2.2. Synthetic Media Fermentations Bench-scale fermentation experiments were conducted in YPD-medium (Sigma-Aldrich, St. Louis, MO, USA) using the same wine yeast as trials conducted in grape must. Phosphoric acid and sodium hydroxide were used to adjust the pH to (1) pH 3.0 to mimic harsh wine conditions and (2) pH 6.6 to account for the pH optimum of the decarboxylase enzyme to maximize volatile phenol production while minimizing stress for the yeast. Fermentations were monitored over ten days. For the organism-free storage trials with lysozyme, an acetate buffer containing 6.0 g/L acetic acid and 8.2 g/L sodium acetate (all VWR International, Radnor, PA, USA) at pH 4.7 was prepared. This pH range is commonly used for enzyme-activity assessment, since it maximizes transformation rates [16]. Lysozyme (Lysovin, Scott Laboratories, Pickering, ON, Canada) was added to the buffer at 200 mg/L in addition to 500 mg/L dibutyl tartrate (Acros Organics, NJ, USA). Storage trials were conducted over 120 days and free tartrate was analyzed spectrophotometrically with sodium metavanadate (Sigma Aldrich, St. Louis, MO, USA) according to Rebelein [17] with minor modifications suggested by Fernandes and Reis [18]. 2.3. Hydroxycinnamic Acid Analysis by LC-DAD The analysis of hydroxycinnamic acids (HCA) by HPLC-DAD was adapted from Rentzsch et al. [19]. Quantitative analysis of HCAs at 320 nm was shown to have no interferences from other phenols or tannins from seeds and skins [20]. Identification of peaks was performed using analytical standards and UV-Vis spectral data [21,22]. The LC instrument consisted of a Jasco PU 980 low pressure gradient pump and the 3-line degasser Spectra Systems SCM 1000 coupled with a Jasco MD 2010 Plus, Diode Array Multiwavelength Detector (Jasco Germany GmbH, Gross-Umstadt, Germany). Samples were injected by a Spark Basic Marathon autosampler (Spark Holland B.V., Emmen, Netherlands) on a YMC-Pack ODS-AM separation column with the dimensions 250 mm × 4.6 mm and a particle size of 5 µm (YMC Europe GmbH, Dinslaken, Germany). The oven temperature was set to 50 ◦ C. A binary gradient at a constant flow of 0.5 mL/min was used with eluent A being water with 5% acetonitrile and a 10 mM KH2 PO4 /H3 PO4 buffer and eluent B being a 50:50 acetonitrile–water mixture with a 10 mM KH2 PO4 /H3 PO4 buffer. Conditions started at 85% eluent A decreased to 80% by 15 min, from 80% to
Fermentation 2018, 4, 5
4 of 11
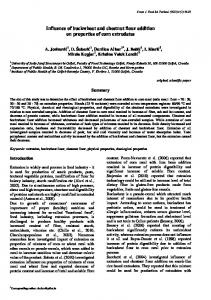
65% by 40 min, and from 65% to 45% by 45 min. After 50 min, it was then set back to initial conditions (85% A) for 10 min to reach equilibrium (total analysis time 60 min). Instrument control and data acquisition were performed with Chrompass Version 1.8 (Jasco Corporation, Gross-Umstadt, Germany). Most tartrate esters of hydroxycannamic acids are not commercially available [23], therefore the quantification was done as suggested in the literature by calculating concentrations as monomeric HCA equivalents [24]. HCAs were quantified as p-coumaric acid and ferulic acid equivalents (standards purchased from Sigma-Aldrich, St. Louis, MO, USA). 2.4. Volatile Phenol Analysis by GC-MS Volatile phenols were first extracted by solid phase extraction (Lichrolut EN 200 mg, Merck KGaA, Darmstadt, Germany), eluted with dichloromethane, and analyzed by GC-MS. [2 H2 ]-4-ethylphenol and 3,4 dimethylphenol were used as internal standards (500 µg/L prior to solid phase extraction). The GC-MS setup that was used was a Thermo Trace GCxGC (Thermo Fisher Scientific, Dreieich, Germany), with a split/splitless injector in connection with a Finnigan Trace DSQ (Thermo Fisher Scientific, Dreieich, Germany). An amount of 2 µL of sample was injected splitless under a surge pressure of 150 kPa for 2 min using a TriPlus AS autosampler (Thermo Fisher Scientific, Dreieich, Germany). The injector port was held at a temperature of 230 ◦ C. The separation column was a 20 m × 0.18 mm i.d. fused silica capillary column, coated with 0.32 µm of a 5% phenyl 95% dimethylpolysiloxane stationary phase (ZB-5, Phenomenex, Aschaffenburg, Germany). The inlet pressure was held at a constant pressure of 102 kPa with helium as a carrier gas. The temperature profile was started at 40 ◦ C, initially held for 4 min and then raised to 180 ◦ C with a rate of 3 ◦ C/min. It was held for 0.5 min and raised to 300 ◦ C with a rate of 6 ◦ C/min. That final temperature was held for 5 min to prepare for the next run. The MS transfer line and ion source temperature were held at 250 ◦ C. Electronic ionization was realized at 70 eV. Detection (EI+) was in the full scan mode (m/z 29–161) and quantification was done on extracted ion traces of fragment ions (4-ethylphenol: m/z 77, 107, 122; 4-vinylphenol: m/z 91, 120; 4-ethylguaiacol: m/z 137, 152; 4-vinylguaiacol: m/z 77, 107, 135, 150). Instrument control and data acquisition were performed with Xcalibur (Version 1.2; ThermoFisher Scientific, Waltham, MA, USA). 2.5. Flow Cytometry The analysis of yeast cell viability and bud-scar fluorescence was performed by flow cytometry using a CyFlow Cube 6 instrument (Sysmex Partec, Görlitz, Germany) equipped with a 488-nm laser. Fluorescein diacetate and propidium iodide (both Sigma Aldrich, St. Louis, MO, USA) were used for viability with a protocol published by Hutter [25]. A wheat germ agglutinin–fluorescein isothiocyanate conjugate (Sigma Aldrich, St. Louis, MO, USA) was used for bud-scar analysis as described by Hutter and Nitzsche [26]. 2.6. Data Analysis Data handling and statistical analyses were done with the Excel Statistics Add-on XL-Stat 2010 (Addinsoft Deutschland, Andernach, Germany) and SigmaPlot 12.5 (Systat Software Inc., San Jose, CA, USA). 3. Results and Discussion Previous studies suggest that a delay in malolactic fermentation can lead to elevated levels of volatile phenols [27]; the reason for that phenomenon is currently unknown. The malic acid degradation in Chardonnay and Pinot blanc shown in Figure 1 confirms that lysozyme can delay but not inhibit MLF if it is added in concentrations below the legal limit. Since results obtained in 2009 were very similar to those in 2008, they were used as confirmation data and are not presented separately here.
Fermentation 2018, 4, x; doi: 10.3390/fermentation4010005
5 of 11
were very similar to those in 2008, they were used as confirmation data and are not presented Fermentation separately 2018, here.4, 5
5 of 11
7
6
5
Control Lysozyme 100 mg/L pH 3,4 Lysozyme 100 mg/L pH 3,6 Sulfite 50 mg/L pH 3,4 Sulfite 50 mg/L pH 3,6
6
Malic acid [g/L]
Malic acid [g/L]
7
Lysozyme 100 mg/L Spontaneous MLF Simultaneous MLF MLF after fermentation Spontaneous AF and MLF
4
3
2
1
5 4 3 2 1
0 0
20
40
Days of fermentation
(a)
60
80
0 0
20
40
60
80
Days of fermentation
(b)
Figure 1. Delayed (a) and Figure 1. Delayed malolactic malolactic fermentation fermentation due due to to the the addition addition of of lysozyme lysozyme in in Chardonnay Chardonnay (a) and Pinot Pinot blanc (b) analyzed by FT-MIR spectroscopy (AF: alcoholic fermentation, MLF: malolactic fermentation) blanc (b) analyzed by FT-MIR spectroscopy (AF: alcoholic fermentation, MLF: malolactic fermentation) Error Error bars bars represent represent the the standard standarddeviation deviationof ofexperimental experimentalduplicates. duplicates.
The addition of 100 mg/L lysozyme in 2008 was only sufficient to delay MLF for about 50 days, The addition of 100 mg/L lysozyme in 2008 was only sufficient to delay MLF for about 50 days, after which malate degradation could be observed and was essentially complete in a time-span after which malate degradation could be observed and was essentially complete in a time-span comparable to the control. It remains unclear whether the lysozyme was degraded, bound, comparable to the control. It remains unclear whether the lysozyme was degraded, bound, precipitated, precipitated, or somehow metabolized but a clear loss in activity is evident over time as reported in or somehow metabolized but a clear loss in activity is evident over time as reported in other other studies [4,28]. studies [4,28]. It is suggested that lysozyme can bind to polyphenols, which leads to the inactivation of the It is suggested that lysozyme can bind to polyphenols, which leads to the inactivation of the enzyme. These processes may occur in the first few days of fermentation. As previously described, enzyme. These processes may occur in the first few days of fermentation. As previously described, the effect of lysozyme additions is comparable to low sulfur dioxide additions [5], which could also the effect of lysozyme additions is comparable to low sulfur dioxide additions [5], which could also be be confirmed here by the direct comparison between the two treatments (Figure 1b). In this case, 50 confirmed here by the direct comparison between the two treatments (Figure 1b). In this case, 50 mg/L mg/L SO2 had the same effect as 100 mg/L lysozyme. General yeast performance and the yield of SO2 had the same effect as 100 mg/L lysozyme. General yeast performance and the yield of alcoholic alcoholic fermentation in this study was not influenced by lysozyme. Since pH influences the fermentation in this study was not influenced by lysozyme. Since pH influences the efficiency of sulfur efficiency of sulfur dioxide, the lower pH shown in Figure 1b displays a longer delay in MLF but dioxide, the lower pH shown in Figure 1b displays a longer delay in MLF but seems to have no effect seems to have no effect on lysozyme. on lysozyme. There are indications in the literature that lysozyme additions can modify the volatile aroma There are indications in the literature that lysozyme additions can modify the volatile aroma characteristics of wine even if no MLF is observed [29]. In the present study, additional observations characteristics of wine even if no MLF is observed [29]. In the present study, additional observations could be made that involve the effect of lysozyme on the phenolic profile of wine, suggesting that could be made that involve the effect of lysozyme on the phenolic profile of wine, suggesting that lysozyme addition to the juice prior to fermentation may not only affect bacterial activity but also the lysozyme addition to the juice prior to fermentation may not only affect bacterial activity but also release of hydroxycinnamic acids from their tartrate esters. This increases the theoretical potential for the release of hydroxycinnamic acids from their tartrate esters. This increases the theoretical potential volatile phenol formation because microorganisms can only metabolize free hydroxycinnamates. for volatile phenol formation because microorganisms can only metabolize free hydroxycinnamates. Although general yeast performance was not affected by lysozyme, wines with delayed malolactic Although general yeast performance was not affected by lysozyme, wines with delayed malolactic fermentation due to low level lysozyme addition (100 mg/L) contained significantly higher fermentation due to low level lysozyme addition (100 mg/L) contained significantly higher concentrations of free hydroxycinnamic acids. Figure 2 shows hydroxycinnamic acids after wine concentrations of free hydroxycinnamic acids. Figure 2 shows hydroxycinnamic acids after wine production in Pinot blanc with healthy grapes and 50% Botrytis cinerea infected grapes, as well as in production in Pinot blanc with healthy grapes and 50% Botrytis cinerea infected grapes, as well as Chardonnay. in Chardonnay. While Botrytis only has a minor effect on the concentration of p-coumaric acid after fermentation, While Botrytis only has a minor effect on the concentration of p-coumaric acid after fermentation, ferulic acid was below the detection limit in most wines made from infected grapes. The only ferulic acid was below the detection limit in most wines made from infected grapes. The only exceptions were wines treated with lysozyme. One explanation could be the increased activity of exceptions were wines treated with lysozyme. One explanation could be the increased activity of Botrytis cinerea’s polyphenol oxidase, laccase, which is not inhibited by low levels of sulfur dioxide Botrytis cinerea’s polyphenol oxidase, laccase, which is not inhibited by low levels of sulfur dioxide and and could therefore reduce HCAs effectively. Previous studies suggest that Botrytis infections could therefore reduce HCAs effectively. Previous studies suggest that Botrytis infections influence influence HCAs differently [30]. While ferulic acid and caffeic acid can be depleted completely, HCAs differently [30]. While ferulic acid and caffeic acid can be depleted completely, p-coumaric acid p-coumaric acid tends to remain stable, leading to a higher potential of 4-vinylphenol production in tends to remain stable, leading to a higher potential of 4-vinylphenol production in infected wines. It is infected wines. It is also worth noting that an analytical decrease in HCA tartrate esters does not also worth noting that an analytical decrease in HCA tartrate esters does not necessarily correspond
Fermentation 2018, 4, 5 Fermentation 2018, 4, x; doi: 10.3390/fermentation4010005
6 of 11 6 of 11
necessarily correspond to an This increase in explained free HCAs.byThis explained themolecules high reactivity of to an increase in free HCAs. can be the can highbereactivity of by these and the these molecules and reaction the formation of several formation of several products (GRPs)reaction [31,32]. products (GRPs) [31,32].
Figure in in Pinot blanc with (a) (a) healthy grapes andand (b) Figure 2. 2. Hydroxycinnamic Hydroxycinnamicacids acidsafter afterwinemaking winemaking Pinot blanc with healthy grapes 50% Botrytis cinerea infected grapes, as well as (c) in Chardonnay (AF: alcoholic fermentation, MLF: (b) 50% Botrytis cinerea infected grapes, as well as (c) in Chardonnay (AF: alcoholic fermentation, malolactic fermentation) vintage vintage 2008. Letters indicate statistically significant differences MLF: malolactic fermentation) 2008.a,b,c,d,e,f,g Letters a,b,c,d,e,f,g indicate statistically significant determined by ANOVA.by ANOVA. differences determined
While the concentration of free hydroxycinnamic acids was significantly higher in Pinot blanc While the concentration of free hydroxycinnamic acids was significantly higher in Pinot blanc wines, Chardonnay treated with lysozyme prior to fermentation did not display elevated levels wines, Chardonnay treated with lysozyme prior to fermentation did not display elevated levels compared to other fermentation strategies (Figure 2). This inconsistent behavior cannot be explained by compared to other fermentation strategies (Figure 2). This inconsistent behavior cannot be explained by lysozyme alone but might be caused by differences in pH, inhibiting compounds, and the availability lysozyme alone but might be caused by differences in pH, inhibiting compounds, and the availability of of tartrate-bound precursors as reported by Chatonnet, Dubourdieu, Boidron and Lavigne [12]. tartrate-bound precursors as reported by Chatonnet, Dubourdieu, Boidron and Lavigne [12]. However, However, when free hydroxycinnamic acids are present, the potential for volatile phenol formation when free hydroxycinnamic acids are present, the potential for volatile phenol formation increases increases drastically. Figure 3 shows volatile phenol levels in the corresponding Chardonnay and Pinot drastically. Figure 3 shows volatile phenol levels in the corresponding Chardonnay and Pinot blanc blanc wines. According to the literature, HCAs are metabolized to volatile phenols as long as no wines. According to the literature, HCAs are metabolized to volatile phenols as long as no inhibiting inhibiting substances such as tannins are present [12]. In Pinot blanc with a low concentration of substances such as tannins are present [12]. In Pinot blanc with a low concentration of phenolic phenolic substances, the decarboxylation should readily occur. substances, the decarboxylation should readily occur. The pattern of volatile phenol production over all experiments shows a positive correlation The pattern of volatile phenol production over all experiments shows a positive correlation (correlation coefficient: 0.708, p value: 0.009) with precursor concentrations shown in Figure 2. The (correlation coefficient: 0.708, p value: 0.009) with precursor concentrations shown in Figure 2. The only only exception is the lysozyme-treated wine with higher pH. Despite the high level of p-coumaric exception is the lysozyme-treated wine with higher pH. Despite the high level of p-coumaric acid, acid, the formation of the corresponding volatile phenol was not increased. Possible reasons for that were evaluated in model wines and will be discussed later.
Fermentation 2018, 4, 5
7 of 11
the formation the corresponding volatile phenol was not increased. Possible reasons for that 7were Fermentation 2018,of 4, x; doi: 10.3390/fermentation4010005 of 11 evaluated in model wines and will be discussed later.
Figure Figure 3. 3. Volatile Volatile phenol phenol concentration concentration in in (a) (a) Pinot Pinot blanc blanc and and (b) (b) Chardonnay Chardonnay wines wines (AF: (AF: alcoholic alcoholic fermentation, MLF: malolactic fermentation). Letters a,b,c,d indicate statistically significant differences fermentation, MLF: malolactic fermentation). Letters a,b,c,d indicate statistically significant determined by paired t-test. differences determined by paired t-test.
The transformation acids intointo volatile phenols couldcould be a stress reaction where transformationofofhydroxycinnamic hydroxycinnamic acids volatile phenols be a stress reaction acids are metabolized into a less toxic form [7]. Saccharomyces cerevisiae is only able to decarboxylize where acids are metabolized into a less toxic form [7]. Saccharomyces cerevisiae is only able to the trans-(E)-configuration with a higher affinity acid compared to ferulic acid [12]. decarboxylize the trans-(E)-configuration with atowards higher p-coumaric affinity towards p-coumaric acid compared Our results (in[12]. Figures and 3)(in show this 2higher but higher also illustrate of which to ferulic acid Our 2results Figures and 3)affinity, show this affinity,the butquestion also illustrate the factors might influence the yeast metabolism of these compounds. question of which factors might influence the yeast metabolism of these compounds. It It was was previously previously observed observed that that the the concentration concentration of of monomeric monomeric hydroxycinnamates hydroxycinnamates increased increased in the presence of lysozyme [33]. In the current study, this increase occurred after alcoholic in the presence of lysozyme [33]. In the current study, this increase occurred after alcoholic and and malolactic malolactic fermentation fermentation in in the the wine wine matrix, matrix, indicating indicating aa slow slow process process and and only only passive passive involvement involvement of of the the present present organisms. organisms. Consequently, Consequently, the the subsequent subsequent model model trials trials were were performed performed under under sterile sterile conditions without organisms. Model experiments using dibutyl tartrate as a model tartrate conditions without organisms. Model experiments using dibutyl tartrate as a model tartrate ester ester revealed ester bonds to to bebe cleaved (Figure 4). revealed that that lysozyme lysozymeindeed indeedhas hasaaside sideactivity activitythat thatcauses causesthese these ester bonds cleaved (Figure An inexpensive model ester, dibutyl tartrate, was 4). An inexpensive model ester, dibutyl tartrate, wasused usedtotospecifically specificallymonitor monitorthe thetartrate tartrate esterase esterase activity optimized pH pH conditions for this as suggested by Sashiwa, Saimoto, activity over overtime. time.Under Under optimized conditions forreaction, this reaction, as suggested by Sashiwa, Shigemasa, Ogawa and Tokura which is which slightly found wine,in the model is Saimoto, Shigemasa, Ogawa and[16], Tokura [16], is higher slightlythan higher thaninfound wine, theester model degraded within 120 days, which leads to a significant increase in free tartaric acid levels compared to ester is degraded within 120 days, which leads to a significant increase in free tartaric acid levels the control.to the control. compared It Gram-positive lactic lactic acid acid bacteria bacteria are are sensitive sensitive to to lysozyme; lysozyme; however, however, It is is well well established established that that Gram-positive it has been shown before that yeast can also be affected under certain conditions. Some molecular it has been shown before that yeast can also be affected under certain conditions. Some molecular biological biological methods methods use use the the lysozyme lysozyme in in combination combination with with other other enzymes enzymes at at pH pH 55 to to perforate perforate the the cell cell wall wall of of yeast yeast in in order order to to make make it it accessible accessible for for fluorescent fluorescent probes probes [34]. [34]. It It is is plausible plausible that that lysozyme lysozyme is is able to directly influence the metabolism of yeast cells since the structure of chitin in their cell walls able to directly influence the metabolism of yeast cells since the structure of chitin in their cell walls and and specifically specifically in in bud bud scars scars is is structurally structurally similar similar to to the the target target molecules molecules of of Gram-positive Gram-positive bacteria bacteria cells. The yeast yeast cell cell wall wall is is complexed complexed with with approximately approximately 2–4 2–4 % % chitin chitin to to provide provide stability. stability. The chitin cells. The The chitin is is mainly mainly located located in in the the ringed ringed structures structures of of bud bud and and birth birth scars scars [35]. [35]. Even Even partial partial degradation degradation could could lead lead to to an an increasing increasing stress stress level, level, leaky leaky cells, cells, and and the the induction induction of of detoxification detoxificationpathways. pathways. Our can affect Our experiments experiments in in model model systems systems indicate indicate that that lysozyme lysozyme can affect the the yeast yeast by by attacking attacking chitin. To clarify chitin. To clarify the the role role of of Saccharomyces Saccharomyces in in the the release release of of volatile volatile phenols phenols from from increased increased precursor precursor concentrations, these experiments concentrations, these experiments were were done done in in aa synthetic synthetic YPD YPD medium. medium. While While fermentation fermentation performance was not affected by HCA or lysozyme additions as high as 500 mg/L, survival performance was not affected by HCA or lysozyme additions as high as 500 mg/L, cellcell survival at at low after fermentation waslowered loweredsignificantly significantly(Figure (Figure5). 5).The Theantimicrobial antimicrobial effect effect of of HCAs HCAs on low pHpH after fermentation was on lactic acid bacteria through neutralizing the membrane potential and disrupting energy generation for the cell has been reported [36] but the trend can also be observed with yeast here. The number of dead cells in the presence of HCAs was significantly higher at low pH than the control and at a higher pH. The effect of lysozyme on bud scar fluorescence is also clearly visible at high pH. Increased
Fermentation 2018, 4, 5
8 of 11
lactic acid bacteria through neutralizing the membrane potential and disrupting energy generation for the cell has been reported [36] but the trend can also be observed with yeast here. The number of dead cells in the presence of HCAs was significantly higher at low pH than the control and at a higher8 of pH. Fermentation 2018, 4, x; doi: 10.3390/fermentation4010005 11 The effect of lysozyme on bud scar fluorescence is also clearly visible at high pH. Increased fluorescence indicates thatindicates more chitin exposed can bindand thecan dye,bind which an which indication it is partially fluorescence thatismore chitinand is exposed the is dye, is anthat indication that it degraded. observation supports thesupports hypothesis under certain circumstances, lysozyme can is partiallyThis degraded. This observation thethat, hypothesis that, under certain circumstances, play a rolecan in the long-term and viability yeast. lysozyme play a role in survival the long-term survivalofand viability of yeast.
Figure 4. 4. Free Free tartaric tartaric acid acid released releasedfrom fromthe themodel modelester esterdibutyl dibutyltartrate tartrateafter after120 120days daysofofstorage storage Figure inin a a model system in the presence of lysozyme without microbial activity. model system in the presence of lysozyme without microbial activity.
HCAs may have an inhibiting effect on starving yeast cells when the ability to maintain neutral HCAs may have an inhibiting effect on starving yeast cells when the ability to maintain neutral cellular pH is limited. Figure 5b shows a significant increase in dead yeast cells at low pH and cellular pH is limited. Figure 5b shows a significant increase in dead yeast cells at low pH and especially with higher levels of HCA in the medium. The cellular detoxification mechanism should especially with higher levels of HCA in the medium. The cellular detoxification mechanism should lead to higher rates of decarboxylation and therefore increased levels of volatile phenols as observed lead to higher rates of decarboxylation and therefore increased levels of volatile phenols as observed in other studies [7]. in other studies [7].
Figure 5. Model fermentations in YPD medium in the presence of lysozyme and hydroxycinnamic Figure 5. Model fermentations in YPD medium in the presence of lysozyme and hydroxycinnamic acids at different pH conditions ((a) bud scar fluorescence by flow cytometry, (b) yeast viability by flow acids at different pH conditions ((a) bud scar fluorescence by flow cytometry, (b) yeast viability by cytometry). Letters a,b,c indicate statistically significant differences determined by paired t-test. flow cytometry). Letters a,b,c indicate statistically significant differences determined by paired t-test.
However, this increase does not occur in all cases. In our wine experiments, only Pinot blanc at lower pH showed significantly higher levels of volatile phenol production with elevated precursor concentrations. On the other hand, the Chardonnay trials with larger amounts of monomeric hydroxycinnamates did not necessarily result in higher volatile phenol synthesis. Previous studies demonstrated that HCAs are passively transported into the cell easier than other phenolic acids [12,13,37]. With a pKA between 4.01 and 4.42, these molecules have a predominantly neutral charge
Fermentation 2018, 4, 5
9 of 11
However, this increase does not occur in all cases. In our wine experiments, only Pinot blanc at lower pH showed significantly higher levels of volatile phenol production with elevated precursor concentrations. On the other hand, the Chardonnay trials with larger amounts of monomeric hydroxycinnamates did not necessarily result in higher volatile phenol synthesis. Previous studies demonstrated that HCAs are passively transported into the cell easier than other phenolic acids [12,13,37]. With a pKA between 4.01 and 4.42, these molecules have a predominantly neutral charge at wine pH and are not deprotonated. After reaching the cytoplasm through passive diffusion, the acids release a proton and lower the cellular pH. The decarboxylase that produces volatile phenols is activated by low pH and the enzyme activity is generally decreasing with increasing pH [38]. Conversely, at higher pHs (i.e., pH 6.6 in this case), HCAs are favored in their dissociated form and are therefore not transported nor decarboxylated by the yeast. Table 3 shows the decrease of p-coumaric acid in a model system during fermentation. Table 3. Changes in p-coumaric acid at different concentrations and pH in model trials. Sample
Initial p-Coumaric Acid Concentration (mg/L)
p-Coumaric Acid after 10 Days (mg/L)
p-Coumaric Acid Lost (%)
pH 3.0; 100 ppm lysozyme pH 3.0; 100 ppm lysozyme pH 3.0; 500 ppm lysozyme pH 3.0; 500 ppm lysozyme pH 6.6; 100 ppm lysozyme pH 6.6; 100 ppm lysozyme pH 6.6; 500 ppm lysozyme pH 6.6; 500 ppm lysozyme
100.8 500.7 100.8 500.7 100.5 500.9 100.5 500.9
76.6 ± 10.1 401.5 ± 13.3 78.7 ± 25.3 393.6 ± 3.2 76.7 ± 1.6 438.7 ± 20.8 82.8 ± 4.6 439.1 ± 21.9
23.4 ± 10.1 19.7 ± 2.7 21.3 ± 25.3 21.3 ± 0.6 23.3 ± 1.6 12.3 ± 4.2 17.2 ± 4.6 12.2 ± 4.4
Quantitatively, some HCAs are always lost, independent from starting concentration, pH, or lysozyme addition. However, at higher pH, the medium seems to retain higher levels of p-coumaric acid, especially when concentrations are high. Campos, Couto and Hogg [36] demonstrated that 500 mg/L of HCAs can inhibit bacteria; however, yeast seems to be less affected by these unusually high levels. At low wine pH, on the other hand, possibly in combination with other stressful medium conditions, hydroxycinnamic acids can be readily converted into volatile phenols once they are released from their precursors. 4. Conclusions Our studies performed with Chardonnay and Pinot blanc fermentations in two vintages suggest that lysozyme addition to juice prior to fermentation may not only affect bacterial activity but also the release of hydroxycinnamic acids from their tartrate esters. This increases the theoretical potential for volatile phenol formation because microorganisms can only metabolize free hydroxycinnamates. In addition to that, lysozyme and HCAs in combination with unfavorable pH conditions were shown to have a negative effect on yeast survival after fermentation. These stress conditions around pH 3 are expected to result in an attempt to detoxify the medium in order to secure cell survival and consequently cause a higher production of volatile phenols. Since this could not be observed in all cases, additional factors, for example phenolic inhibitors, might be involved in triggering or suppressing that mechanism. The antimicrobial activity through an addition of lysozyme to wine fermentations, however, is accompanied by a side activity that needs to be considered from a stylistic perspective. Acknowledgments: The project was partially supported by the German Ministry of Economics and Technology (via AiF) and the FEI (Forschungskreis der Ernährungsindustrie e.V., Bonn). Project AiF 15833 N. Author Contributions: Stephan Sommer and Ulrich Fischer conceived and designed the experiments; Stephan Sommer and Pascal Wegmann-Herr performed the experiments; Stephan Sommer and Michael Wacker analyzed the data; Stephan Sommer wrote the paper. Conflicts of Interest: The authors declare no conflict of interest.
Fermentation 2018, 4, 5
10 of 11
References 1.
2. 3. 4. 5. 6. 7. 8. 9. 10. 11. 12. 13. 14.
15. 16. 17. 18. 19.
20. 21. 22.
23.
Radler, F. Microbiological principles of acid degradation in wine. In Zentralblatt fuer Bakteriologie, Parasitenkunde und Infektionskrankheiten, Abteilung II; Verlag von Gustav Fischer: Hamburg, Germany, 1966; Volume 120, pp. 237–287. Toit, M.D.; Pretorius, I.S. Microbial spoilage and preservation of wine: Using weapons from nature’s own arsenal—A review. S. Afr. J. Enol. Vitic. 2000, 21, 74–96. International Organisation of Vine and Wine (OIV). Coei-1-lysozy: 2007: Lysozyme muramidase. In International Œnological Codex; International Organisation of Vine and Wine: Paris, France, 2007. Weiand, J. Gärstörung: Bakterienkontrolle durch lysozym. Das Deutsch. Weinmag. 2004, 22, 24. Gerbaux, V.; Villa, A.; Monamy, C.; Bertrand, A. Use of lysozyme to inhibit malolactic fermentation and to stabilize wine after malolactic fermentation. Am. J. Enol. Vitic. 1997, 48, 49–54. Shugar, D. The measurement of lysozyme activity and the ultra-violet inactivation of lysozyme. Biochim. Biophys. Acta 1952, 8, 302–309. [CrossRef] Couto, J.A.; Campos, F.M.; Figueiredo, A.R.; Hogg, T.A. Ability of lactic acid bacteria to produce volatile phenols. Am. J. Enol. Vitic. 2006, 57, 166–171. Okamura, S.; Watanabe, M. Determination of phenolic cinnamates in white wine and their effect on wine quality. Agric. Biol. Chem. 1981, 45, 2063–2070. Reguant, C.; Bordons, A.; Arola, L.; Rozes, N. Influence of phenolic compounds on the physiology of oenococcus oeni from wine. J. Appl. Microbiol. 2000, 88, 1065–1071. [CrossRef] [PubMed] Suarez, R.; Suarez-Lepe, J.A.; Morata, A.; Calderon, F. The production of ethylphenols in wine by yeasts of the genera brettanomyces and dekkera: A review. Food Chem. 2007, 102, 10–21. [CrossRef] Rapp, A.; Versini, G. Flüchtige phenolische verbindungen in wein. Deutsch. Lebensm.-Rundsch. 1996, 92, 42–48. Chatonnet, P.; Dubourdieu, D.; Boidron, J.N.; Lavigne, V. Synthesis of volatile phenols by saccharomyces cerevisiae in wines. J. Sci. Food Agric. 1993, 62, 191–202. [CrossRef] Chatonnet, P.; Dubourdieu, D.; Boidron, J.N.; Pons, M. The origin of ethylphenols in wines. J. Sci. Food Agric. 1992, 60, 165–178. [CrossRef] Dugelay, I.; Gunata, Z.; Sapis, J.C.; Baumes, R.; Bayonove, C. Role of cinnamoyl esterase activities from enzyme preparations on the formation of volatile phenols during winemaking. J. Agric. Food Chem. 1993, 41, 2092–2096. [CrossRef] Grando, M.S.; Versini, G.; Nicolini, G.; Mattivi, F. Selective use of wine yeast strains having different volatile phenols production. Vitis 1993, 32, 43–50. Sashiwa, H.; Saimoto, H.; Shigemasa, Y.; Ogawa, R.; Tokura, S. Lysozyme susceptibility of partially deacetylated chitin. Int. J. Biol. Macromol. 1990, 12, 295–296. [CrossRef] Rebelein, H. Kolorimetrisches verfahren zur gleichzeitigen bestimmung der weinsäure und milchsäure in wein und most. Deutsch. Lebensm.-Rundsch. 1961, 57, 36–41. Fernandes, E.N.; Reis, B.F. Automatic spectrophotometric procedure for the determination of tartaric acid in wine employing multicommutation flow analysis process. Anal. Chim. Acta 2006, 557, 380–386. [CrossRef] Rentzsch, M.; Weber, F.; Durner, D.; Fischer, U.; Winterhalter, P. Variation of pyranoanthocyanins in red wines of different varieties and vintages and the impact of pinotin a addition on their color parameters. Eur. Food Res. Technol. 2009, 229, 689–696. [CrossRef] Somers, T.C.; Verette, E.; Pocock, K. Hydroxycinnamate esters of vitis vinifera: Changes during white vinification, and effects of exogenous enzymic hydrolysis. J. Sci. Food Agric. 1987, 40, 67–78. [CrossRef] Ong, B.Y.; Nagel, C.W. High-pressure liquid chromatographic analysis of hydroxycinnamic acid-tartaric acid esters and their glucose esters in vitis vinifera. J. Chromatogr. 1978, 157, 345–355. [CrossRef] Ritter, G. Die Bedeutung der Phenolischen Saft- und Weininhaltsstoffe Während der Verarbeitung von äpfeln, Speierling und Weißen Trauben. 1994. Available online: https://www.tib.eu/de/suchen/id/TIBKAT% 3A183811992/Die-Bedeutung-der-phenolischen-Saft-und-Weininhaltsstoffe/ (accessed on 19 January 2018). Maier, T.; Sanzenbacher, S.; Kammerer, D.R.; Berardini, N.; Conrad, J.; Beifuss, U.; Carle, R.; Schieber, A. Isolation of hydroxycinnamoyltartaric acids from grape pomace by high-speed counter-current chromatography. J. Chromatogr. A 2006, 1128, 61–67. [CrossRef] [PubMed]
Fermentation 2018, 4, 5
24. 25. 26. 27. 28.
29.
30.
31. 32. 33. 34. 35. 36. 37.
38.
11 of 11
Chamkha, M.; Cathala, B.; Cheynier, V.; Douillard, R. Phenolic composition of champagnes from chardonnay and pinot noir vintages. J. Agric. Food Chem. 2003, 51, 3179–3184. [CrossRef] [PubMed] Hutter, K.-J. Schnellbestimmungen zur tot-lebend-analyse von hefezellen. Brauwelt 1992, 132, 252–259. Hutter, K.-J.; Nitzsche, F. Untersuchungen über die alterung der bierhefen mit hilfe der flusszytometrischen analyse. Monatsschr. Brauwiss. 2002, 55, 196–199. Gerbaux, V.; Briffox, C.; Dumont, A.; Krieger, S. Influence of inoculation with malolactic bacteria on volatile phenols in wines. Am. J. Enol. Vitic. 2009, 60, 233–235. Bartowsky, E.J.; Costello, P.J.; Villa, A.; Henschke, P.A. The chemical and sensorial effects of lysozyme addition to red and white wines over six months’ cellar storage. Aust. J. Grape Wine Res. 2004, 10, 143–150. [CrossRef] Sonni, F.; Cejudo Bastante, M.J.; Chinnici, F.; Natali, N.; Riponi, C. Replacement of sulfur dioxide by lysozyme and oenological tannins during fermentation: Influence on volatile composition of white wines. J. Sci. Food Agric. 2009, 89, 688–696. [CrossRef] Geny, L.; Darrieumerlou, A.; Doneche, B. Conjugated polyamines and hydroxycinnamic acids in grape berries during botrytis cinerea disease development: Differences between ‘noble rot’ and ‘grey mould’. Aust. J. Grape Wine Res. 2003, 9, 102–106. [CrossRef] Cheynier, V.F.; Trousdale, E.K.; Singleton, V.L.; Salgues, M.J.; Wylde, R. Characterization of 2-S-glutathionyl caftaric acid and its hydrolysis in relation to grape wines. J. Agric. Food Chem. 1986, 34, 217–221. [CrossRef] Singleton, V.; Salgues, M.; Zaya, J.; Trousdale, E. Caftaric acid disappearance and conversion to products of enzymic oxidation in grape must and wine. Am. J. Enol. Vitic. 1985, 36, 50–56. Cabrita, M.J.; Torres, M.; Palma, V.; Alves, E.; Patão, R.; Costa Freitas, A.M. Impact of malolactic fermentation on low molecular weight phenolic compounds. Talanta 2008, 74, 1281–1286. [CrossRef] [PubMed] Knorr, D.; Shetty, K.J.; Kinsella, J.E. Enzymatic lysis of yeast cell walls. Biotechnol. Bioeng. 1979, 21, 2011–2021. [CrossRef] Walker, G.M. Yeast Physiology and Biotechnology; John Wiley & Sons: West Sussex, UK, 2000. Campos, F.M.; Couto, J.A.; Hogg, T.A. Influence of phenolic acids on growth and inactivation of oenococcus oeni and lactobacillus hilgardii. J. Appl. Microbiol. 2003, 94, 167–174. [CrossRef] [PubMed] Chatonnet, P.; Barbe, C.; Canal-Llauberes, R.M.; Dubourdieu, D.; Boidron, J.N.; Pons, M. Incidence of some pectolytic preparations on the volatile phenols content of white wines. J. Int. Sci. Vigne Vin 1992. Available online: http://agris.fao.org/agris-search/search.do?recordID=FR9304000 (accessed on 19 January 2018). Molenaar, D.; Bosschner, J.S.; Brink, B.; Driessen, A.J.M. Generation of a proton motive force by histidine decarboxylation and electrogenic histidine/histamine antiport in lactobacillus buchneri. J. Bacteriol. 1993, 175, 2864–2870. [CrossRef] [PubMed] © 2018 by the authors. Licensee MDPI, Basel, Switzerland. This article is an open access article distributed under the terms and conditions of the Creative Commons Attribution (CC BY) license (http://creativecommons.org/licenses/by/4.0/).