Available online at www.sciencedirect.com
ScienceDirect Procedia CIRP 46 (2016) 331 – 335
7th HPC 2016 – CIRP Conference on High Performance Cutting
Influence of machining on the microstructure, mechanical properties and corrosion behaviour of a low carbon martensitic stainless steel S. Bissey-Bretona,c, V. Vignalb,c*, F. Herbstb,c, J.B. Couderta,b,c a CEA Valduc, 21120 Is sur Tille, FRANCE ICB UMR 6303 CNRS, Université Bourgogne-Franche Comté, BP 47870, 21078 Dijon, FRANCE c LIMPE (Interaction Matériau-Procédé-Environnement), LRC DAM-VA-11-02, Dijon, FRANCE * Corresponding author. Tel.: +33-03-80-39-61-60. E-mail address:
[email protected]. b
Abstract
The influence of cutting conditions of a low carbon martensitic stainless steel (15.5wt.% Cr, 4.8% Ni, 1% Mo, 0.9% Mn, 0.24% Si, 0.1% Cu, < 0.06% C and 77.46% Fe) on the microstructure is first studied using electron backscatter diffraction and transmission electron microscopy. The mechanical and corrosion behaviours of this stainless steel are then investigated. It was found that the microstructure is significantly affected near the machined surface. The formation of grain sub-boundaries or a refinement of the microstructure is observed depending on cutting conditions. Both lead to an increase of the hardness. In addition, the microstructure refinement yields to a huge increase of the average pit surface area. By contrast the average pit density is not affected by machining conditions. © The Authors. Published by Elsevier B.V This isB.V. an open access article under the CC BY-NC-ND license ©2016 2016 The Authors. Published by Elsevier (http://creativecommons.org/licenses/by-nc-nd/4.0/). Peer-review under responsibility of the International Scientific Committee of 7th HPC 2016 in the person Peer-review under responsibility of the International Scientific Committee of 7th HPC 2016 in the person of the Conference Chair Chair Prof. Matthias Putz. Prof. Matthias Putz
of the Conference
Keywords: machining; stainless steel; corrosion; mechanical properties.
2212-8271 © 2016 The Authors. Published by Elsevier B.V. This is an open access article under the CC BY-NC-ND license (http://creativecommons.org/licenses/by-nc-nd/4.0/). Peer-review under responsibility of the International Scientific Committee of 7th HPC 2016 in the person of the Conference Chair Prof. Matthias Putz doi:10.1016/j.procir.2016.04.016
332
S. Bissey-Breton et al. / Procedia CIRP 46 (2016) 331 – 335
1. Introduction Machining is used in numerous industrial sectors to produce workpieces with required shape, dimensions, and surface finish (surface characteristics such as roughness and subsurface characteristics such as texture, residual stresses and microstructure). One of the great challenges of modern machining is to optimise surface finish for the increase of the performance and lifetime of workpieces. Numerous experimental studies have quantified the influence of cutting parameters on the surface and sub-surface characteristics of metallic alloys [1,2]. By contrast, only a few experimental investigations have been carried out to study the performance of workpieces machined under different cutting conditions and it would be interesting to link both. This includes the mechanical behaviour [3], the resistance to crack initiation and propagation [4] under external loading and the corrosion behaviour [5,6]. Martensitic stainless steels (MMS) have a complex microstructure composed of martensite laths, austenite film between laths and ferrite islands. It is therefore interesting to quantify the influence of machining on the surface finish and the performance of this complex microstructure. The surface roughness produced by turning of MMS was already measured [7]. In a previous work [8], it was found that machined samples made of MSS can be classified into three categories based on the observable deformation: samples with severe observable deformation, noticeable observable deformation and no observable deformation. The observable deformation was qualitatively assessed from optical observations of cross-sections using ferrite islands as deformation indicators. It was also found [8] that severe observable deformation is generated under machining performed with the highest value of the feed rate, f. By contrast, there is no observable deformation in two configurations: machining with the lowest value of f or machining with intermediary values of f and the lowest value of the cutting speed, Vc. In the present study, microstructural changes induced by machining of MSS are quantified by means of electron backscatter diffraction (EBSD) and transmission electron microscopy (TEM). Samples representative of the first (severe observable deformation) and the third (no observable deformation) categories were selected. The corrosion behaviour of these two samples was then evaluated using the potentiostatic pulse technique (PPT). Obtained results were
discussed considering microstructural changes determined previously and machining conditions (values of f and Vc). 2. Experimental The studied material is a low carbon MSS. Its chemical composition is (wt.%): 15.5% Cr, 4.8% Ni, 1% Mo, 0.9% Mn, 0.24% Si, 0.1% Cu, < 0.06% C and 77.4% Fe. The material underwent a heat treatment at 1040°C, followed by an oil quenching, and a tempering treatment at 570°C. Investigations were carried out on two machined samples extracted from the non-orthogonal design of experiments described in [8]: Sample #1 with no observable deformation (f = 0.1 mm/tr and Vc = 73 m/min) and Sample #2 with severe observable deformation (f = 0.3 mm/tr and Vc = 182 m/min). In both cases, the depth of cut was set at 4 mm and no lubricant was used. The orientation of grains was determined on cross-section surfaces using the INCA Crystal EBSD System coupled with a field emission scanning electron microscope (JEOL JSM6400F). EBSD measurements were performed with a step of 30 nm. The grain angle tolerance was set at 15°. Surfaces were ground (emery papers), smoothed (diamond pastes). A specific vibratory polishing was then carried out (VibroMet 2 vibratory polisher from Buehler). FE-TEM investigations were carried out using a JEOL JEM-2100 microscope with a LaB6 source operating at 200 kV. For sample preparation, classical grinding, polishing and dimpling methods (Dimple Grinder Model 656 from Gatan) followed by ion beam milling (PIPS Model 691 from Gatan) were used on the opposite face to obtain a sample thickness that would be transparent to high energy electrons. Corrosion tests were carried in 0.1M NaCl at 25°C using the PPT method [9]. It consists in applying a potential of 1 V vs. SCE for 3 s and then a potential of 0 V vs. SCE (passive behaviour) for 2 s (30 cycles). The specimen surface was cleaned in ethanol under ultrasonics and the zone of interest was observed by optical microscopy. Surface defects existing before machining were identified before the PPT test. 3. Results and discussion 3.1. Microstructural changes in MMS after machining EBSD analysis was first performed on Sample #1 (no observable deformation). The IPF map (Fig. 1(a)) does not reveal any preferential orientation and any grain refinement in the close vicinity of the machined surface. By contrast, the
333
S. Bissey-Breton et al. / Procedia CIRP 46 (2016) 331 – 335
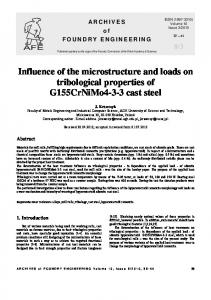
GOS/KAM maps (Fig. 1(b)) show that the density of grain sub-boundaries is significantly increased in a thin volume close to the surface. The thickness of the affected sublayer was estimated to 2 µm. It can also be observed that some grains emerging at the surface are defined by an extremely high value of the GOS (values greater than 10°, corresponding to yellow, orange and red grains in Fig. 1(b)). These grains contain a high density of dislocations. By comparison, the GOS of grains in the bulk does not exceed 10° (green and blue grains in Fig. 1(b)). Although no observable deformation was observed (soft machining conditions), microstructural changes occur near the surface during machining. The Vickers hardness was then determined on the machined surface. The penetration depth of the indenter was first calculated from geometrical considerations. It was estimated to 1.2 µm. The penetration depth is then roughly twice lower than the thickness of the affected layer (of about 2 µm). The hardness values derived from these measurements were then representative of the affected sublayer. A hardness value of 423r10 HV0.01 was found (instead of 390r10 HV0.01 in the bulk). The slight increase of hardness in the sublayer is mainly attributed to the increase of the grain sub-boundaries observed by means of EBSD (Fig. 1(b)). These results show that even though no deformation was observed by optical microscopy (soft machining conditions with the lowest value of f) microstructural changes may occur. Previous results [8] indicate that the increase of hardness induces a decrease of the pitting potential of the machined surface. EBSD analysis of Sample #2 (severe observable deformation) shows that the martensite laths are highly elongated in the direction of machining (Fig. 2). A very fine microstructure with a high density of grain boundaries is then present near the surface. The thickness of the affected sublayer is at least 10 µm. The quality of EBSD maps was lower than in the previous case, confirming that large deformation occurred. The hardness value obtained on this machined surface was 498r10 HV0.01. This value is significantly greater than that measured on Sample #1 and in the bulk. It was associated with the grain refinement observable in Fig. 2. The presence of ferrite islands in the sublayer affects significantly the deformation process. Upstream of the island, laths are highly elongated (site A in Fig. 3(a)). When the thickness of the affected sublayer between the machined surface and the ferrite island becomes very low, laths are destroyed. Grains with a globular shape and an equivalent diameter in the sub-micrometer range are then formed (Fig. 3(b)). This indicates that strain concentrations certainly exist at this location during machining. Downstream of the ferrite island, laths are not highly elongated (site B in Fig. 3(a)). It seems that the ferrite undergoes deformation instead of laths. Indeed, numerous grain sub-boundaries are formed in the ferrite and orientation gradients developed (Fig. 3(a)-(b)). These results show that severe machining conditions can lead to significant microstructural changes and significant increase of the hardness. Note that DSC results (not shown here) demonstrate that no phase transformation occurs during machining of MSS (under these selected conditions). The
corrosion resistance of the machined surface is then significantly decreased [8]. TEM investigations were then performed in the bulk (no machining) and in Sample #2, as shown in Fig. 4(a) and 4(b) respectively. In both cases, the width of 50 laths was measured. In the bulk, the width of laths extends from 0.4 µm over several micrometers. By contrast, the width of laths in Sample #2 is in the range of 40-600 nm (Fig. 5). The average width is 0.24 µm. Therefore, TEM results confirm that significantly elongation of laths occurred during machining. machined surface (a)
10 µm (b)
limit of the affected layer 10 µm
Fig. 1. EBSD analysis of sample #1: (a) inverse pole figure (IPF) map and (b) grain orientation spread (GOS) and Kernel average misorientation (KAM) maps
machined surface
5 µm Fig. 2. EBSD analysis of sample #2: inverse pole figure (IPF) map
Machining performed with the lowest value of f or the intermediary value of f and the lowest value of Vc yields the formation of grain sub-boundaries in a 2 µm-thick sublayer and a slight increase of the hardness. By contrast, machining performed with the highest value of f yields microstructure refinement in a thick sublayer (thickness of about 10 µm) and significant increase of hardness. So we can affirm that the feed rate f has an important impact on the microstructure of the final workpiece, and as a consequence on the corrosion behavior of the machined surface. 3.2. Corrosion behaviour of machined samples After PPT, optical images of the specimen surface were recorded using a Nikon Eclipse LV150A upright metallurgical
334
S. Bissey-Breton et al. / Procedia CIRP 46 (2016) 331 – 335
microscope. These optical images were then assembled to produce a two-dimensional reconstruction of the machined surface. Obtained pictures were treated using the Photoshop software package. The distribution of the pit surface areas at the mouth was then determined for the two samples (Fig. 6). machined surface (a) site A site B
15 µm (b)
The pit surface area is the range of 30-240 µm2 for Sample #1 (Fig. 6(a)) and 20-560 µm2 for Sample #2 (Fig. 6(b)). Pits can be significantly larger in Sample #2 (machined with the highest value of f). The average values of the pit surface area are reported in Table 1. These values are compared to that obtained for the bulk material (no machining) which was previously polished using diamond pastes (down to 1 µm). Formation of numerous grain sub-boundaries (Sample #1) yields to slight increase of this parameter (increase of about 50% vs. the bulk material). By contrast, the microstructure refinement observed in Sample #2 yields to huge increase of this parameter, of about 260% vs. the bulk material. Therefore machining conditions (even for low values of f and Vc) affect significantly the average pit surface area. The average pit density is also reported in Table 1. Roughly the same value was found for both machined samples. This shows that the average pit density is not affected by machining conditions. It can also be seen that this parameter is significantly lower after machining than on the bulk material. The difference is of about 80%. This may be explained by the fact that machined surfaces may be under compression. It is well known that compressive stresses have beneficial effects on pitting corrosion. 12
Fig. 3. EBSD analysis of sample #2: (a-b) inverse pole figure (IPF) map in a site containing a ferrite island
Number of pits
10
(a) Sample#1
8 6 4 2
(a)
(b)
0 0
30
60
90
120
150
180
210
240
Pit surface area at the mouth (µm²) 8
500 nm
Number of pits
7
400 nm
6
(b) Sample#2
5 4 3 2 1
Fig. 4. TEM images of the low carbon martensitic stainless steel: (a) no machining (in
0 0
the dark field mode) and (b) Sample #2 (in the bright field mode)
35
70
105 140 175 210 245 280 315 350 385 420 455 490 525 560
Pit surface area at the mouth (µm²)
12 Fig. 6. Distribution of the Pit surface area for : (a) Sample #1 and (b) Sample #2
Table1. Numerical values derived from PPT test
8 6
Sample #1 Sample #2 Bulk material
4 2
Average pit surface area (µm2)
Average pit density (pit/mm2)
94 224 62
15 13 67
4. Conclusions Width (nm) Fig. 5. Width of laths vs. number of laths in Sample #2
600
560
520
480
440
400
360
320
280
240
200
160
80
120
0
0 40
Number of laths
10
Microstructural changes were found in MMS after machining: formation of grain sub-boundaries in a thin affected sublayer for soft machining conditions "lowest value of f" and refinement of the microstructure for severe machining conditions "highest value of f".
S. Bissey-Breton et al. / Procedia CIRP 46 (2016) 331 – 335
In both cases, the hardness was significantly increased. The highest values of hardness was found when the microstructure refinement occurs. The corrosion behaviour of the surface was also affected by machining. The average pit density is not affected by machining conditions. By contrast, the microstructure refinement (highest value of f) yields to a huge increase of the average pit surface area. These results show that machining conditions play a significant role in the surface integrity and corrosion behaviour of MMS. 5. Acknowledgments The authors would like to acknowledge the Conseil Régional de Bourgogne (France) for its financial support and people from CEA for their contribution to this work through DSC experiments or help in modelling. 6. References [1] Gökkaya, H., Nalbant, M., 2007. The effects of cutting tool geometry and processing parameters on the surface roughness of AISI 1030 steel, Materials and Design, 28, p. 717. [2] M’Saoubi, R., Outeiro, J.C., Changeux, B., Lebrun, J.L., Morão Dias, M., 1999. Residual stress analysis in orthogonal machining of standard and resulfurized AISI 316L steels, Journal of Materials Processing Technology, 96, p. 225. [3] Javidi, A., Rieger, U., Eichlseder, W., 2008. The effect of machining on the surface integrity and fatigue life, International Journal of Fatigue, 30, p. 2050. [4] Ihara, R., Katsuyama, J., Onizawa, K., Hashimoto, T., Mikami, Y., Mochizuki, M., 2011. Prediction of residual stress distributions due to surface machining and welding and crack growth simulation under residual stress distribution, Nuclear Engineering and Design, 241, p. 1335. [5] Gravier, J., Vignal, V., Bissey-Breton, S., 2012. Influence of residual stress, surface roughness and crystallographic texture induced by machining on the corrosion behaviour of copper in salt-fog atmosphere, Corrosion Science, 61, p.162. [6] Gravier, J., Vignal, V., Bissey-Breton, S., Farre, J., 2008. The use of linear regression methods and Pearson’s correlation matrix to identify mechanical-physicalchemical parameters controlling the micro-electrochemical behaviour of machined copper, Corrosion Science, 50, p. 2885. [7] Thamizhmanii, S., Bin Omar, B., Saparudin, S., Hasan, S., 2008. Surface roughness analyses on hard martensitic stainless steel by turning, Journal of Achievements in Materials and Manufacturing Engineering, 26, p. 139. [8] Vignal, V., Bissey-Breton, S., Coudert, J.B., 2014. Mechanical properties and corrosion behaviour of low carbon martensitic stainless steel after machining, International Journal of Machining and Machinability of Materials, 15, p. 36. [9] Vignal, V., Richoux, V., Suzon, E., Thiebaut, S., Tabaleiv, K., 2015. The use of potentiostatic pulse testing to study the corrosion behaviour of welded stainless steels in sodium chloride solution, Materials and Design, 88, p. 186.
335