917
Materials Sciences and Application, 2011, 2, 917-921 doi:10.4236/msa.2011.27122 Published Online July 2011 (http://www.SciRP.org/journal/msa)
Influence of S Contents on the Hydrogen Blistering and Hydrogen Induced Cracking of A350LF2 Steel Shuqi Zheng*, Changfeng Chen, Liqiang Chen Department of Materials Science and Engineering, China University of Petroleum-Beijing, Beijing, China. Email: *
[email protected] Received March 25th, 2011; revised April 20th, 2011; accepted May 3rd, 2011.
ABSTRACT In the present work, the effects of chemical compositions on the hydrogen blistering and hydrogen induced cracking of A350LF2 steel with different S contents were studied. Four types of A350LF2 steels were evaluated by immersing samples in H2S-saturated NACE solution. The hydrogen blistering, crack length rate(CLR), crack thickness rate(CTR) and crack sensitivity rate(CSR) were evaluated. The results show that there are many hydrogen blisters on the sample surface with S content of 0.021%, a few on the sample surface with S content of 0.019% and 0.012% and no one on the surface with S content of 0.002%. There were 12, 2 and 1 strips of cracks of longer than 0.3 mm on the evaluated cross sections with S content of 0.021%, 0.019% and 0.012%, respectively. There was no any crack in the sample with 0.002% S. The corrosion rate was also evaluated. The S content has no obvious influence on the corrosion rate. Keywords: A350LF2, S Content, Hydrogen Blistering, Hydrogen Induced Cracking
1. Introduction At present, more than four hundred sour oil and gas fields containing hydrogen sulfide (H2S) have been discovered in the world, in which the hydrogen sulfide content vary greatly from micro-content H2S to above 92% [1]. For exploitation and transportation of oil and gas which contain hydrogen sulfide (H2S) safely, the choice of oilfield equipments and pipeline steels is strict due to mechanical and corrosion problems induced by hydrogen permeation. When oilfield equipments are exposed to wet hydrogen sulfide environment, hydrogen atoms are produced by the surface corrosion of the steel. In the presence of hydrogen sulfide, recombination reaction of hydrogen atoms to the molecular hydrogen is retarded, consequently allowing, hydrogen atoms to diffuse into the steel. These atoms can move rapidly either by diffusion or by transportation through mobile line defects [2], diffused hydrogen atoms are trapped in sensitive metallurgical defects such as the interface between non-metallic inclusion and steel matrix. Cracking can occur if the critical amount of hydrogen necessary for crack initiation is accumulated [3,4]. According to the different formation of the crack, it is divided into three main types, such as hydrogen induced cracking (HIC), sulfide stress cracking (SSC) Copyright © 2011 SciRes.
and Hydrogen blistering (HB). HIC and HB can result in premature failure of equipment. Some researchers believe HIC and HB are caused by inclusion distribution, especially by the elongated MnS inclusion distribution [5,6]. But the relationship between chemical compositions, especially the S content and cracking sensitivity has not been studied systematically in A350LF2 steels and the influence of S content on the corrosion rate is not very clear. In this paper, the effects of chemical compositions of four types of A350LF2 steels with different sulfur content on cracking and corrosion rate are investigated.
2. Experimental Procedures 2.1. Specimens and HIC Test The materials used in the test were A350LF2 flange steels with different S contents of 0.021%, 0.019%, 0.012% and 0.0002%, respectively. The testing of the steels’ resistance to HIC were performed in NACE solution A (5% NaCl plus 0.5% acetic acid solution saturated with H2S) at 25˚C for 96 h according to NACE TM0284 -2003 standard [7]. Three specimens (100 mm× 20 mm× 30 mm) were tested for each flange. Before the HIC test, the surfaces were ground with SiC abrasive paper down to 800 mesh. After exposure, all immersed specimens were cut and MSA
918
Influence of S Contents on the Hydrogen Blistering and Hydrogen Induced Cracking of A350LF2 Steel
polished and then the cross-sections were examined with 100X optical microscope (OM) after etched with solution of a mixture of 4% nitric acid and ethanol. Three different cracking parameters were measured: Crack Length Ratio (CLR) = a/W × 100%
(1)
Crack Thickness Ratio (CTR) = b/T × 100%
(2)
(a)
(b)
Crack Sensitivity Ratio (CSR) = (a × b)/(W × T) × 100% (3) where a is the crack length, b is the crack thickness, W is the section width and T is the test specimen thickness.
2.2. H2S Corrosion Rate Test Corrosion tests were carried out in the H2S corrosion experimental device following the NACE Standard TM-0284-2003. The size of corrosion rate sample is 50 mm × 10 mm × 3 mm. Before the test, the surface of the test specimens were polished with grit silicon carbide papers progressively up to 800 grade, then degreased with acetone and rinsed with absolute alcohol, weighted using a precision of 0.001 mg, and finally stored in desiccators for use. Before experiment, the sealed test vessel was deoxygenated with nitrogen for at least 6 hours. Purging began immediately after the test vessel was filled and was done at a rate of at least 100 ml per minute, per liter of test solution. After purging, H2S gas was be bubbled through the test solution. The rate of bubbling was at least 200 ml per minute, per liter of test solution for the first 60 minutes. Thereafter, a positive pressure of H 2 S gas was maintained which controlled by the flowmeter. After 168 hours’ corrosion, the samples were removed from the solution and rinsed with deionized water. The samples were descaled (the solution: 1 L HCl (ρ = 1.19 g/L), 20 g Sb2O3 and 50 g SnCl2), rinsed with water and absolute alcohol, dried in nature state and weighted again with a precision of 0.001 mg. The corrosion rate was represented by corrosion depth (mm)/corrosion time (per year), i.e. mm/a. The corrosion morphologies were observed by means of scanning electronic microscopy.
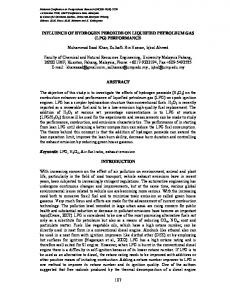
3. Results and Discussion The surface morphologies of the flange samples after 96 hours’ exposure in NACE A solution are shown in Figure 1. From the figure, we found that the sensitivity to hydrogen blistering for four types of samples is far different. It is known from the previous research that the S concentration is the most important factor of improving HIC resistance in low alloy steel. Many HBs were observed uniformly distributed on the sample surface with S concentration of 0.021% (Figure 1(a)). More than 316 hydrogen blisters was counted on the observed surfaces of a group of samples which were composed of 3 specimens by the naked eye observation. The area of hydroCopyright © 2011 SciRes.
(c)
(d)
Figure 1. The hydrogen blistering on the sample surfaces with different S concentration after HIC test (a) 0.021% S; (b) 0.019% S; (c) 0.012% S; (d) 0.002% S.
gen blisters was about 8.9% of surface area. There were 61 hydrogen blisters with the diameter of bigger than 1 mm. By comparison, the amount of hydrogen blisters on the sample surface with S concentration of 0.019% decreased obviously with 37 HBs on the observed surface and about 1.2% sample surface area was occupied by HBs. There were 26 HBs with the diameter of more than 1 mm. But HBs were not observed uniformly distributed on the sample surface but most HBs were located on one sample surface. There were only 3 HBs on the observed surface with S concentration of 0.012% and the HBs area rate was less than 0.1% of the observed sample surface area. However, no HB was found on the surface with S concentration of 0.002%. So we can draw the conclusion that the hydrogen blisters depend on the S content of A350LF2 steel. When the S concentration is more than 0.02%, the amount and area of HB increased obviously while when the S content is less than 0.02%, the amount and area of HB decreased obviously, and when the S content tends to 0.002%, no HB was observed on the sample surface. To study the HB, One of hydrogen blisters was torn off. The scanning electronics microscopy (SEM) of the HB bottom was shown in Figure 2. It was shown that there were many inclusions at the bottom of HB. It indicates that the nucleation site of a HB is just in the position of inclusion. In the HIC test, Since H2S,a hydrogen promotor, acts as a catalytic poison, just a small part of hydrogen recombines or associates on the surface and then bubbles off, yet most hydrogen atoms penetrate into specimens, but that isn’t enough to induce hydrogen pressure. Only in the hydrogen-cavity or micro-cracks can the hydrogen atoms combine into hydrogen molecules whose aggregation can form hydrogen pressure. The hydrogen formed here ultimately can not bubble off. MSA
Influence of S Contents on the Hydrogen Blistering and Hydrogen Induced Cracking of A350LF2 Steel
(a)
Figure 2. SEM morphology of the bottom of a hydrogen blister.
Owing to this, the hydrogen pressure increases and when the partial pressure exceeds the strength of the material, hydrogen blistering occurs. Hydrogen absorbed from the solution diffuses in the metal and then recombines as hydrogen molecules at trap sites in the steel matrix (favorable trap sites are typically found in rolled products along elongated inclusions or segregated bands of microstructure). High hydrogen pressure increases along with the initiation of cracks. As more hydrogen enters the voids, the pressure rises, deforming the surrounding steel so that blisters may become visible on the surface. The steel around the crack becomes highly strained and this can cause linking of adjacent cracks to form stepwise cracking. After testing, each test specimen was sectioned according to NACE TM 0284-2003 and the cross section surfaces were examined. Each section was polished metallographically and etched so that cracks can be distinguished from small inclusions, laminations, scratches, or other discontinuities. In measuring crack length and thickness, cracks separated within the distance of less than 0.5 mm were considered a single crack. The crack morphologies of different types of specimens were shown in Figure 3. Figures 3(a) and (b) are the typical cracks observed on each section surface of the samples with S concentration of 0.021%. We found that some cracks were very long while some were very short. The stepwise propagation of HIC, also known as stepwise cracking, is shown in Figure 3(a) which were connected by some cracks on different layers. There were also many discontinuous cracks and the cracks assumed in different directions. There were about 12 cracks which were longer than 0.3 mm on all observed section faces. Figure 3(c) is the typical crack character of the sample with S content of 0.019%. The crack morphologies were the same as those of the sample with S content of 0.021%. There were 2 cracks which were longer than 0.3 mm and 9 cracks longer than 0.15 mm. In comparison there were only some very short cracks Copyright © 2011 SciRes.
(c)
919
(b)
(d)
Figure 3. The typical hydrogen induced cracks in the cross section of A350LF2 flange with different S contents (a)(b) 0.021%; (c) 0.019%; (d) 0.012%.
observed in the sample with S content of 0.012% (Figure 3(d)), and no crack was found in the sample with S content of 0.002%. So, the amount and length of cracks has a dependence on S content of the samples. According to Equations (1), (2) and (3), the value of CLR, CTR and CSR for each sample are calculated. The CLR value less than 15% was adopted as an acceptance criterion of HIC test according to ISO 15156.2 [8]. There are some other acceptance criterions of HIC quality which lie on the served environments and the materials users [9]. It was found that only CLR of flange 1 exceeded 15% and the other 3 flanges can also be accepted. But with the exploration and exploitation of oil and gas fields containing high partial pressure H2S, disasters happen sometimes. In order to avoid the occurrence of disaster, the stricter acceptance criterions were required. So the endeavor to improve the HIC resistance of flange is one of urgent affairs for materials researchers. The values of CLR, CTR and CSR of different flanges were shown in Figure 4. Figure 4(a) shows the CLR value of four types of flanges. It was shown that there is obvious difference between S content more than 0.02% and less than 0.02%. And we also found that for one flange samples, the values of each section were also different. This is the reason why at least 3 samples requested for HIC test. The plot of average values of CTR and CSR of different samples were shown in Figures 4(b) and (c). The same tendency was found for CTR and CSR. So the flange with more than 0.02% of S content should better not be used in wet H2S environment, the flange with S content from 0.01% to 0.02% should better be used in less severe environment, and in the severe environments S content of the flange should be controlled less than 0.01%. Figure 5 shows the average corrosion rates (CR) of different flange samples after 168 hours’ exposure in saturated NACE A solution. The result from Figure 5 indicates that the average corrosion rates are about 0.8mm/a for each sample with different S contents, MSA
Influence of S Contents on the Hydrogen Blistering and Hydrogen Induced Cracking of A350LF2 Steel
20
Sample 1 Sample 2 Sample 3
1.0
CLR (%)
15 long crack
no crack
short crack
10
5
Corrosion Rate(mm/a)
920
0.8
0.6
0.4
0.2 0 0.000
0.005
0.010
0.015
0.020
S content (wt%)
0.0 0.000
(a)
0.005
0.010
0.015
0.020
S content (wt%)
Figure 5. The corrosion rate of the specimens with different S content.
1.75 1.50
long crack no crack
short crack
CTR (%)
1.25 1.00 0.75 0.50 0.25 0.00 0.000
0.005
0.010
0.015
0.020
S content (wt%)
(b) 0.14
(a)
0.12
long crack
CSR (%)
0.10 0.08
short crack
no crack
0.06 0.04 0.02 0.00 0.000
0.005
0.010
0.015
0.020
S content (wt%)
(c)
Figure 4. CLR, CTR and CSR of the A350LF2 flanges with different S content.
which means that the corrosion rate has not an obvious relation with the S content of flanges. Figure 6 shows the morphologies of the scale formed on different flange samples. It is found that they are all covered with a layer of corrosion film on the sample surfaces. The EDS results confirm that the key component is iron sulfide. By comparison, it is discovered that there are no large differences between the corrosion products on the surfaces of the samples with different S content, which proves that S content has slight effect on the corrosion film and corrosion rate.
4. Conclusions The effect of chemical compositions of four types of Copyright © 2011 SciRes.
(b)
(c)
Figure 6. The morphologies of corrosion scales formed on the flange samples with different S content. (a) 0.021%; (b) 0.019%; (c) 0.002%.
MSA
Influence of S Contents on the Hydrogen Blistering and Hydrogen Induced Cracking of A350LF2 Steel
A350LF2 steels with different S content on cracking and corrosion rate has been carried out. The results are summarized as follows: 1) The chemical compositions of A350LF2 flange steel, especially S content have a strong impact on the hydrogen blistering and hydrogen induced cracking; 2) As for A350LF2 flange steel, with the rise of S content, the sensitivity to the hydrogen blistering and hydrogen induced cracking gradually increases. When the S content is more than 0.02%, the hydrogen blistering and hydrogen induced cracking are far beyond the standard; 3) The corrosion rate of A350LF2 steel is less affected by S content.
5. Acknowledgements This work was financially supported by the following funds:) the Scientific Research Fund for Returned Overseas Chinese Scholar from Education Ministry of China (No. 2008-890);) the Natural Science Foundation of China (No. 50871122)
REFERENCES [1]
G. Y. Zhu, J. X. Dai and S. C. Zhang, “Generation Mechanism and Distribution Characters of Hydrogen Sulfide Bearing Gas in China,” Natural Gas Geoscience, Vol. 15, No. 2, 2004, pp. 166-171
[2]
P. J. Ferreira, I. M. Robertson and H. K. Birnbaum, “Hydrogen Effects on the Character of Dislocations in High-Purity Aluminum,” Acta Materialia, Vol. 47, No. 10, 1999, pp. 2991-2998.
Copyright © 2011 SciRes.
921
doi:10.1016/S1359-6454(99)00156-1 [3]
G. T. Park, S. U. Koh, H. G. Jung and K. Y. Kim, “Effect of Microstructure on the Hydrogen Rapping Efficiency and Hydrogen Induced Cracking of Pipeline Steel,” Corrosion Science, Vol. 50, No. 7, 2008, pp. 1865-1871. doi:10.1016/j.corsci.2008.03.007
[4]
W. K. Kim, S. U. Koh, B. Y. Yang and K. Y. Kim, “Effect of Environmental and Metallurgical Factors on Hydrogen Induced Cracking of HSLA Steels,” Corrosion Science, Vol. 50, No. 12, 2008, pp. 3336-3342. doi:10.1016/j.corsci.2008.09.030
[5]
T. Hara, H. Asahi and H. Ogawa, “Conditions of Hydrogen-Induced Corrosion Occurrence of X65 Grade Line Pipe Steels in Sour Environments,” Corrosion, Vol. 60, No. 12, 2004, pp. 1113-1121. doi:10.5006/1.3299225
[6]
M. A. Lucio-Garcia, J. G. Gonzalez-Rodriguez and M. Casales, “Effect of Heat Treatment on H2S Corrosion of a Micro-Alloyed C-Mn Steel,” Corrosion Science, Vol. 51, No. 10, 2009, pp. 2380-2386. doi:10.1016/j.corsci.2009.06.022
[7]
NACE standard TM0284-03, “Evaluation of Pipeline and Pressure Vessel Steels for Resistance to Hydrogen-Induced Cracking,” NACE International, Huston.
[8]
International standard ISO 15156-2:2003, Petroleum and Natural Gas Industries. Materials for Use in H2S-Containing Environments in Oil and Gas Production -Part 2: Cracking-Resistant Carbon and Low Alloy Steels, and the Use of Cast Irons.
[9]
N. Loukachenko, P. Bourges, K. E. Orie, C. Chauvy and L. Coudreuse, “Recent Experience on Sour Service Resistant Steels Behavior,” NACE Corrosion 2009, Paper No. 09352.
MSA