Journal of Experimental Psychology: Learning, Memory, and Cognition 1999, Vol. 25, No. 2,428-446
Copyright 1999 by the American Psychological Association, Inc. 0278-7393/99/S3.00
Information Presentation Constraints and the Adaptive Decision Maker Hypothesis Stuart M. Senter and Douglas H. Wedell University of South Carolina Participants examined sets of apartments described along 4 dimensions. Attribute values were manipulated to provide a way to infer strategy from response patterns. Experiment 1 established baseline behavior in unconstrained search, whereas Experiments 2-4 constrained participants to search either by alternative or by dimension. Dimensionwise presentation resulted in higher accuracy and reduced looking times. In 3-alternative choice, mere was no evidence that strategy use depended on constraint condition. Evidence for possible strategy differences across constraint conditions was found when either multiple judgments rather than a single choice had to be made or the number of alternatives was increased to 5. These results supported features of the adaptive decision maker hypothesis (J. W. Payne, J. R. Bettman, & E. J. Johnson, 1988) but suggested that strategy use is not always strongly linked to acquisition pattern.
There is clear evidence for the contingent nature of human decision making. Process tracing research has demonstrated that decision makers flexibly alter their information acquisition behavior when features of the choice set or characteristics of the task change (Ford, Schmitt, Schechtman, Hults, & Doherty, 1989; Payne, 1982). For example, as task complexity is increased by increasing the number of alternatives or attributes, decision makers shift to a more dimensionwise pattern of acquisition in which they initially examine multiple alternatives along a given dimension rather than examine a given alternative across multiple dimensions (Payne, 1976; Payne & Braunstein, 1978). Such changes in overt information acquisition patterns are generally assumed to reflect important changes in the strategies used to process the information. For example, an initial dimensionwise examination of alternatives may correspond to an editing or screening phase in which poor alternatives are eliminated from further consideration (Beach, 1993; Russo & Leclerc, 1994; Wedell & Senter, 1997). More generally, a variety of different decision strategies have been linked closely to particular patterns of alternativewise or dimensionwise information acquisition so that changes in acquisition pattern suggest changes in strategy (Bettman, Johnson, & Payne, 1990; Payne, Bettman, & Johnson, 1988; Svenson, 1979). One approach to understanding the contingent nature of decision making behavior is that such changes reflect a
tendency by human decision makers to efficiently adapt to the current decision environment. This approach, put forth by Payne, Bettman, and Johnson (1993), has been labeled the adaptive decision maker hypothesis. Contingent decision behavior can be considered adaptive insofar as individuals effectively alter their information acquisition behavior in response to stimulus and task factors while continuing to make good choices. According to the adaptive decision maker hypothesis, individuals have a wide variety of strategies that they can implement in any given situation. The strategy chosen depends on the costs and benefits associated with implementing the strategy, with costs often measured in terms of effort and benefits in terms of accuracy. Because decision makers have limited cognitive resources (Simon, 1955), they attempt to use a strategy that is low in effort while maintaining relatively high accuracy. For example, the shift to more dimensionwise acquisition patterns with an increase in complexity of the choice set may be interpreted as reflecting the implementation of strategies that reduce effort by screening out poor alternatives and thereby maintain high accuracy. Although the adaptive decision maker interpretation of the switch to dimensionwise acquisition patterns in the face of task complexity is appealing, it is largely based on correlational evidence. Our approach in the present research was to test this interpretation experimentally by directly manipulating the order in which information was acquired in a complex task. If dimensionwise acquisition of information in complex decision environments is truly adaptive, then we would expect to find that those individuals who are forced to view information in a dimensionwise fashion in this task should have an advantage in processing that information over those forced to view it in an alternativewise manner. Thus, the adaptive decision maker interpretation of previous data implies that dimensionwise acquisition should be either more accurate, less effortful, or both. Clearly, if we find that alternativewise presentation of complex information leads to higher accuracy with less effort, then the adaptive decision
Stuart M. Senter and Douglas H. Wedell, Department of Psychology, University of South Carolina. This research was conducted under National Science Foundation Grant SBR-9319520. The first two experiments were part of Stuart M. Senter's master's thesis. Correspondence concerning this article should be addressed to Stuart M. Senter, Department of Psychology, University of South Carolina, Columbia, South Carolina 29208. Electronic mail may be sent to
[email protected]. 428
429
INFORMATION PRESENTATION CONSTRAINTS
maker interpretation of the switch to dimensionwise acquisition would be in jeopardy. In addition to a general test of the adaptive decision maker hypothesis, we believe the design of our experiments enables specific tests of the mechanisms by which decision makers may adapt. For example, the typical interpretation of switching the pattern of acquisition in the face of task complexity is that such switches reflect a change in strategy. This interpretation is based on the assumption that pattern of acquisition is closely tied to decision strategies, which has received some support (Bettman et al., 1990). However, it is also possible that changes in the pattern of acquisition do not reflect changes in strategy per se, but rather they may reflect changes in the ease and accuracy with which the same strategy can be implemented. For example, one may use the classic weighted additive rule to make a decision by evaluating and weighting each attribute of an alternative, then summing these to determine the overall utility of the alternative and choosing the alternative with the highest overall utility. This strategy is assumed to proceed in an alternativewise fashion, in which each attribute of a given alternative is examined before proceeding to the next alternative. However, it is entirely possible to implement this strategy using a dimensionwise pattern of information acquisition. Presumably, a dimensionwise implementation of this strategy has the added mental cost of keeping track of more information in memory, which may also lead to a reduction in the accuracy of choices. Thus, shifts in the acquisition pattern may reflect shifts in the implementation of a strategy without the strategy itself changing. Research has supported the hypothesis that presenting information by attributes leads to a different memory representation than presenting information by alternatives (Cafferty, DeNisi, & Williams, 1986; Srall, 1983). Different information acquisition patterns may then lead to different mental representations of the information that facilitate the use of certain strategies, but they may not necessarily reflect the use of different strategies. Overview In this article, we describe four experiments that addressed issues related to the adaptive decision maker hypothesis. In all four experiments, participants evaluated or made choices among sets of apartments described along four dimensions. Experiment 1 differed from the other experiments in that participants were free to access information repeatedly in whatever order they liked. As such, it served as a baseline to which results from the other experiments could be compared. A shared feature of Experiments 2-A was that participants were constrained to view information either by dimension or by alternative. Our focus in these experiments was to determine the extent to which this extreme difference in the pattern of acquisition would affect performance, as measured by relative accuracy and information acquisition time, and also to determine the extent of different strategy use across conditions. In Experiment 2, participants viewed each piece of information only once before proceeding to the
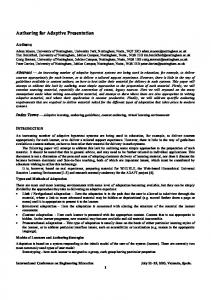
next. Experiment 3 used the same materials as Experiments 1 and 2 but had participants render multiple judgments rather than a single choice on each trial. The switch to a judgment task was designed to create conditions that we believed would lead to very different strategies being used in the two constraint conditions. Finally, Experiment 4 increased the complexity of the choice task by including two additional alternatives on each trial. We hypothesized that this further increase in complexity would increase demands on cognitive resources and thereby lead to the use of different strategies across constraint conditions. In introducing Experiment 1, we develop several ideas that will apply to all four experiments. Key among these is how we infer choice strategies from the pattern of choice accuracy. By using a measure of strategy that is not based on acquisition pattern, we can explore how strategies may be the same or different across acquisition patterns. Strategy for Analysis For each of the four experiments, analyses of variance (ANOVAs) were conducted on a measure of choice accuracy. We also examined looking time as a function of presentation order. Because process tracing experiments produce an enormous amount of data, complete presentation of results can distract from the major foci of the experiments. We have streamlined our presentation of the data to focus on those analyses that are most directly related to our specific hypotheses. After describing the four experiments, we include a section that summarizes supplemental analyses across the set of experiments, providing a fuller picture of the process tracing data and how it relates to some auxiliary hypotheses. The first section of these analyses focuses on individual differences in strategy use by isolating different strategy groups on the basis of choice accuracy patterns. The next section focuses on the relationship between choice accuracy and set value level that emerged in Experiments 1-4. The third section describes differences in the relationship between choice accuracy and looking time. A fourth section examines how looking times differed across choice sets and alternatives. The Supplemental Analyses section concludes with an examination of how individual differences in working memory map onto the results of Experiment 4. Experiment 1 Experiment 1 served to establish a baseline of performance, exposing participants to the stimulus manipulations free from any sort of presentation constraint. Participants chose from sets of three apartments described along four dimensions. The basic display presented to decision makers is shown in Figure 1. Information was either continually visible on the screen (as shown) or hidden by boxes, in which case the participant uncovered information by guiding a mouse-controlled cursor into a given box. Participants could examine information in any order and as many times as desired. The purpose of the open display in Experiment 1 was to provide a comparison to the case where information
430
SENTER AND WEDELL
was obscured. Process tracing and the constraint paradigms used in this set of studies require that information be covered so that the information acquisition process can be monitored. The purpose of the open condition was to examine whether the inclusion of masking boxes resulted in the use of different strategies by participants. On the basis of previous research that has examined different levels of complexity with respect to the number of dimensions and alternatives in a given situation (Ford et al., 1989; Payne, 1982), the choice task of Experiment 1 was designed to be moderately complex. On a trial by trial basis, participants were faced with processing 12 different pieces of information. Because their goal was to choose the apartment that would be preferred by someone who felt that each of the four dimensions was equally important, participants needed to examine the information extensively to achieve high levels of accuracy. Differences in the average utilities among the three alternatives were slight, increasing the difficulty of the task. We hypothesized that within this complex environment, participants would tend to use dimensionwise heuristic strategies, allowing them to maintain high levels of accuracy without integrating all of the information available on a given trial (Payne et al., 1988). Thus, we predicted that process-tracing measures would reveal participants' preference for dimensionwise acquisition in the decision environment of Experiment 1. The goals of Experiment 1 were threefold. First, we sought to establish that participants could indeed achieve high levels of accuracy in the complex stimulus environment we created. Second, we hoped to show through the use of our stimulus manipulations that the high levels of accuracy were accompanied by the use of dimensionwise strategies. Third, we hoped to show a predominance of dimensionwise acquisition patterns, as reflected by the process-tracing measures. One methodological innovation of the research we present was to include choice sets designed to isolate different Alternativewise
Dimension
A
B
c
1 Rent 1
L$uoJ
[ $200 "|
| $200 I
1
Sqft
[
{ 1160 |
1320
1000
|
Dist
*]
| 12min |
| 18 min]
| 12 min]
CO
EH]
j break ins |
Dimensionwise
Figure 1. Stimulus display used in Experiments 1-3. This information was masked in Experiments 2 and 3 and in the mouse-acquisition condition of Experiment 1. The stimulus set shown here corresponds to the low variability set described in Figure 2. Arrows indicate the direction that information was presented in the alternativewise and dimensionwise conditions. Sqft = square feet; Dist = distance.
Table 1 Values and Matching Stimuli for Experiments 1-4 Dimension Design value 1 2 3 4 5 6 7 8 9
Rated value 3.1 3.6 4.2 4.9 5.5 6.2 6.9 7.3 8.0
Rent ($) 320 300 280 250 230 200 190 170 140
Sqft. 680 720 760 800 960 1,000 1,040 1,160 1,320
Distance (min) 42 39 36 30 24 21 18 12 9
Breakins
14 12 10 8 6 4 3 2 1
Note. Sqft. = square feet; Break-ins = number of forced entries occurring in a 1 -mile radius around the apartment in the last year.
classes of choice strategies. Often in process-tracing studies, strategies are inferred from the pattern of information acquisition (Bettman, 1979; Russo & Rosen, 1975; Payne et al., 1988; Schkade & Johnson, 1989). For example, the use of dimensionwise strategies, such as the lexicographic rule or elimination by aspects, might be represented by a process-tracing record that indicates (a) a greater number of dimensionwise transitions, (b) a small number of acquisitions, and (c) short latencies per acquisition. In contrast, use of alternativewise strategies, such as the weighted additive rule, might correspond to a record indicating (a) a greater number of alternativewise transitions, (b) large numbers of acquisitions, and (c) long times per acquisition. These types of inferences assume a tight linkage between overt information acquisition behavior and decision strategies. However, this linkage has not been tested directly. To do so, one needs a way of inferring strategies independent from the processtracing record. In this research, we used patterns of accuracy across choice sets to infer strategy use. The materials used in these studies are summarized in Table 1. The far left column indicates the design value used in the formation of three alternative stimulus sets, and the second column indicates the corresponding attractiveness rating for each of the nine levels of the four dimensions used. In our experiments, whenever we refer to a design value, the corresponding attribute value from Table 1 was presented. Details of the pilot study producing these values are given in the Method section. The three types of choice sets used in Experiments 1-3 are shown in Figure 2. The key manipulations of choice sets included varying (a) average utility, (b) set value level, (c) variability of values, and (d) existence of dominance. These manipulations were used to target participant strategies on the basis of differential choice behavior across the sets. The average utilities of the alternatives provided the basis for calculating choice accuracy.1 In each stimulus set, there 1
For the purposes of these experiments, the overall utility of a particular alternative is described by the mean of its design values, instead of summed value-weight combinations of attractiveness ratings.
INFORMATION PRESENTATION CONSTRAINTS
High Variability (HV) H M L
Low Variability (LV) H M L
431
to be rejected. In either case, the strategy will fail to select a single best alternative. Two of the sets were designed to examine effects of (D) manipulating the variability of values within Alternative L. Dimension H M L Alternative L in the low variability (LV) set consisted of design values with a range of 2.0 and a standard deviation of Rent 9 6 5 9 6 6 9 6 6 1.0. Alternative L in the high variability (HV) set consisted Square Feet 8 9 5 of design values with a range of 4.0 and a standard deviation 8 9 6 8 9 8 of 2.0. This manipulation was designed to distinguish Distance 8 7 9 8 7 8 8 7 7 between strategies that focus on avoiding alternatives with extremely low values versus those that seek alternatives with 7 8 9 7 8 8 7 8 7 Break-ins extremely high values. The former class of strategies include criterion-based elimination strategies such as satisficing and Mean Utility 8.0 7.5 7.0 8.0 7.5 7.0 8.0 7.5 7.0 elimination by aspects. With these strategies, Alternative L is more likely to be rejected in the HV set than in the LV set, Figure 2. Choice sets used in Experiments 1-3. HV = high due to its extremely low values on some dimensions. variability set; LV = low variability set; D = dominance set; H = Strategies that focus on extremely high values, such as the high alternative; M = middle alternative; L = low alternative. lexicographic and lexicographic semi-order rules (Tversky, 1969), should result in the opposite pattern: More frequent was one alternative with the highest average utility (H), a selection of L in the HV than LV set due to its extremely high middle alternative (M) with a utility 0.5 lower than H, and a values on some dimensions. Thus, strategies such as satisficlow alternative (L) with a utility 1.0 lower than H. The ing and elimination by aspects should result in higher means at the bottom of Figure 2 show the average utilities accuracy in the HV set than in the LV set, whereas strategies for sample stimulus sets assuming equal weighting of such as the lexicographic strategy should result in the dimensions. Following Payne et al. (1988), relative accuracy opposite pattern. was determined by comparing the utility of the selected In the dominance (D) set, Alternative L contained the alternative to the highest utility alternative and the utility of same narrow range of dimensional values {6,7,7,8} as the LV a randomly chosen alternative as follows: set and had a standard deviation of 0.707. Unlike both the HV and LV sets, the third alternative was dominated by both ^choice V,random Alternatives H and M (i.e., H and M had equal or higher Accuracy = (i) values on each dimension than the corresponding value on um Alternative L). Research has indicated that people are where £/choice is the utility of the chosen alternative, UTaBioin is sensitive to dominance and avoid the selection of dominated alternatives (Huber, Payne, & Puto, 1982; Kahneman & the average utility of a randomly selected alternative from Tversky, 1979; Payne et al., 1988; Ratneshwar, Shocker, & the set, and t/maximum is the utility of the highest alternative. Stewart, 1987; Tversky, 1969, 1972; Wedell, 1991). Thus, Application of this formula resulted in a score of 1.0 if an we generally expected to see accuracy increase for the D set individual selected Alternative H, a score of 0.0 if an insofar as people are keying in on dominance. Use of individual selected Alternative M, and a score of -1.0 if an heuristic strategies such as the lexicographic rule and individual selected Alternative L. Random selection from elimination by aspects would lead to avoidance of domiamong the three alternatives would result in an average nated alternatives and hence increased accuracy in the D set. accuracy of 0.0. To help insure the appropriateness of this In summary, sets were designed so that the pattern of approach, instructions emphasized that participants should choice accuracy across sets implied use of different strateweigh the four dimensions equally in making their choices. gies. A weighted additive strategy based on summed utility Set value level was manipulated by presenting each set at would tend to be insensitive to the set manipulation and lead five value levels that ranged from 8.0 down to 4.0 and to similar accuracy levels across sets. Lexicographic stratecorresponded to the average utility of Alternative H. In gies predict highest accuracy in the D set and lowest Figure 2, stimulus sets are at the 8.0 value level. The different set value levels were created by subtracting a fixed accuracy in the HV set. Criterion-based strategies, such as elimination by aspects, predict high accuracy for both D and value from the values shown in Figure 2 (e.g., subtracting 1 HV sets and lowest accuracy in the LV set.2 for Value Level 7, 2 for Value Level 6, etc.). The manipulation of value was included to increase the number of choices making up a condition and also to target criterion-based 2 A program was constructed that simulated the use of different decision strategies that are sensitive to the set value level of decision strategies under the alternativewise and dimensionwise a choice set, such as satisficing (Simon, 1955) and eliminaconstraint conditions upon the three different choice sets. Four tion by aspects (Tversky, 1972). Such strategies imply strategies were implemented under both the alternativewise and poorer accuracy for extreme high and low value sets. This is dimensionwise constraints. The weighted-additive rule, satisficing, because when values are all high, no alternatives are likely lexicographic, and lexicographic semi-order rules were used under to be eliminated for failure to achieve the cutoff level. the former constraint, and elimination by aspects, sequential Similarly, when values are all low, all alternatives are likely elimination, lexicographic, and lexicographic semi-order rules Dominance
432
SENTER AND WEDELL
Method Participants and design. Participants were 91 undergraduates at a southern university who completed the study in exchange for course credit. Each of the three stimulus choice sets was counterbalanced using a Latin square so that the design values across the three alternatives (shown in Figure 2) appeared on each dimension an equal number of times. For example, the row of design values for rent on the HV set {9,6,5) appeared equally often across all dimensions, as did the design values shown on the other three dimensions. This was done to prevent the high or low values on an alternative from always appearing on the same dimension. This counterbalancing resulted in 12 different three-altemative sets for each of the three manipulations at each of the five set value levels. Thus the complete number of choice sets was generated from a 12 (replicates) X 3 (sets) X 5 (set value levels) design for a total of 180 stimulus sets. Alternatives H and M were identical across the three choice sets for each of the 12 replicates. Trials were constructed so participants never saw the same alternative twice in the same session. Therefore, each participant was presented with a total of 60 trials (4 nonidentical replicates X 3 choice sets X 5 set value levels). Stimuli. Design values were determined from a pilot rating task, in which participants (n = 45) were presented an array of 20 values for several apartment dimensions including the four used in the present studies (rent, square footage, distance from work or school, and number of area break-ins). Participants were asked to rate the attractiveness of each dimensional value on a 9-point scale, where 1 = not at all attractive and 9 = very attractive. Mean ratings for each dimension ranged from roughly 3.0 to 8.0. The dimensional values on each of these extremes were taken to represent Design Values 1 and 9, respectively. The values for each dimension with attractiveness ratings closest to each of the eight incremental values of .625 between 3.0 and 8.0 were chosen to represent the corresponding design values between 1 and 9. The means of the rated values are shown in the second column of Table 1. The ratings for the dimensional values do not fall precisely on the incremental values, but were as close as possible using the pretested stimuli. In Experiments 1-4, each alternative was composed of values on the four dimensions, and each dimensional level corresponded to an attractiveness value of one to nine. The average utility for each alternative was calculated by averaging its design values. Procedure. All materials and instructions were presented on an IBM-compatible computer with a pentium processor. Instructions told participants to imagine that they were rental agents and that they would be choosing apartments mat best satisfied the needs of their clients. Detailed descriptions of the four apartment dimensions were provided (rent, square footage, distance from work or school, and area break-ins). Participants were told that their clients felt that each of the four dimensions was equally important, and that they should make their choices with this in mind. On each trial, the three apartments were displayed in columns, with each of the four dimensions in horizontal rows (as shown in Figure 1). For a given trial, the order of dimensions and the order of apartments (H, M, L) on the screen was randomized. In the open condition, no information was masked, and participants simply keyed in their choice (1 for left apartment, 2 for center apartment, 3 for right apartment) when they were ready to do so. In the masked condition all information was concealed by boxes. To open a box,
were used under the dimensionwise constraint. The pattern of accuracy across the three choice sets from each strategy corroborated the accuracy patterns described.
participants simply guided the cursor into the box using the mouse. Only one piece of information could be uncovered at a time, bul participants could return to view information as many times as they liked and in any order. When ready, they clicked above or below an alternative to select it. Throughout their information search, the number of dimensionwise and alternativewise transitions made by participants was tallied and used to compute a ratio reflecting search tendencies (Payne et al., 1988). The number of dimensionwise transitions was subtracted from the number of alternativewise transitions, and this was divided by the total number of transitions. This ratio could range from 1.0 to —1.0, with positive numbers indicating a greater number of altemativewise transitions and negative numbers indicating a greater number of dimensionwise transitions. Each participant was randomly assigned to either the open or mouse-acquisition condition. In each condition, participants were provided with three practice trials to get a feel for the task. Results The looking time and search pattern data for 11 of the 51 participants in the mouse-acquisition condition were lost due to an error in the program compiler. Therefore, the looking and search pattern data for only 40 of the 51 participants in this condition were considered. The accuracy data for all 51 participants in the mouse-acquisition condition were included in this analysis. Figure 3 presents accuracy as a function of condition and choice set for Experiment 1. Overall, accuracy was reasonably high (M = .610). Participants in the open condition were more accurate than participants in the mouseacquisition condition. Following the pattern predicted by use of a lexicographic strategy, accuracy was highest in the D set followed by the LV set and then the HV set. A 2 X 3 (Presentation Condition X Choice Set) repeated measures ANOVA was conducted on the choice accuracy results. The main effect of presentation condition was significant, F(l, 89) = 4.8, MSE = 0.0849, p < .05, reflecting the higher accuracy in the open condition. Accuracy also varied across sets, as reflected in a significant main
LV Choice Set
D
Figure 3. Choice accuracy across task condition and choice set for Experiment 1. HV = high variability set; LV = low variability set; D = dominance set.
433
INFORMATION PRESENTATION CONSTRAINTS
effect of choice set, F(2, 178) = 40.3, MSE = 0.0197, p < .001. Planned comparisons (with a Bonferroni correction) indicated that all pairwise differences in accuracy between sets were significant. The Presentation Condition X Choice Set interaction was not significant, indicative of the same choice patterns for open and mouse-acquisition conditions. A measure of search pattern ratio was computed to measure participants' tendencies to make alternativewise or dimensionwise transitions. This was constructed by subtracting the number of dimensionwise transitions from the number of alternativewise transitions and dividing the difference by the total number of transitions. This measure could range from 1.0 to —1.0, with positive numbers indicating a greater ratio of alternativewise transitions and negative numbers indicating a greater ratio of dimensionwise transitions. A t test conducted on the search pattern ratio indicated that the mean was significantly less than 0.0 (p < .01), reflecting the tendency for participants to implement a greater number of dimensionwise transitions. The mean search pattern ratio (-.125) and accuracy (.575) for the mouse-acquisition task of Experiment 1 were similar to those found by Payne et al. (1988, Study 1) for participants under no time pressure (—.217 and .625, respectively). The correlation between pattern and accuracy was nonsignificant for the full set of 40 participants in the mouse-acquisition condition. However, we note that removal of an apparent outlier whose accuracy was close to zero resulted in a stronger correlation (r = — 34, p < .05), consistent with the idea that dimensionwise acquisition was associated with greater accuracy.
Discussion As anticipated, participants were particularly sensitive to dominance, snowing much greater accuracy for the D set than for the LV set. Participants were also more willing to choose the L alternative in the HV set than in the LV set, suggestive of strategies that focus on the selection of extremely high values rather than the rejection of extremely low values. The general pattern of accuracy across sets was supportive of the use of lexicographic strategies by at least a subset of participants. Alternatively, this finding may be explained in terms of assignment of greater weight to higher values (Shafir, 1993; Skowronski & Carlston, 1987), although in judgment experiments the reverse is usually found (Birnbaum, 1973; Fiske, 1980). Although the open condition did produce significantly more accurate choices than the mouse-acquisition condition, this difference did not appear to be due to the use of different strategies, as there was no Set X Condition interaction for the accuracy data. The open condition may have simply facilitated efficient processing of the alternatives, perhaps through a simpler interface with the materials or a greater tendency to engage the materials thoroughly. More generally, Experiment 1 revealed that participants could achieve high choice accuracy in a complex stimulus environment. Furthermore, the pattern of accuracy across the 'three choice sets was indicative of the use of a lexicographic type strategy. Experiment 1 also established
that participants showed a preference for dimensionwise acquisition. These results thus set the stage for Experiments 2-4, in which we constrained the sequencing of information presentation to examine more directly the links between information acquisition pattern, strategy, accuracy, and effort.
Experiment 2 The dimensionwise acquisition pattern found in Experiment 1 was consistent with the typical findings from computer-based process tracing studies. Only when the number of alternatives and attributes is small is the pattern of acquisition more reflective of alternativewise search (Payne, 1982; Wedell & Senter, 1997). Indeed, several researchers have noted that participants tend to make adaptive shifts to more dimensionwise acquisition patterns in response to such factors as task complexity (Biggs, Bedard, Gaber, & Linsmeier, 1985; Johnson & Meyer, 1984) and time pressure (Payne et al., 1988; Svenson & Maule, 1993). According to the adaptive decision maker hypothesis, participants use dimensionwise strategies in the face of task difficulty to maintain high levels of accuracy and reduce effort expenditure. This interpretation implies that dimensionwise acquisition strategies are more efficient than alternativewise strategies in complex or pressured decision tasks. In Experiment 2, we tested a version of the adaptive decision maker hypothesis that presumes a tight linkage between information acquisition pattern, strategy, effort, and accuracy. If the dimensionwise pattern of acquisition is the cause for the maintenance of high accuracy, then participants constrained to dimensionwise acquisition should have higher accuracy than those constrained to alternativewise acquisition. Furthermore, if processing difficulty is reduced by implementing a dimensionwise acquisition pattern, then those forced to acquire information by dimensions should require less time to maintain a similar degree of accuracy as those forced to acquire information by alternatives. Finally, if observed changes in choice accuracy are due to changes in implementation of strategies dictated by the information acquisition pattern, then constraining participants to process the information by dimension or by alternative should lead to demonstrably different strategy usage. Experiment 2 placed participants under strict constraints, requiring them to view each piece of information only once in either an alternativewise or dimensionwise pattern. For both patterns, participants viewed one piece of information at a time, uncovering each successive piece by pressing the space bar, while the previously viewed piece was simultaneously hidden. In the alternativewise condition, participants viewed each dimensional value on an alternative before moving to examine the next alternative in the same manner. In the dimensionwise condition, values for one dimension across each alternative were viewed before moving to the next dimension. These strict constraints were designed to test the causal link between presentation order and choice accuracy. They also provided the largest potential differences in presentation pattern and therefore should
434
SENTER AND WEDELL
produce the largest differences in strategy use, if strategy is closely tied to information acquisition. This type of strict constraint method of information presentation has not been widely examined. However, Cafferty et al. (1986) did conduct studies that examined the effects of the sequencing of information presentation on evaluation accuracy. These researchers found that evaluation accuracy did not differ between the dimensionwise and alternativewise presentation constraints, which seems inconsistent with a hypothesized tight linkage between sequence of information acquisition, strategy selection and choice accuracy. However, it is often difficult to interpret the null hypothesis. Furthermore, there were many differences between the method of Experiment 2 and that of the Cafferty et al. study (which was primarily concerned with memory representation). These differences included the fact that the Cafferty et al. study required participants to make judgments rather than choices, used only a single trial rather than a series of trials, and included a relatively long delay between information presentation and judgment rather than prompting an immediate response. Therefore, there are several reasons why the null effect of constraints on accuracy found by Cafferty et al. may not generalize to the present study.
Method Participants, 103 undergraduates sampled from the same population as Experiment 1, were randomly assigned to view apartment information in either alternativewise or dimensionwise fashion. The stimulus design was identical to that of Experiment 1. As in Experiment 1, participants were placed in the rental agent scenario. The only difference between Experiments 1 and 2 was the manner of information presentation. In Experiment 2, participants were constrained to view information either by alternative or by dimension. On each trial, participants were presented with a completely masked display. Participants moved from one piece of information to the next by pressing the space bar. As one piece of information was uncovered, the information that was previously viewed was simultaneously hidden. After all of the information had been viewed, the participant was prompted to choose one of the three apartments. Participants in the alternativewise condition viewed each of the four dimensions on one alternative before moving to the next alternative. Participants in the dimensionwise condition viewed one dimension across each of the three apartments before moving to the examine the next dimension. Whenever a piece of information was uncovered, its corresponding dimension label was also uncovered.
Results Figure 4 presents the accuracy data as a function of presentation condition and choice set. Dimensionwise viewing led to higher accuracy than alternativewise viewing. Similar to Experiment 1, participants showed the highest accuracy in the D set, followed by the LV set, and the lowest accuracy in the HV set. The effects of set were parallel for the two presentation conditions, indicative of similar strategy use. A 2 (condition) X 3 (set) ANOVA was conducted on the accuracy data. The main effect of presentation condition was
HV
LV Choice Set
Figure 4. Choice accuracy across task condition and choice set for Experiment 2. HV = high variability set; LV = low variability set; D = dominance set; ALT = alternativewise; DIM = dimensionwise.
significant, F(l, 101) = 12.4, MSE = 0.0782, p < .01, reflecting the higher levels of accuracy in the dimensionwise condition. The main effect of set was significant, F(2, 202) = 47.6, MSE = 0.0229, p < .001, reflecting the same pattern as found in Experiment 1. Planned comparisons conducted on the accuracy for the three choice sets (using a Bonferroni correction) showed that they were all significantly different from each other. It is important to note that the interaction of condition and set did not approach significance (F < 1.0). The effect of condition on accuracy was nearly identical for each of the three sets. Because of the difficulty of making theoretical arguments from null results, a power analysis was conducted to determine our ability to reject the null hypothesis in the case of the interaction. Power was estimated to be greater than .99 for an interaction resulting from the use of the lexicographic strategy by dimensionwise participants and a weighted additive strategy by alternativewise participants.3 The adaptive decision maker hypothesis also leads to the prediction of shorter looking times for dimensionwise participants. Because of the strong positive skewing of these distributions, a Mann-Whitney U test was conducted on the looking times per trial. The difference in median looking times between conditions was significant (p < .05). Consis3
The power analysis was conducted with the expectation that alternativewise participants would use a strategy akin to the weighted additive rule, whereas we expected dimensionwise participants to use the lexicographic rule. Means for the systematic use of both rules were derived using the simulations mentioned in Footnote 2 and the error term was taken from the actual mean square error for the interaction term. One way to conceptualize the expected interaction is that accuracy should not differ across sets for the alternativewise participants, but should show the strong differences found in Experiment 1 for dimensionwise participants. The high power to detect this difference can be readily confirmed by the reader by noting the strong main effects of set in both Experiments 1 and 2 (Fs > 40).
435
INFORMATION PRESENTATION CONSTRAINTS
tent with this prediction, median looking times were longer for alternativewise participants (Mdn =11.8 s) than for dimensionwise participants (Mdn = 10.1 s). This result is in accordance with our prediction based on the idea that dimensionwise acquisition is less effortful, with longer looking times for alternativewise participants and shorter looking times for dimensionwise participants.
Discussion The pattern of accuracy data was quite similar to that found in Experiment 1 under no presentation constraints. Accuracy was higher for the D set than for the LV set, indicating that dominance aids the choice process. Accuracy for the LV set was higher than for the HV set, suggesting the use of lexicographic strategies by at least a large subset of participants. Although the pattern of accuracy across sets was similar between the two experiments, the constraint conditions of Experiment 2 did result in lower overall accuracy (M = .447) than when participants were able to examine information freely (M = .610). The conjunction of the adaptive decision hypothesis and the idea of tight linkages between strategy, information acquisition sequence, accuracy, and effort led to three major predictions. Two of the three predictions were supported by the results of Experiment 2. First, accuracy was greater for those who were forced to view information by dimension rather than by alternative. Second, looking time as a measure of effort was lower for those who were forced to process the information by dimension. These two results are in line with the interpretation of the adaptive decision maker perspective that decision makers use dimensionwise acquisition patterns of information in complex decision environments to increase accuracy, decrease effort, or both. However, the third prediction that strategies would differ between the two presentation conditions was not supported. Use of different strategies should have been reflected in an interaction between presentation condition and choice set for the accuracy data. The lack of an interaction effect therefore provided no support for different strategy use across presentation conditions. Instead, these data are consistent with the idea that alternativewise participants may have been able to implement similar strategies as dimensionwise participants, but at a cost, reflected by lower accuracy and greater effort. One particularly surprising aspect of Experiment 2 was that the advantage of dominance over low variability (D vs. LV) sets was the same across presentation conditions. Dominance cannot be inferred from comparison of overall utilities but instead requires direct comparison of attribute values. Detecting dominance should have been much more difficult for the alternativewise participants, and yet the advantage of including a dominated alternative was just as great for these participants as for those in the dimensionwise condition. This result suggests the capacity for a high degree of mental comparisons. If these types of mental comparisons are prevalent, then the linkage between the sequence of information accessing and strategy implementation may be weaker than is often supposed. Overall, Experiment 2 did not provide evidence for
differential strategy use across presentation conditions. This result is somewhat surprising given the general assumption in the literature of a close link between information acquisition sequence and choice strategy. Naturally, it is difficult to generalize results from a paradigm in which information is constrained to be viewed in a prescribed sequence to studies in which the participant freely explores the information. However, at the very least, these studies showed that under constraint conditions, participants are flexible processors of information and may implement a variety of strategies and engage in mental comparisons among alternatives. Such mental comparisons may come at a cost of reduced accuracy and increased effort when information is presented in an alternativewise fashion, presumably due to a difference in the memory representation. In Experiments 3 and 4, we explored the hypothesis that when resources are taxed, constraint conditions should show maximal effects on the processing of information, including potential shifts in strategies. We used the same materials in Experiment 3 as in Experiments 1 and 2 and attempted to tax resources by changing the task from one in which participants made choices to one in which they rendered judgments. We reasoned that in a judgment task, participants must remember more detailed information and perhaps engage in more difficult integration processes to yield separate values of alternatives on an attractiveness scale. In Experiment 4, we expanded the choice task to include five alternatives rather than three. We reasoned that this twothirds increase in information would make mental comparisons more difficult and hence lead to a reliance on strategies more closely associated with the actual sequencing of the information. Thus, in both Experiments 3 and 4, we expected increased cognitive demands of the task or stimulus set to lead to a breakdown in participants' abilities to make mental comparisons and hence lead to the selection of different strategies in alternativewise and dimensiohwise presentation conditions.
Experiment 3 In Experiment 3, participants made a series of judgments rather than a single choice for each set of apartments. Judgment processes may differ from choice processes in several ways, leading to the use of different strategies and possibly taxing resources differently for dimensionwise participants than for alternativewise participants. A fundamental difference between judgment and choice is that choice is explicitly comparative in nature but judgment typically is not. When making choices, one must be given more than one alternative to choose from. The typical presentation format for judgment, on the other hand, is simply to present one alternative at a time. A second important difference is that judgments are typically rendered on a graded scale but that choice is typically all or none. This difference has led several researchers to conclude-that choice processes are more lexicographic in nature, whereas judgment processes tend to give more even weight to the various attribute dimensions, often leading to preference reversals across the two tasks (Goldstein & Einhorn, 1987; Mellers,
436
SENTER AND WEDELL
Ordonez, &' Birnbaum, 1992; Tversky, Sattath, & Slovic, 1988). The most common model of multiattribute judgment is the weighted additive or constant weight averaging model described by N. H. Anderson (1981). This model provides a good first order approximation to judgment data across a wide variety of stimulus domains. It assumes that participants value information on each dimension, weight the values, and sum these weighted values to arrive at an integrated impression, which is then converted to a response. For those who object that this process does not correspond well to participants' subjective impressions of the judgment process, an anchoring and adjustment interpretation of the process may be more appealing (Lopes, 1981). Wedell and Senter (1997) showed that an equal weighting model could be mimicked by the judge implicitly rating each piece of information and then adjusting the overall impression by Ilk, where k is the number of pieces of information sampled. Thus, if the presented information were valued respectively as 1, 4, and 4 on a 9-point scale, the judge might first establish an impression of " 1 , " adjust this halfway toward the second value, 4 (i.e., to "2.5") and then adjust this impression 1/3 of the way toward the third value, 4 (i.e., to "3.0"). This process yields the same value as an averaging process and is easily conceived in terms of updating impressions based on new information. In addition, process-
tracing measures from judgment experiments are consistent with an anchoring and adjustment interpretation (Schkade & Johnson, 1989; Wedell & Senter, 1997). If we assume an anchoring and adjustment interpretation of the judgment process, we can conduct a task analysis to determine how cognitively taxing this process would be to implement in either an alternativewise or dimensionwise fashion. Figure 5 presents this analysis for a situation in which there are three alternatives varying on three attributes and in which judgments are only rendered after viewing each piece of information once. In the alternativewise condition depicted in the left side of Figure 5, all information for Alternative A is presented before moving on to Alternative B and then to C. When a piece of information is presented, we assume it must first be valued and held temporarily in working memory. If there is another value for this alternative in memory, these two values must be integrated and the result held in memory. This analysis indicates that the memory load increases by one each time one proceeds to another alternative. The average memory load during this task is 36/16 = 2.25 pieces of information. This may be contrasted with the dimensionwise condition in which information about each alternative is presented on a given dimension before proceeding to the next dimension. After the first three pieces of information, memory slots must be reserved for the three working impressions of the
Alternativewise Anchoring and Adjustment
Dimensionwise Anchoring and Adjustment
info.
Process
Memory Load
Info.
A, A2
V(A,)
vA1
A,
->
VJA,)
->
V(A2)
v A1> v A 2
B,
^
V(B,)
^
Ui2
Ci
->
Ui2i V A 3
A2
->
V(A 2 )
^
'(VAI.V^)
^
V(B2)
^
"(VAI.VA,)
A3
V(A3)
->
I(U12> V A 3 )
Ui23
B1
VfB,)
Ui23' V B 1
B2
V(B2)
Ui23i V B 1 , V B 2
«(VB1, VB2) ->
Ui23> 'B12
V(B3)
'A123> 'B12' V B 3
B3
I(I B 12. V B 3 )
c. c2 c3
->
Ui23' 'B123
->
'A123I 'B123> * C 1
V(C2)
Ui23' 'B123> V C 1 , V C 2
I(C A 1. CAZ)
"A123> 'B123I 'C12
V(C3) Klc12,VC3)
->
'A123> 'B123> 'C12> ^ C 3 Ui23> 'B1231 'C123
B2
C2
A3
Process
->
-»
-»
c3
^
^
VAi
v A 1 I VB1 v A i , V I , VC1 v A 1 , V I , VC1, V v B1> V 1 , I 12 v B 1 , v c 1 , i A12 , v B 2 B
B
C
M
A
I(VB1, VB2) -^
V C i, Ui2i 'B12
V(C2)
^
V C 1,
l(V C i,V C 2 )
^
'A121 •B12> 'C12
V(A3) KIAI2.VA3)
B3
Memory Load
V(B3)
-> ^
^
Ui2' 'B12>»C2
Ui2. I
I
V
'B12> 'C12> V A3
'B12> •C12> 'A123 'B12> 'C12i "A123> »B3
I(I B 12,V B3 ) "^
'C12. Ui23> 'B123
V(C 3 )
'C12' •A123> "B123I »C3
l(lci2.V C3 )
^ ->
Ui23
'B123> ' C 1 2 3
Figure 5. Task analysis by task condition for Experiment 3. Each piece of information on each alternative is valued and integrated with the result held in memory. A, B, and C refer to alternatives; numerical subscripts refer to dimensions; V() refers to the valuation operation yielding values, V; I() refers to the integration operation yielding impressions, I.
437
INFORMATION PRESENTATION CONSTRAINTS
alternatives. Thus, the load increases rapidly and stays high through most of the task, the average load being 48/16 = 3.0 pieces of information. If participants applied the anchoring and adjustment strategies described here, then this analysis suggests that the dimensionwise condition should yield poorer accuracy and slower times (reflecting greater cognitive effort). Clearly the alternativewise presentation provides a more efficient environment for applying the anchoring and adjustment process. In light of the added memory load in the dimensionwise presentation condition, participants might attempt to use a different judgment strategy. One way to do so would be to engage in typical choice strategies such as the lexicographic strategy (Tversky, 1969) or elimination by aspects strategy (Tversky, 1972) to determine a ranking of the three alternatives. Such strategies would be less cognitively taxing because they tend to use qualitative rather than quantitative comparisons and they access less information. At the time of judgment, the judge might then retrieve a general impression of the overall attractiveness of the information presented and use this as an anchor, adjusting the judgment for the worst alternative down and adjusting the judgment for the best alternative up. To test these ideas, we had participants run through the same apartment sets used in Experiments 1 and 2, but they judged the three apartments at the end of each trial rather than simply choosing the best apartment. Because the anchoring and adjustment strategy depicted in Figure 5 is a version of the weighted additive strategy, it should be insensitive to both manipulations of variability and dominance. We hypothesized that participants in the alternativewise condition would use this strategy because it is both familiar and not beyond their resource capacity. This hypothesis led to the prediction that alternativewise participants would be insensitive to the manipulation of set, showing similar accuracy in judgments across the three sets. On the other hand, we hypothesized that participants in the dimensionwise condition would avoid the anchoring and adjustment strategy because it was cognitively taxing, and they would use choice heuristics to make their judgments. This hypothesis led to the prediction that accuracy for dimensionwise participants would vary with the set manipulation. On the basis of Experiments 1 and 2, we predicted that accuracy would be lowest in the HV set, highest in the D set, and of intermediate value in the LV set, indicative of the use of the lexicographic strategy.
Method The method for this experiment was nearly identical to that of Experiment 2, with the only major change being that participants made judgments of all three alternatives after viewing all of the information instead of indicating a choice. Participants were 115 undergraduates sampled from the same population as in Experiments 1 and 2. Participants were randomly assigned to one of the six between-subjects conditions created by the factorial combination of presentation sequence (alternativewise vs. dimensionwise) and stimulus set (three counterbalanced orders). The major dependent variable was the rating of the attractiveness of each apartment
on a 9-point scale (1 = very unattractive to 9 = very attractive). An additional dependent variable was the looking time on each trial. Participants were instructed to imagine that they were rental agents whose task it was to rate apartments on their attractiveness to help their clients select the best apartment. When all of the information had been viewed, participants were asked to rate the attractiveness of each of the three apartments moving from left to right on the computer screen. Participants were given three practice trials to become familiar with the task.
Results We first describe the judgment data using the typical ANOVA approach to analyzing judgments, focusing on accuracy-related measures. Next, we consider how the data relate to choice data from Experiments 1 and 2. To do so, we infer choices for each trial from the pattern of judgments and submit these to the same types of analyses described for those experiments. Finally, we examine looking time data. Figure 6 presents the judgment data as a function of presentation condition, alternative, and set value level. The pattern of data for both alternativewise and dimensionwise presentation conditions is generally consistent with the stimulus design. Judgments increased with the value of the alternatives (L to M to H) indicating sensitivity to within-set differences in average utility. The slopes of these functions are steeper in the dimensionwise presentation condition, reflecting greater within-set discrimination of alternatives. The different rating functions within each panel correspond to ratings for the different set value levels. As expected, apartment sets with higher values received higher ratings. The spread of these functions seems considerably greater for alternativewise participants, indicative of greater discrimination between set value levels for these participants. We submitted the judgment data to a 2 (presentation condition) X 3 (alternative) X 3 (set) X 5 (value) repeated measures ANOVA. Accuracy is reflected in the effects of alternative and value. Because alternatives (L, M, and H) differed incrementally by 0.5 units in average utility, the main effect of alternative relates to accuracy (or discrimination) within choice sets. This effect was highly significant, in If)
7 6 5
I
4
L
M
H
L
M
•
H
Apartment Figure 6. Mean ratings by alternative and set value level across task condition for Experiment 3. H = high alternative; M = middle alternative; L = low alternative.
438
SENTER AND WEDELL
F(2, 226) = 382, MSE = 1.37, p < .001. As expected, the highest judgments were assigned to the H alternative and the lowest to the L alternative, with judgments of the M alternative falling in between. It is important to note that there was a significant Task X Alternative interaction, F(2, 226) = 8.55, MSE = 1.37, p < .001, indicating greater within-set accuracy in the dimensionwise condition. This finding replicates choice results from Experiment 2. The main effect of value was highly significant as well, F(4, 452) = 224, MSE = 5.02, p < .001, indicating discrimination between sets of apartments that varied in average utility. As expected, mean ratings increased with increases in set value level. It is important to note that there was a significant Task X Value interaction, F(4, 452) = 13.76, MSE = 5.02, p < .001. This interaction reflected the greater spread of mean judgments across set value levels for alternativewise participants. Thus, participants in the alternativewise condition were more accurate in distinguishing apartments differing in average utility between judgment sets, but those in the dimensionwise condition were more accurate in discriminating apartments within a judgment set. A critical issue with regard to inferring different strategies is whether the manipulation of set (LV, HV, D) affected accuracy. The Set X Alternative interaction was not statistically significant, but the three-way interaction between task, set, and alternative was, F(4,452) = 5.35, MSE = 0.53, p < .001. This three-way interaction is depicted in Figure 7. As portrayed, the rating functions are parallel for the two conditions in the HV set. However, both LV and D sets show a steeper slope for dimensionwise presentation. To cpmpare these data more closely to choice data, we converted judgments to inferred choices. When one alternative was rated higher than the other two in the set, we assumed that alternative would be chosen. When alternatives were tied for the highest rating in a set, we assumed they would be chosen equally often. We then calculated relative accuracy of choices using Equation 1 and submitted this to a 2 X 3 repeated measures ANOVA. The key effect of concern was the Task X Set interaction, which was statisti-
LV
HV /
6-
P
D
/
'
?
:
P
d / / / ro |
c CO
5
-
d/
:
/
;
o DIM
• L M H
ALT
; L M H
L M H
Apartment Figure 7. Mean ratings by alternative and choice set across task condition for Experiment 3. HV = high variability set; LV = low variability set; D = dominance set; H = high alternative; M = middle alternative; L = low alternative; DIM = dimensionwise; ALT = alternativewise.
HV
LV D Judgment Set
Figure 8. Inferred choice accuracy from attractiveness ratings in Experiment 3. HV = high variability set; LV = low variability set; D = dominance set; ALT = alternativewise; DIM = dimensionwise.
cally significant, F(2,226) = 9.6, MSE = 0.0223,/? < .001. Simple effects analysis revealed that accuracy did not differ across sets for the alternativewise participants but did differ significantly for the dimensionwise participants. Figure 8 presents the inferred choice accuracy from this experiment. As can be seen, the accuracy data for the dimensionwise task show the same pattern found in Experiments 1 and 2 and suggest the use of a lexicographic strategy. Unlike the results from the previous experiments, there is no differential accuracy across sets for alternativewise presentation. This is the pattern expected if people used a weighted additive strategy. Finally, looking times were once again examined. Again, due to the highly skewed distribution of looking times, a Mann-Whitney U test was conducted and indicated that this difference was significant {p < .05). Consistent with the adaptive decision maker hypothesis, the looking times were longer for alternativewise participants (Mdn = 13.0 s) than dimensionwise participants (Mdn = 11.2 s).
Discussion A primary goal of Experiment 3 was to determine how the effects of manipulating presentation sequence in a judgment task might differ from those effects found in a choice task using the same materials and the same presentation constraints. Similar to the choice results of Experiment 2, dimensionwise presentation resulted in higher within-set accuracy and required less looking time. However, the most telling result was that the different presentation constraints appeared to result in the use of different strategies in the judgment task, but not in the choice task. These results were consistent with the idea that when resources are taxed, individuals resort to effort saving heuristic strategies that maintain relatively high accuracy. Our task analysis (portrayed in Figure 5) demonstrated that the application of an anchoring and adjustment strategy was much more cogni-
439
INFORMATION PRESENTATION CONSTRAINTS
tively taxing when information was presented in a dimensionwise fashion than in an alternativewise fashion. Participants in the alternativewise condition may have used the anchoring and adjustment strategy because it is well suited to judgment and not overly taxing, but those in the dimensionwise condition may have found it too burdensome and switched to the use of heuristic strategies. The best evidence for this interpretation comes from analysis of the effects of set. Consistent with the use of weighted additive or anchoring and adjustment strategies, within-set accuracy was unaffected by the set manipulation for alternativewise participants. On the other hand, those in the dimensionwise condition showed the same pattern of within-set accuracy as found in choice. The pattern of greater accuracy from HV to LV to D sets is consistent with the use of the lexicographic strategy. Thus, we interpret these data as providing evidence for a change in judgment strategy as a function of presentation constraints. In addition to providing evidence for change in strategy, the data also provide further insight into differences between choice and judgment. There are numerous examples of how judgment tasks can lead to different patterns of preferences than choice tasks (e.g., Goldstein & Einhorn, 1987; Mellers et al., 1992; Tversky et al., 1988). The current research is consistent with that of Mellers et al. (1992) in arguing that such differences may arise from differences in the operations for integrating information used by participants in judgment and choice, rather than simply differences in weight. For example, there was a different pattern of inferred preferences for alternativewise participants in the judgment task (who were not sensitive to the set manipulation) than those in the corresponding choice task of Experiment 2 (who were sensitive to the set manipulation). These differences are attributed to the use of different strategies across these tasks. Lest one assume that judgment and choice should always lead to such differences, it is notable that the dimensionwise presentation condition produces no such differences between judgment and choice. Another notable feature of Experiment 3 is that it demonstrated how information presentation can affect preference relationships. Johnson, Payne, and Bettman (1988) demonstrated preference reversals for choice situations associated with features of the stimulus display. Experiment 3 demonstrated clear differences in preference relationships for dimensionwise and alternativewise participants. These differences appear to result from two sources. First, dimensionwise participants were more sensitive to differences within a choice set, but they were less sensitive to differences between choice sets than alternativewise participants. This tendency resulted in a different ordering of the judgments across these conditions. Examining Figure 6, one can see that for dimensionwise participants the mean rating for the L alternative at Set Value Level 7 was lower than the mean rating of the H alternative at Set Value Level 5, but this relationship was reversed for the alternativewise participants. These types of differences are due to the closer spacing and steeper slopes of rating functions for dimensionwise participants than for alternativewise participants. In other words, ratings of dimensionwise participants are more
strongly influenced by the local context of the choice set than ratings of alternativewise participants. The other difference in preference ratings for these two groups emerged from the use of different strategies alluded to earlier. Because dimensionwise participants were sensitive to the set manipulation but alternativewise participants were not, additional differences in preference orderings emerged. In conclusion, Experiment 3 showed strategy differences between alternativewise and dimensionwise participants in the judgment task. Alternativewise participants appeared to implement a holistic approach to the task, whereas dimensionwise participants appeared to use a choice-like lexicographic approach. We believe that the preferred strategy in a judgment task is a holistic evaluation of the alternatives. Our task analysis (Figure 5) demonstrated this strategy was more cognitively taxing in the dimensionwise presentation condition. In the face of the increased difficulty of the task, it appears that dimensionwise participants reverted to the easier lexicographic choice strategy. Although use of this strategy reduced effort and increased within-set accuracy, it led to poorer discrimination of alternatives across sets.
Experiment 4 Although Experiment 3 is consistent with the idea that different sequencing of information can lead to the use of different strategies, one might argue that the demonstration of strategy differences in judgment leaves open the question of when these differences will emerge with choice. After all, when participants made choices using the same experimental materials and manipulations in Experiment 2, there was surprisingly no evidence for differences in strategy. Following the same logic that formed the basis for Experiment 3, we reasoned that the lack of strategy differences in Experiment 2 might well be due to the features of the task failing to tax resources sufficiently enough to induce participants to choose sequence-appropriate strategies. For example, consider the advantage of the D set over the LV set found for both alternativewise and dimensionwise participants. It may well be that when there are just three alternatives, participants can keep values in mind to a sufficient degree to make the comparisons necessary for detecting dominance, even in the alternativewise condition. Clearly, this type of comparison would be easier in a dimensionwise situation in which one need not hold attributes in mind for as long or to such an extent. Thus, we expected that when the number of alternatives was increased from three to five, participants in the alternativewise condition would be less able to implement strategies that are dominance sensitive. Another way in which increasing the number of alternatives might lead to strategy changes relates to the function of the initial screening of alternatives. Beach (1993) and others (Russo & Leclerc, 1994) have argued that when faced with many alternatives, the initial job of the decision maker is to screen out poor alternatives to pare the choice set down to a manageable size. Thus, we expected that the increase from three to five alternatives might result in greater use of elimination-based strategies. Use of such strategies would
440
SENTER AND WEDELL
result in greater accuracy for HV than for LV sets, the opposite of what we observed in Experiments 1-3. However, the use of elimination strategies seems better suited to dimensionwise presentation than to alternativewise presentation. This is because with dimensionwise presentation, one gets several passes at the materials, so eliminating some alternatives early on will allow one to focus resources on remaining alternatives. In contrast, with alternativewise presentation it is more difficult to establish early on what is a poor value within the given choice set, and poorer values may not occur until late in the choice set. These factors make implementation of elimination strategies more difficult in the alternativewise task. Experiment 4 thus served to determine whether the results of Experiment 2, which failed to find evidence of strategy change across extreme differences in presentation sequences, would generalize to a more complex decision environment involving five rather than three choice alternatives.
Method The method of Experiment 4 was very close to that of Experiment 2. There were basically three changes in the design. First, two additional alternatives were added to each set at the middle average utility. Thus, each set consisted of one L alternative, one H alternative, and three M alternatives. Participants then chose the best apartment from the set of five. Second, there were two blocks of trials, each consisting of 36 choices. The second block presented the same apartments viewed in the first block, only in a different randomized order. Finally, only three levels of value were used (8, 6, and 4). Participants were 264 undergraduates sampled from the same population as in Experiments 1-3. Participants were randomly assigned to one of the 12 between-subjects conditions created by the factorial combination of presentation sequence (alternativewise vs. dimensionwise) and stimulus set (six counterbalanced orders). Each participant was presented with a unique random ordering of the 36 trials. The 36 trials were created from four different replicates of choice sets drawn from three different types of sets (HV, LV, and D) and three different set value levels. The materials and apparatus were identical to those used in Experiment 1. The procedure was essentially the same as used in Experiment 2. The only differences were that when participants had completed the first 36 trials, they were given a 1-min break before being prompted to complete the second 36 trials.
Results Equation 1 was used to determine the accuracy score for each choice, with a score of 1.0 if H was chosen, 0.0 if any of the M alternatives were chosen, and -1.0 if the L alternative was chosen. Accuracy scores were submitted to a 2 X 2 X 3 repeated measures ANOVA. A significant main effect of presentation condition was found, F(l, 262) = 19.8, MSE = 0.0765, p < .001. As found in Experiments 2 and 3, choice accuracy was higher when information was viewed by dimension. Figure 9 presents the accuracy data as a function of presentation sequence and set. The main effect of presentation condition can be seen in the generally higher accuracy for the dimensionwise condition. Most relevant to the issue of strategy use was the main
HV
LV Choice Set
D
Figure 9. Choice accuracy across task condition and choice set for Experiment 4. HV = high variability set; LV = low variability set; D = dominance set; ALT = alternativewise; DIM = dimensionwise. effect of set, which was significant, F(2, 524) = 72.1, MSE = 0.0259, p < .001. More important, there was a significant Set X Presentation Condition interaction, F(2, 524) = 6.3, MSE = 0.0259, p < .01. Two orthogonal interaction contrasts were used to better understand these effects. The first compared the difference in accuracy for HV and LV sets across the presentation conditions. This contrast was nonsignificant, and the sum of squares associated with the contrast accounted for less than 0.1 % of the systematic variance in the Set X Presentation Condition interaction term. The second contrast compared the average accuracy of HV and LV sets to the accuracy of the D set across tasks. This interaction was highly significant, F(l, 262) = 14.1, MSE = 0.2765, p < .001. Thus, the Set X Presentation Condition interaction can be explained by the greater sensitivity to the dominance manipulation by the dimensionwise participants. The main effect of block was also significant, F(\, 262) = 30.6, MSE = 0.0295, p < .001; however, this effect must be interpreted in light of a significant Block X Presentation Condition interaction, F(l, 262) = 9.9, MSE = 0.0295,/? < .01. Simple effects analysis showed that accuracy was strongly reduced from Block 1 to Block 2 for the alternativewise participants (Afx = .316 and M2 = .241), but accuracy did not differ significantly for dimensionwise participants {Mi = .350 and M2 = .330). The three-way interaction of block, set, and presentation condition did not reach significance. Finally, the Mann-Whitney U test conducted on the looking times revealed a significant difference (p < .001). Time per trial was found to be higher for alternativewise participants (Mdn = 17.2 s) than dimensionwise participants (Mdn = 13.7 s).
Discussion Unlike in Experiment 2, the five alternative task of Experiment 4 resulted in a significant interaction of presenta-
441
INFORMATION PRESENTATION CONSTRAINTS
tion sequence'and choice set. We interpret the pattern of accuracy for alternativewise participants as consistent with an attempt to implement the lexicographic strategy. In such a strategy, high values on a most important dimension drive the choice process. If the strategy is properly implemented, dominated alternatives will never be chosen because they cannot have the uniquely highest value on any given dimension. Instead, the best a dominated alternative can do is tie for the highest value on a dimension. A difficulty for implementing the lexicographic strategy within the alternativewise sequence is that it is virtually impossible to break ties by looking at a second most important attribute. The only way this can be done is if one can search memory for values on that attribute. With the increased complexity of the task, this may well have proved impossible. If this interpretation is correct, the alternativewise participants in the five-alternative task of Experiment 4 may have used the same strategy as corresponding participants in the threealternative task of Experiment 2, but the complexity of the task resulted in an inability to make use of dominance relationships. The dimensionwise participants in Experiment 4 showed essentially the same pattern as those in Experiment 2 in which accuracy decreased from the D set to the LV set to the HV set. This pattern is indicative of the use of the lexicographic strategy. We had expected that there may have been greater use of screening strategies for dimensionwise participants so that accuracy would have been greater for the HV set than the LV set. However, the pattern of results suggests the/ predominant use of the lexicographic strategy. Thus, we conclude that even in the more complex decision environment of Experiment 4, alternativewise and dimensionwise participants likely used the same strategy. The Task X Set interaction reflected not so much a change in strategy but a difference in ability to successfully implement the same strategy. That is, we believe that the greater ease with which dominance-related comparison can be made in a dimensionwise fashion accounts for the difference between tasks rather than the use of different strategies across tasks. Finally, it is interesting to note that the disadvantage of the alternativewise presentation method increased from Block 1 to Block 2. One way to interpret this difference is that the more cognitively taxing alternativewise condition led to greater fatigue than the dimensionwise condition. The sustained accuracy in the dimensionwise condition once again speaks to the adaptive nature of information processing associated with dimensionwise acquisition in a choice task.
Supplemental Analyses We streamlined our presentation of the results for Experiments 1-4 by eliminating several analyses that were not directly relevant to the primary hypotheses being tested. In this section, we present some of those results across the different experiments in an attempt to provide a fuller picture of the data.
Individual Differences in Strategies In Experiments 2—4, we used pattern of accuracy across the three choice sets to classify individuals into one of three groups representing the use of different choice strategies. Participants with accuracy strictly increasing from set HV to LV to D were classified as lexicographic participants, because this pattern of accuracy corresponds to the typical pattern produced through the use of the lexicographic strategy. Participants with greater accuracy in the HV set than in the LV set were classified as criterion participants. This pattern of accuracy corresponds to the use of strategies such as satisficing and elimination by aspects, that eliminate alternatives with low dimensional values (i.e., Alternative L in the HV set). Participants who fell into neither of these groups were classified as being in the remainder category. Table 2 displays the number of participants falling into each category in each condition for Experiments 2-4. Also displayed is the chi-square test of independence result for each experiment, indicating differences in strategy frequency across presentation condition. Experiment 2 produced no significant differences in strategy use across presentation condition, whereas Experiments 3 and 4 both resulted in significant differences in strategy frequency across presentation condition, consistent with corresponding ANOVA results. Note that the greater number of dimensionwise participants in the lexicographic classification may well be due to the criteria for classification. To fall into the lexicographic category, it was necessary to have lower accuracy in the HV set than the LV set and lower accuracy in the LV set than in the D set. Therefore, the difference in the number of dimensionwise and alternativewise participants falling into this category may be due to differences in implementing this strategy rather than differences in using it. The percentage of individuals that would be classified as lexicographic, criterion, and remainder by chance was calculated to be 12.1%, 44.0%, and 43.9%, respectively. In
Table 2 Number of Participants Per Strategy Category for Experiments 2-4, and Chi-Square Test of Independence Across Task Condition and Category Experiment and presentation condition Experiment 2 Alternativewise Dimensionwise Experiment 3 Alternativewise Dimensionwise Experiment 4 Alternativewise Dimensionwise
Category
Lex
Criterion
Remainder
19 17
21 18
15 13
14 19
27 15
15 25
28 47
41 37
66 45
x2 ( 2 ) a 0.016.61* 8.86*
Note. Lex = lexicographic participants; Criterion —, criterionbased elimination strategy participants; Remainder = remaining participants. Tor Experiment 2, N = 103; for Experiment 3, N = 115; for Experiment 4,N= 264. *p < .05.
442
SENTER AND WEDELL
each case, 'observed percentages differed from these, with the main difference due to the greater than chance occurrence of lexicographic participants. This analysis is also consistent with ANOVA results. We use this classification scheme to better understand the pattern of results in the sections described below.
Accuracy and Value A consistent finding across all four experiments was that accuracy depended on value. This relationship is shown in Figure 10. The main effect of value was significant in each of the four experiments. Significant quadratic trends indicated that participants had the highest accuracy at the moderate set value levels. There are at least two possible interpretations of this finding. In general, the main effect of set value level is consistent with the usage of criterion-based elimination strategies such as satisficing and elimination by aspects. Given a moderate-valued criterion, accuracy is reduced for extreme low and high set value levels, and highest at the moderate set value levels. This is because at high set value levels, all alternatives may be retained and at low set value levels all may be rejected. An alternative explanation of the value relationship is that the decreased accuracy at the high and low extremes may simply be due to a motivational component that is strongest at moderate set value levels and weakest at the extremes. For example, at high overall set value levels, a participant may feel that any choice would be a good one, as each alternative has a high average utility. Similarly,.at low set value levels a participant may feel that any choice is a poor one due to the low average utility of each alternative. In either of these cases, the individual may not be motivated to examine the materials as carefully and so accuracy may be reduced. The classification scheme developed in the previous section provides a test between these two interpretations. If the curvilinearity is due to the use of criterion-based elimination strategies, then criterion classified participants should show a larger advantage in accuracy for moderate
0.75 0.70 0.65 0.60 0*0.55
- •
°Dim •Alt
.\ -
2 0.50 O 0.45 ^0.40 0.35 0.30 0.25 • 0.20
:
-'V
Ok
aExp 1
4 5 6 7 8
:-
Exp 2 4 5 6 7 8
:-
Exp 3 4 5 6 7 8
:-
°.
Exp 4
;
4 5 6 7 8
Set Value Level Figure 10. Choice accuracy across task condition and set value level for Experiments 1-4. Dim = dimensionwise; Alt = altemativewise; Exp = Experiment.
Table 3 Correlations Between Looking Time and Accuracy by Task Condition for Experiments 2-4 Correlation Experiment 2 3 4 *p < .05.
Altemativewise
Dimensionwise
Total
.58*** 46*** .49***
.15 .32* .25**
.32** 33*** .28***
**p< .001
versus high and low levels of set value. We tested this prediction by computing an index of curvilinearity for each participant and subjecting these scores to an ANOVA with classification category as the categorical variable. Criterion participants should produce larger scores when the average of the extreme accuracy levels is subtracted from the average of the moderate accuracy levels. The main effect of strategy category was not significant in any of these analyses. Indeed, across Experiments 2-4, lexicographic and remainder participants frequently produced larger values on this measure than did criterion participants. This weakens support for the criterion-based strategy interpretation of set value level effects on accuracy and suggests the effect of value may be due to a broader motivational factor.
Accuracy and Looking Time For Experiments 2-4, total accuracy correlated with average looking time per trial. As Table 3 shows, these correlations tended to be higher for altemativewise participants than for dimensionwise participants. For Experiment 2, looking time was strongly and positively correlated with accuracy in the altemativewise condition but not in the dimensionwise condition. For Experiments 3 and 4, looking time was positively correlated with accuracy in both the altemativewise and dimensionwise conditions; however, the correlation was greater for altemativewise participants than for dimensionwise participants. One interpretation of these correlations is that to implement strategies under alternativewise presentation required greater effort so that a clear relationship between time and accuracy emerged. To test this possibility, the time per trial, presentation condition, and their interaction were entered into a regression equation predicting accuracy for the combined data of Experiments 2-A. The overall model was significant (R2 = .142,/? < .001), as were each of the components of the equation (p < .05). The significant interaction of presentation condition and time per trial reflected the stronger positive relationship between looking time and accuracy in the altemativewise condition than in the dimensionwise condition. Dimensionwise presentation may have facilitated the use of a less mentally taxing representation so that looking time (as a measure of effort) was less important in producing accurate choices.
INFORMATION PRESENTATION CONSTRAINTS
Looking Times for Sets and Alternatives Across the looking time data for Experiments 2-4, there appeared similar effects of choice set and alternative. The main effect of choice set always consisted of a pattern in which looking time was longest for the HV set, followed by the LV set, with the shortest looking times for the D set. This may be interpreted as reflecting the continued consideration of Alternative L in the HV set due to its attractive high dimensional values, in addition to the relatively rapid rejection of Alternative L in the D set due to the fact that it was dominated. The significant main effect of alternative across Experiments 2-4 was in each case due to the longer looking time spent on Alternative H, followed by Alternative M, with Alternative L having the shortest looking times. This pattern of spending more time looking at the best alternative or the alternative that will ultimately be chosen has been found before (Wedell & Senter, 1997) and may partly be due to a verification stage in choice.
Working Memory and Choice Accuracy An interesting question that relates to this research is the extent to which individual processing capacity affects choice accuracy. We examined this question in Experiment 4 by using a larger number of participants and obtaining a measure of their working memory in a separate session. First, we predicted that working memory capacity would correlate positively with choice accuracy, because greater ability to mentally manipulate information should reduce effort and increase accuracy. Second, we speculated that participants with greater capacity would show less of a difference in choice accuracy in the alternativewise condition relative to the dimensionwise condition than those with less working memory capacity. To obtain a measure of individual processing capacity, we had a subset of participants from Experiment 4 (n = 101) complete a working memory task modeled after that of Turner and Engle (1989). The task required participants to solve simple math problems while holding words in memory. Participants read simple math equations and were asked to produce the answers. After participants entered each answer, the computer screen went blank and a single word was presented to participants for 2 s. Following two to seven trials of this nature, participants were asked to recall the words. Working memory capacity was scored on the basis of performance on this task. In general, the score produced by this task was thought to represent a measure of working memory capacity, with higher scores representing higher working memory capacity and lower scores representing lower working memory capacity.4 Our first prediction was supported in that the scores produced by the working memory task correlated significantly with choice accuracy (r = .28, p < .01). A median split was performed on the capacity scores from the subset of participants who completed the working memory task and we conducted a 2 (span) X 2 (presentation condition) ANOVA, with choice accuracy serving as the dependent variable. Participants in the upper half were classified as
443
high spans and participants in the lower half were classified as low spans. The main effect of span was significant, F(l, 97) = 8.0, MSE = 0.0131, p < .01, with high span participants producing higher accuracy than low span participants (MMgh = .336 vs. Mlow = .271). Our speculative prediction that high capacity participants would show a smaller decrease in accuracy in the alternativewise condition relative to the dimensionwise condition was not supported, as the advantage of high spans over low spans remained constant across presentation condition. General Discussion In this work, we focused on how choice and judgment may depend on the sequence of information acquisition. In the typical process tracing paradigm, the participant is free to access the information in whatever order he or she wishes, and the pattern of information acquisition is often used as an index of strategy. The link between strategy and pattern of acquisition is only correlational, however. Thus, it may well be that patterns of acquisitions may differ, but strategies for integrating information remain constant. In Experiments 2-4, we constrained participants to view information in either a strictly dimensionwise or alternativewise fashion. This enabled us to test features of the adaptive decision maker hypothesis as well as test the nature of the linkage between information acquisition and strategy implementation. In this section, we discuss these two aspects of our experiments.
Adaptive Decision Behavior According to the adaptive decision maker hypothesis, individuals weigh costs and benefits of different procedures for making choices and use the one that is best adapted to the particular task, context, and environmental conditions under which the choice is being made. Although admittedly effort and accuracy do not exhaust potential costs and benefits, they appear to be quantifiable and independently defined. Payne et al. (1988) showed that over a wide variety of task and contextual manipulations, individuals were able to maintain high accuracy, and thus they argued that the
4 The working memory task we used differed in some respects from that of Turner and Engle's (1989) task. In their task, on a given trial, the participants were provided with a short math equation that they were to read aloud, and indicated whether the answer was correct. A word followed the equation string, and participants were also to read this word aloud and remember the word until prompted for recall. An experimenter worked closely with each participant and moved the participant to the next trial when the word was read aloud. After 2-6 trials of this type, participants were prompted to produce the words. Our task was different in that it was self-paced, and participants could take as long as they liked to solve the math equations. This may have allowed participants to use a variety of memory strategies. Despite this potential problem, our measure of working memory correlated with verbal SAT (r = .40, p < .01), as has been found with previous working memory tasks.
444
SENTER AND WEDELL
experimental evidence supported the adaptive decision maker hypothesis. Our approach was to test whether the typically observed use of dimensionwise acquisition under increased task complexity (Biggs et al., 1985; Johnson & Meyer, 1984) was consistent with the adaptive decision maker hypothesis. We did this by forcing participants to view information either by dimension or by alternative and evaluating their accuracy and decision time, the latter being a crude index of effort. By and large, our results supported the adaptive decision maker hypothesis in that in all three experiments using the constraint paradigm, dimensionwise presentation led to both significantly higher relative accuracy and significantly less time-consuming decisions than alternativewise presentation. A second feature of these experiments was the use of different choice sets that enabled us to evaluate strategy use independent of the acquisition pattern. We used this approach to examine possible mechanisms by which dimensionwise acquisition leads to greater accuracy and less time. Payne et al. (1988) have modeled decision behavior using a production systems approach (J. R. Anderson, 1996; Newell & Simon, 1972) in which numerous productions are stored in memory. These productions include the basic elementary information processes (such as reading in a value, weighting it, etc.) and the strategies themselves. According to this approach, a basic way in which the decision maker adapts is by selecting different strategies, contingent on the task and contextual environment. Thus, one way that differences in accuracy and effort might have resulted from the different information acquisition patterns was from the use of different strategies. Alternatively, the same strategy might be used by participants, but the different mental representations formed by the two sequences of information acquisition might be differentially suited to the efficient implementation of that strategy. We believe the evidence from the choice experiments (2 and 4) supports the latter interpretation of the advantage of dimensionwise acquisition. In Experiment 2, the choice patterns across sets suggested the use of the same, predominantly lexicographic strategy by dimensionwise and alternativewise participants. Although the accuracy pattern across sets differed between the two presentation conditions in Experiment 4, we believe the data are consistent with the idea that participants again predominantly used a lexicographic strategy regardless of presentation sequence, but that alternativewise participants were less able to detect and use dominance relations. The failure to find strategy differences between these extreme presentation conditions does not mean that such differences do not occur when people freely choose how they access information. It does mean, however, that even when the same strategy is applied, the dimensionwise accessing of information yields an advantage. This advantage presumably reflects a mental representation that facilitates comparisons and thus requires less effort to accurately choose among alternatives. The widespread use of the lexicographic strategy we found in our choice experiments might reflect the very adaptive nature of this particular strategy. In their computer simulation of different strategies under different context and
task environments, Payne et al. (1988) consistently found that the lexicographic was among the most accurate strategies and that it required very little effort to implement. Given the adaptive nature of the lexicographic strategy, it is perhaps not surprising that it was used by participants who experienced extremely different patterns of information acquisition. The one clear exception to the conclusion that strategy did not differ with presentation sequence was found in the judgment data of Experiment 3. Here, we assume that the default mode participants preferred to use for judgment is something similar to a weighted additive evaluation of each alternative. This strategy could be relatively easily implemented in the alternativewise presentation condition, and hence participants used it. We believe that dimensionwise presentation made this strategy difficult to implement, and hence participants switched back to a basic choice strategy. Thus, the change in strategy across the two conditions may have resulted from a strong mismatch between the preferred mode of making judgments and the representation generated by the dimensionwise presentation sequence. In making judgments in everyday life one may acquire information either by dimension or by alternative, depending on the type of accuracy desired. For example, consider a situation in which a very large number of alternatives need to be evaluated, but these alternatives are only available for viewing in small sets at any given time. Experiment 3 suggested that alternativewise acquisition is better for isolating the best set of alternatives from the larger set. In contrast, if the goal is to select the best alternative within a smaller set, then dimensionwise acquisition should be more effective. Thus, the best sequence of accessing information depends on the goals of the judgment task. We believe it is important to note that in both judgment and choice situations that occur in everyday life, one may not be able to choose to examine information by alternative or by dimension. Throughout these studies, we have seen the advantage in accuracy that dimensionwise participants show over alternativewise participants, suggesting that dimensionwise acquisition in everyday life might facilitate the making of better decisions. However, some choice situations in everyday life force individuals to process information holistically or in an alternativewise fashion. When choosing which apartment to rent, one usually can visit only one apartment at a time, noting its features and storing them in memory. In such a situation, dimensionwise processing of features across apartments becomes somewhat difficult. Although the displaying of information in rows and columns corresponding to dimensions and alternatives allows researchers to examine the acquisition process, this type of flexible information access may not be available in many choice situations in the real world. Finally, it is important to note that differences in representations generated by different presentation sequences are a facet of the choice process that is not well understood. Cafferty et al. (1986) provided a preliminary exploration of this area and concluded on the basis of clustering in recall that dimensionwise presentation led to a more dimensionwise representation and alternativewise presentation led to a
445
INFORMATION PRESENTATION CONSTRAINTS
more alternativewise representation. The former representation might facilitate comparisons across alternatives in a set and thus help to explain the greater within-set accuracy for dimensionwise participants in both judgment and choice. The idea that different information acquisition patterns leads to different representations can be integrated into the production system framework for modeling adaptive decision behavior. The production system modeling approach is embedded within a large number of assumptions about the cognitive architecture of the decision maker. For example, a limited working memory capacity is typically assumed (J. R. Anderson, Reder, & Lebiere, 1996). Our results suggest that decision makers may not always adapt by selecting different strategies, but instead, they may find ways to implement the same strategy under varying constraints, which presumably would require a great deal of mental flexibility. This hypothesis is consistent with some of the results reported by Payne et al. (1988), in which participants appeared to respond to increased time pressure by simply speeding up their strategy implementation, and only when time pressure became severe was there evidence for a change in strategy. Development of a better understanding of how information from a decision task is represented in memory is clearly one avenue for future research.
Evidence for Linkages A general assumption of the process tracing paradigm is that the process tracing record reflects the mental processing of information. For example, looking time may be related to on-line mental processing of the information being examined. For some tasks, such as reading, there is reasonably good evidence of a close relationship between mental processing of information and looking time, as established by a converging operations methodology (Rayner, Sereno, Morris, Schmauder, & Clifton, 1989). Because decision making involves many high level cognitive processes, the linking of mental processing and looking behavior may be somewhat more difficult to establish. Recently, Wedell and Senter (1997) have demonstrated that in both judgment and choice, looking time is positively related to the weight given the information being examined. However, even this relationship must be qualified by issues related to the time course of processing. Initial time per acquisition does not reflect weighting behavior in choice, whereas time per acquisition on additional looks and frequency of access does. A fundamental measure of strategy use in decision making has been the sequence of information acquisition. Several strategies have been classified as proceeding either in a predominantly dimensionwise or alternativewise fashion. Thus, when participants switch to a more dimensionwise pattern, a shift in strategy is often inferred. We tested this relationship by manipulating the sequence of information acquisition directly and attempting to measure strategy by the pattern of accuracy across different choice sets. Surprisingly, we did not find the close relationship between acquisition sequence and strategy that is typically assumed in the literature. One possibility is that die imposition of
constraints may disrupt the typical correspondence between the pattern of acquisition and strategy. Thus, although one may wish to proceed in a dimensionwise fashion to implement a lexicographic strategy, one may due so in an alternativewise fashion if necessary. There are clearly problems associated with generalizing results from the constraint paradigm to the typical process tracing paradigm in which the sequence of information access is freely determined by the participant. On the other hand, these results suggest that the link between acquisition sequence and strategy is weak in at least some decision environments.
References Anderson, J. R. (1996). ACT: A simple theory of complex cognition. American Psychologist, 51, 355-365. Anderson, J. R., Reder, L. M., & Lebiere, C. (1996). Working memory: Activation limitations on retrieval. Cognitive Psychology, 30, 221-256. Anderson, N. H. (1981). Foundations of information integration theory. New York: Academic Press. Beach, L. R. (1993). Broadening the definition of decision making: The role of prechoice screening of options. Psychological Science, 4, 215-220. Bettman, J. R. (1979). An information processing theory of consumer choice. Reading, MA: Addison-Wesley. Bettman, J. R., Johnson, E. J., & Payne, J. W. (1990). A componential analysis of cognitive effort in choice. Organizational Behavior and Human Decision Processes, 45, 111-139. Biggs, S. R, Bedard, J. C, Gaber, B. C, & Linsmeier, T. J. (1985). The effects of task size and similarity on the decision behavior of bank loan officers. Management Science, 31, 970-987. Birnbaum, M. H. (1973). Morality judgment: Test of an averaging model with differential weights. Journal ofExperimental Psychology, 99, 395-399. Cafferty, T. P., DeNisi, A. S., & Williams, K. J. (1986). Search and retrieval patterns for performance information: Effects on evaluations of multiple targets. Journal of Personality and Social Psychology, 50, 676-683. Fiske, S. T. (1980). Attention and weight in person perception: The impact of negative and extreme information. Journal of Personality and Social Psychology, 38, 889-906. Ford, K. J., Schmitt, N., Schechtman, S. L., Hults, B. M., & Doherty, M. L. (1989). Process tracing methods: Contributions, problems, and neglected research questions. Organizational Behavior and Human Decision Processes, 43, 75-117. Goldstein, W. M., & Einhorn, H. J. (1987). Expression of theory and the preference reversal phenomena. Psychological Review, 95, 236-254. Huber, J., Payne, J. W., & Puto, C. (1982). Adding asymmetrically dominated alternatives: Violations of regularity and the similarity hypothesis. Journal of Consumer Research, 9, 90-98. Johnson, E. J., & Meyer, R. J. (1984). Compensatory choice models of noncompensatory processes: The effect of varying context. Journal of Consumer Research, 11, 528-541. Johnson, E. J., Payne, J. W., & Bettman, J. R. (1988). Information displays and preference reversals. Organizational Behavior and Human Decision Processes, 42, 1-21. Kahneman, D., & Tversky, A. (1979). Prospect theory: An analysis of decision under risk. Econometrica, 47, 263-291. Lopes, L. L. (1981). Decision making in the short run. Journal of Experimental Psychology: Human Learning and Memory, 7,
377-395.
446
SENTER AND WEDELL
Mellers, B. A., Ordonez, L. D., & Birnbaum, M. H. (1992). A change-in-process theory for contextual effects and preference reversals in risky decision making. Organizational Behavior and Human Decision Process, 52, 331-369. Newell, A., & Simon, H. A. (1972). Human problem solving. Englewood Cliffs, NJ: Prentice Hall. Payne, J. W. (1976). Task complexity and contingent processing in decision making: An information search and protocol analysis. Organizational Behavior and Human Performance, 16, 366387. Payne, J. W. (1982). Contingent decision behavior. Psychological Bulletin, 92, 382-402. Payne, J. W., Bettman, J. R., & Johnson, E. J. (1988). Adaptive strategy selection in decision making. Journal of Experimental Psychology: Learning, Memory, and Cognition, 14, 534-552. Payne, J. W., Bettman, J. R., & Johnson, E. J. (1993). The adaptive decision maker. New York: Cambridge University Press. Payne, J. W., & Braunstein, M. L. (1978). Risky choice: An examination of information acquisition behavior. Memory & Cognition, 5, 554-561. Ratneshwar, S., Shocker, A. D., & Stewart, D. W. (1987). Toward understanding the attraction effect: The implications of product stimulus meaningfulness and familiarity. Journal of Consumer Research, 13, 520-533. Rayner, K., Sereno, S. C , Morris, R. K., Schmauder, A. R., & Clifton, C. (1989). Language and Cognitive Processes, 4, SI21-SI49. Russo, J. E., & Leclerc, F. (1994). An eye-fixation analysis of choice processes for consumer nondurables. Journal of Consumer Research, 21, 274-290. Russo, J. E., & Rosen, L. D. (1975). An eye fixation analysis of multialternative choice. Memory & Cognition, 3, 267-276. Schkade, D. A., & Johnson, E. J. (1989). Cognitive processes in preference reversals. Organizational Behavior and Human Decision Processes, 44, 203-231. Shark, E. (1993). Choosing versus rejecting: Why some options are both better and worse than others. Memory & Cognition, 21, 546-556.
Simon, H. A. (1955). A behavioral model of rational choice. Quarterly Journal of Economics, 69, 99-118. Skowronski, J. J., & Carlston, D. E. (1987). Social judgment and social memory: The role of cue diagnosticity in negativity, positivity, and extremity biases. Journal of Personality and Social Psychology, 52, 689-699. Srull, T. K. (1983). Organizational and retrieval processes in person memory: An examination of processing objectives, presentation format, and the possible role of self-generated retrieval cues. Journalof Personality and Social Psychology, 44, 1157-1170. Svenson, O. (1979). Process descriptions of decision making. Organizational Behavior and Human Decision Processes, 23, 86-112. Svenson, O., & Maule, A. J. (1993). Time pressure and stress in human judgment and decision making. New York: Plenum Press. Turner, M. L., & Engle, R. W. (1989). Is working memory capacity task dependent? Journal of Memory and Language, 28, 127154. Tversky, A. (1969). Intransitivity of preferences. Psychological Review, 76, 31-48. Tversky, A. (1972). Elimination by aspects: A theory of choice. Psychological Review, 79, 281-299. Tversky, A., Sattath, S., & Slovic, P. (1988). Contingent weighting in judgment and choice. Psychological Review, 95, 371-384. Wedell, D. H. (1991). Distinguishing among models of contextually induced preference reversals. Journal of Experimental Psychology: Learning, Memory, and Cognition, 17, 767-778. Wedell, D. H., & Senter, S. M. (1997). Looking and weighting in judgment and choice. Organizational Behavior and Human Decision Processes, 68, 41-64.
Received August 29,1997 Revision received May 21, 1998 Accepted June 11,1998