alistic data. The second is the application of the database benchmark on three vastly heterogeneous âdatabaseâ plat- forms: mySQL 4.0, a relational database, ...
Information Representation on the Grid: a Synthetic Database Benchmark/Workload for Grid Information Servers Beth Plale, Craig Jacobs, Ying Liu, Charlie Moad, Rupali Parab, Prajakta Vaidya and Nithya Vijayakumar Computer Science Department, Indiana University, Bloomington, IN
1 Introduction
some of our extensions have become part of the GLUE data model.
The Grid is a new paradigm for wide area distributed computing. Management of grid resource information on the grid is complicated by the fact that grid resources such as hosts, clusters, virtual organizations, people, mathematical libraries, software packages, and services have aspects of their description that change at millisecond rates. This defining characteristic makes traditional directory service solutions inappropriate. Our work contributes to the understanding of resource information representation and retrieval in grid computing through the development of a grid-specific synthetic database benchmark/workload for a grid resource information repository, and the application of the benchmark/workload to three platforms. The benchmark/workload is a set of queries and ’scenarios’ developed from a platform-neutral data model of grid resources. The contribution of our work is threefold: the first is a synthetic database benchmark/workload. The queries are meaningful in a grid context, assume an underlying data model made up of realistic grid resources, and populated with realistic data. The second is the application of the database benchmark on three vastly heterogeneous “database” platforms: mySQL 4.0, a relational database, that uses the SQL query language; Xindice 1.1, a native XML database that uses XPath as its query language; and MDS2, an LDAP database that uses LDAP as its query language. The final contribution is a metric that captures both tangible and less tangible aspects of information retrieval.
Policy
ComputingElement
-MaxWallClockTime : int
1..*
-MaxCPUTime : int -MaxTotalJObs : int
AppSource
GlueSE
-Name : char
-GlueSEUniqueId [key] : char
-Location [key] : char
-UniqueId [key] : char
-GlueSEName : char
-Pathname [key] : char
-GRAMVersion : char
-Priority : int
-HostName : char
-PolicyType [key] : char
-GatekeeperPort : char
1..*
1..*
-GlueSEPort : int
0..*
-GlueSEHostingSL : char
-Filename[key] : char -Fileformate : char
-TotalCPUs : int -RunningJobs : int
Job
-TotalJobs : int
-GlobalId [key] : char
-WaitingJobs : int
-LocalId : char 0..* -GlobalOwner : char -LocalOwner : char -Status : enum
UserAccounts
Users
-WorstResponseTime : double
-UserId [key] : char
-EstimatedResponseTime : double
-Name : char
-Status : enum
-Email : char
-UserId [key] : char -CertificateId [Uni] : int -Certificateauthority : char -ActivationDate : Date
-FreeCPUs : int
-OrganizationalUnit : char
-ExpirationDate : Date -PublicKey : blob
1..* 1..* Connection
Cluster
-Num_Hops : int
-ClusterName : char
-Latency_RoundtripDelay_Ping : double
-ClusterId [key] : char
ClusterMembership 1..*
1..*
-ClusterId [key] : char
StorageDevice
-SubClusterId [key] : char -Name : char
-UserId [key] : int
-Bandwidth_Avail_TCP_SingleStream : double 1..*
-Packetloss : int
-Proctype : int
-TransferRate : int
-Arch : char -OS : char
-Size : int
SubCluster
-Traceroute : blob
-AvailableSpace : int
-Endpoint1_Port : int
Application
-Type : char
-Minosv : int -Version : char
Endpoint1_Protocol : char
-SubClusterName : char
-Owner : char
-Endpoint1_Addr : char
-Status : enum
SubClusterId : char
-EndPoint2_Port : int
-Pid [key] : int 0..*
-Endpoint2_Protocol : char
Benchmark
MainMemory
-Endpoint2_Addr : char
-Source_location : char -Source_filename : char
-ConnectionId [key] : int 0..*
-S100 : float
-SubClusterId [key] : char
-SF00 : float
-RAMSize : int
-BenchmarkId [key] : int
-RAMAvailable : int
1..*
1..2
Host
-Source_pathname : char -RunTimeEnvironment : char
-VirtualMemorySize : int
Endpoint
-VirtualMemoryAvailable : int -Hostname : char
-HostId : char
1..*
-HostId [key] : char
-Port [key] : int
-SMPLoad1Min : double
-Protocol [key] : char
-SMPLoad5Min : double
-Addr [key] : char
-SMPLoad15Min : double -ProcLoad1Min : double -ProcLoad5Min : double -ProcLoad15Min : double
Processor
NetworkAdapter
Architecture
-Vendor : char
-Name : char
-PlatformType : char
-Model : char
-IPAddress [key] : char
-SMPSize : int
-Version : char
-MaxTransmissionUnit : char
--ArchitectureId [key] : int
-ClockSpeed : char
-OutBoundIP : enum
-InstructionSet : char
-InBoundIP : enum
-OtherProcessingDescription : char -CacheL1 : int -CacheL1I : int -CacheL1D : int -CacheL2 : int -ProcessorId [key] : char
OperatingSystem
-Name : char -Release : char -Version : char -OSId [key] : char
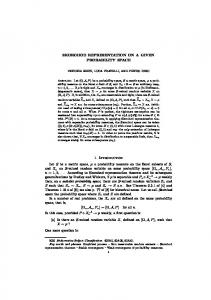
Figure 1: UML data model used by benchmark/workload.
The key to understanding the diagram in Figure 1 is to focus on the ComputingElement, Cluster, SubCluster, and Host hierarchy that runs vertically down the figure as it is shown in the circle. A ComputingElement, which can be thought of intuitively as a queue in a batch scheduling system, serves one or more Clusters, while a Cluster has one or more ComputingElements. A SubCluster belongs to one or more Clusters, and to zero or more SubClusters. A Host belongs to one or more SubClusters. The databases are populated with pseudo synthetic values informed from several large MDS dumps dated between November 2000 and January 2002 that we obtained. Each of the three database platforms hold the same entities and relationships. The number of instances of entities and relationships is also held constant across the three platforms. A database platform contains 34 entities/relationships and 81684 instances. In following with the standard adopted by the
2 Resource Information Data Model The data model used in our work is based on the GGF proposed GLUE schema v8 as of October 2002 [2]. The GLUE schema defines entities representing clusters, subclusters, hosts, processors, jobs, and computing Elements to name a few (see Figure 1.) Through the process of talking to managers of production high performance computing systems, we decided to extend the GLUE schema with entities representing people, user accounts, and communication channels between machines. Since taking the snapshot of the GLUE schema, 1
GLUE schema, a relation between two entities is represented mately 30000 objects). The Host table describes all hosts, or as a separate collection. The distribution of instances among individual computers, served by the grid resource information the entities shown in Figure 1 are given in Table 1 for a sam- repository. pling of the entities. Indexing. Query response times are often dramatically imCollection Number of Objects proved when indexes are used. Indexes provide fast access for Cluster 20 queries that request indexed attributes. Our query set includes UserAccounts 60 one index pair, that is a pair of queries wherein the indepenComputingElement 110 dent variable is whether or not the requested value is indexed. Subcluster Application Connection Host
340 600 12000 29520
Selectivity. The selectivity of a query is the number of objects returned. According to DeWitt [1], coverage of the performance domain can be achieved with queries that return 1 tuple, 1% of tuples, and 10% of tuples. These queries execute over the Connection table which contains information about 12000 active network connections.
Table 1: Object distribution for the major collections.
3 Grid Resource Benchmark/ Workload
Joins Joins occur when a user requests information that resides in more than one table. Joins can occur either across tables, or as multiple joins over a single table. The latter is called a self-join and occurs when a user asks for more than one instance of a particular resource. For instance, a user is seeking a subcluster wherein the needed software environment exists, the job owner has an account, and the binary is resident. The purpose of this query is not to test a different aspect of a system, but to ask a realistic, grid related question; one that might be posed by a scientist desiring to find a specific set of nodes on which her binary can and is allowed to execute.
The kinds of queries and updates issued against a grid resource repository can vary widely, limited only by the user’s knowledge of the query language, the expressiveness of the query language, and limitations of the underlying implementation. Our goal is to provide a synthetic database workload that is both broad and representative of actual workloads so as to accurately assess the strengths and weaknesses of different grid resource information repositories. The synthetic database workload that we developed consists of 16 queries and updates and four scenarios. The queries/updates are grouped into five major categories: scoping, index, join, selectivity, and base operations; the grouping is for purposes of ease of understanding. Over half the queries are paired for purposes of testing the presence or absence of a feature (e.g., an index). Features not undergoing testing are controlled across the pairs. The following are those query groups.
Other Operations. The two final queries in the benchmark are connection request and update request. Connection request is a request to the database that consists only of a connection request followed immediately by a disconnection request. Update updates a single attribute in a set of objects that match a particular condition.
Scoping. A scope defines a starting point for a search. It is relevant in schemes having a nested or hierarchical organization. By stating the starting scope of a query, (i.e., starting point in a tree), one can restrict query evaluation to a particular subtree. As this often results in increased efficiency in hierarchically organized data, scoped queries should perform well in hierarchal databases (i.e., MDS2, Xindice.) The ’scoping’ queries consist of two pairs of queries (four queries in total.) The first pair tests over a smaller object collection and the scope is set at one level above the desired objects. Specifically, the scoped query asks for all subclusters for a given cluster whereas the non-scoped query asks for the subclusters directly. The subcluster table is of moderate size, that is, 340 objects. The second scoping query spans three levels of the ComputingElement-Cluster-SubCluster-Host hierarchy to retrieve information from the much larger Host table (approxi-
Scenarios. A scenario is a scripted synthetic workload issued over a controlled time duration consisting of concurrent query and update requests. Scenarios are a key part of the benchmark as they expose the sensitivity of query response time to increasing update rates. Scenarios will be described in detail in Section 4.
4 Performance Evaluation In the performance evaluation we undertook the application of our synthetic query benchmark/workload to three database platforms: mySQL 4.0, Xindice 1.1, and MDS 2 (GT 2.2.) MySQL is configured with the InnoDB back end. InnoDB tables support foreign keys, provide ACID properties, rowlevel locking, and non-locking read in SELECTS for increased concurrency and performance. Xindice 1.1 is an XML open 2
Scoped Query Results
source database. Unlike Xindice 1.0, which was a standalone server, 1.1 is bootstrapped from an Apache Tomcat server. MDS2 is configured as a single GRIS talking to a single GIIS with GRIS and GIIS co-located on the same dual processor server. All queries are issued against the GIIS. The underlying hardware for all three databases is a dual processor Dell Poweredge 6400 Xeon server, 2GB RAM, 100 GB Raid 5, RedHat 7.3. The client platform is a Sun Blade 1000, SunOS 5.8; access is through switched Fast Ethernet. Each database is implemented as a standalone server and the client scripts are standalone clients on a separate machine. Consistency across the databases is ensured so that a query issued against a relational database that returns 1000 tuples will also return 1000 documents when issued against the Xindice database. To ensure this consistency, the databases are populated in a chained fashion starting from a single Perl script used to create tables and indices in mySQL then to populate the tables. Both Xindice and MDS2 are populated with data from mySQL database. To populate Xindice, a script reads data from a dump of the mySQL database and inserts data into Xindice collections. As for MDS2, a PHP script reads data directly from mySQL database and puts those data into a LDIF file which is the format recognized by LDAP. Then a simple provider external to MDS reads the LDIF file and pipes the file to the stdout pipe on which the GRIS is waiting. This chaining has proved to be extremely useful when the databases needed upgrading or when a consistent state needs to be restored.
Avg. Response Time (ms)
10000
MySQL Xindice MDS2
1000
100
10
0 scoped nonScoped scopedHosts nonScopedHosts
Query Name
Figure 2: Scoped: scoping limits a search to a particular subtree. Hierarchical databases should show good results for scoped queries (but not non-scoped.)
native index support of openLDAP [3] but instead employs a cache in the GIIS and serves requests from cache. Hence there is no difference between the indexed and non-indexed queries for MDS. Due to difficulties in getting data to stay in the GIIS caches, the MDS numbers shown are all satisfied out of cache. Our solution is to give the cached data objects extended times to live; this was required in order to get the queries to not fail as objects disappeared. Index Query Results MySQL Xindice MDS2
100000
10000
Avg. Response Time (ms)
4.1 Query Response Time Query response time is a measure of the amount of time it takes for a server to complete a query request and return the result set. For the queries in the benchmark (not scenarios), since query scripts are nonthreaded and blocking, a script executes one query at at time. The query response times, captured in Figures 2 through 6, show results organized by the query groups described in Section 3. Listed across the X-axis of each are the individual queries and their results for the three different platforms. If a query is part of a binary pair, its pair resides to its right and is prefaced with ’non’. The Y-axis plots query response time in milliseconds. It is important to note that the Y-axis scale is logarithmic. We are surprised by the scoping results shown in Figure 2. Scoping should favor hierarchical databases because scope limits the search space. This is not the case with Xindice for nonScopedHosts. What appears to be overshadowing the benefits of scope is the number of XPath queries that must be issued to the database in order to implement one higher level query. From results reported in [4], we observed a linear correlation between the number of XPath queries that must be issued per query and the query response time. The indexed results of Figure 3 show a clear benefit of using index support in mySQL and Xindice. MDS2 does not use the
1000
100
10
0
indexed
nonIndexed
Query Name
Figure 3: Indexed: indexed is a query over an indexed attribute; nonIndexed queries over a non-indexed attributes. Data repositories that employ indexes, mySQL and Xindice in this case, should perform significantly better for an indexed query than a nonindexed one. MDS uses a cache instead of indexes.
Selectivity is defined as the number of objects that satisfy a query. From the measurements shown in Figure 4, we can conclude that query response time is not sensitive to number of objects returned for both mySQL and Xindice. The join queries shown in Figure 5 measure a repository’s ability to assemble a result from numerous collections. The results of the two queries are roughly the same, which is reasonable since both queries touch the same number of collections. An interesting observation can be made by comparing the 3
Update/Connect Query Results
join results in Figure 5 with the selectivity results of Figure 4. The join queries take on the order of 2.5 ms for mySQL whereas selectivity1, on the other hand, completes in 53.24 ms. Similarly for Xindice, joins finish in approximately 1000 ms whereas selectivity1 completes in 38,572.33 ms. The reason is that though the joins are over six collections, the collections are small, on the order of hundreds of objects. The collection over which the selectivity queries are executed contains 12,200 objects. The results indicate that collection size impacts performance more than does number of joins.
MySQL Xindice MDS2
Avg. Response Time (ms)
1000
100
10
0
update
connect
Query Name
Figure 6: Other: Update modifies a single attribute in a subset of a collection. In MDS2 updates through the query interface are disabled so this query is not able to capture update time. connect connects to the database, disconnects and returns.
Selectivity Query Results 100000
MySQL Xindice MDS2
Avg. Response Time (ms)
10000
1000
100
10
0
Scenarios. The scenarios are scripted synthetic workloads designed to capture the sensitivity of query response time to update load. The scenario, as depicted in Figures 7 begins with the execution of three concurrent query streams. This is Phase I. Phase II starts three minutes into the run when update threads start up. In the case of mySQL, ten to fifty update threads are started. In the case of Xindice, given its exhibited poor update rate, only three update threads are run. In Phase III, the update threads are terminated and the query threads allowed to run through until the end of the run. As mentioned in the caption of Figure 6, MDS2 does not support updates through the traditional client query interface. As such, we forced updates for purposes of the scenarios by issuing a client query that queried a single attribute that has a short time to live. In that way, every time the query is executed, it forces the value to be updated through the provider mechanism (i.e., LDIF file piped to stdout) described in paragraph three of Section 4.
selectivity 1 selectivity 1% selectivity 10%
Query Name
Figure 4: Selectivity: selectivity is number of objects returned from a query. Selectivity 1 returns one query from a collection of 12,200 objects; selectivity 1% returns 1%; selectivity 10% returns 10%. The three queries together give an indication of the sensitivity of query response time to number of objects returned.
Join Query Results MySQL Xindice MDS2 Avg. Response Time (ms)
1000
100
10
0
In the Scenario shown in Figure 7, the impact of update streams is observable in all three cases. MySQL average query response times are 2-10 millisecond range when no update threads are running, and increase to 10-100 milliseconds under the update load. Xindice varies between 1000-2000 milliseconds when no update threads are running and 2000-4000 milliseconds when they are. MDS2 results fall between that of mySQL and Xindice, but the reader is asked to note that the MDS scenario is run on a database that is significantly smaller (95% smaller) than the database size used for the other platforms. We expect response times to be slower by an order of magnitude or more when applied to a full sized database. The failure of the MDS2 curve to taper down at the end of the scenario could be due to a lingering effect of rapid cache refresh being triggered for the particular attribute after the query request has terminated.
manyRelations
jobSubmit
Query Name
Figure 5: Joins: manyRelations touches six different collections in evaluating the query. JobSubmit also touches six collections in asking a realistic job-related question.
The update times shown in Figure 6 are for simple, oneattribute updates. Thus they show an upper bound on the rate at which a database can accept updates. For mySQL this rate is 41 updates per second whereas for Xindice the rate is 0.2 updates per second. The low update rate for Xindice is an overriding factor in the conclusion we draw that Xindice is generally inappropriate as a platform for a grid resource repository. It also explains the odd behavior shown in the scenarios discussed next. 4
5
larity decomposition of attributes in the GLUE schema. For instance, Processor, Operating System, and MainMemory are separate objects. This finer granularity has the advantage of reducing the size of a database by eliminating redundancies, but for hierarchical languages like XPath and LDAP, it comes at a cost of additional queries.
10
4
Response Time (milliseconds)
10
3
10
2
10
Description 1
10
0
10
scoping indexing selectivity joins
MySQL Xindice MDS2 0
2
4
6
8
10
12
Total Time (minutes)
Figure 7: Scenario: Average query response time of three simple queries on small collections, with no overlap in access. MDS2 response times are obtained on a database that is significantly smaller (5%) than the others. Scenarios show sensitivity of query response time to rapid updates.
mySQL 4.0 (KB) 0.4 - 46.0 9.5 - 11.0 0.04 - 52.9 0.03 - 0.03
Xindice 1.1 (KB) 7.5 - 549.5 139.8 - 140.9 0.48 - 691.0 40.1 - 131.8
MDS2 (KB) 5.6 - 47.3 9.6 - 24.0 0.03 - 267.0 0.98 - 1.9
Table 2: Minimum and maximum number of bytes returned per query group. The MDS numbers are estimated from smaller database sizes so are shown in italics. Description scoping indexing selectivity joins
4.2 Ease of Use The ease of use metric attempts to capture the less tangible aspects of performance of a grid information service, in particular, the amount of work a client must undertake in order to obtain desired information. That is, the number of queries that a user must issue, and the amount of processing required on the returned data that falls upon the user. Though more difficult to quantify, ease of use is an important metric not only for assessing the friendliness of a grid resource information repository, but for obtaining early understanding of the workload a service might encounter when under intense load in production use. For instance, if one service can respond with the exact data set in one request, and a second server requires an exchange of six request/response sequences before the exact data set is received at the client, the former will scale better under increased workloads. The metrics used to quantify ease of use are number of bytes returned and number of queries needed in order to retrieve the requested data. These numbers, shown in Tables 2 and 3, are not independent. Database platforms requiring more queries to obtain data correspondingly return a larger number of bytes. The problem could lie in limitations in the database platform or in the query language that the platform supports. For instance, a hierarchy of collections in Xindice must be searched one collection at a time; that is, by issuing one XPath query per level. If the client were interested in all subclusters belonging to the cluster “titan”, it would have to issue a query to search the ClusterSubcluster relationship to retrieve all documents for which “titan” is a parent cluster. The client would then for each document process it to extract the subcluster ID and issue a second query to retrieve the processor ID from the Processor table. The problem is exaggerated somewhat by the finer granu-
mySQL 4.0 1 1 1 1
Xindice 1.1 3 2 1 6
MDS2 3 1 1 5
Table 3: Maximum number of queries issued to database per higherlevel query.
5 Conclusions and Future Work We are in the process of making the benchmark accessible via a portal so that others can utilize the results. This future work can be of broader practical benefit to the Grid community by tailoring the benchmark to a common subset of the schema that is supported by multiple sites. Then it would be possible to use the benchmark for exploratory queries to a grid information server to assess its current load.
References [1] D. Bitton, D. DeWitt, and C. Turbyfill. Benchmarking database systems: A systematic approach. In Proceedings of the 9th Conference on Very Large Databases, Morgan Kaufman pubs. (Los Altos CA), Florence, 1983. [2] DataTAG. Glue schema: common conceptual data model for grid resources monitoring and discovery. 2003. [3] OpenLDAP Organization. Openldap. [4] Prajakta Vaidya and Beth Plale. Benchmark of xindicee as a grid information server. Technical Report TR-585, Computer Science Dept., Indiana University, 2003.
5