Information Scent as a Driver of Web Behavior Graphs: Results of a Protocol Analysis Method for Web Usability Stuart K. Card, Peter Pirolli, Mija Van Der Wege, Julie B. Morrison, Robert W. Reeder, Pamela K. Schraedley, Jenea Boshart Xerox Palo Alto Research Center 3333 Coyote Hill Road Palo Alto, California USA +1 650 812-4000 {card,pirolli,vdwege,morrison,rreeder,schraedl}@parc.xerox.com,
[email protected] ABSTRACT
The purpose of this paper is to introduce a replicable WWW protocol analysis methodology illustrated by application to data collected in the laboratory. The methodology uses instrumentation to obtain detailed recordings of user actions with a browser, caches Web pages encountered, and videotapes talk-aloud protocols. We apply the current form of the method to the analysis of eight Web protocols, visualizing the structure of the interaction and showing the strong effect of information scent in determining the path followed. Keywords
Information foraging, information scent, Web usability, protocol analysis, Web-EyeMapper, WebLogger, Web Behavior Graph. INTRODUCTION
The development of predictive scientific and engineering models of users’ cognition and interaction with the World Wide Web (WWW) poses some tough and interesting problems. Cognitive engineering models, such as GOMS [2], fit user interaction with application software (e.g., word processors) when error rates are small, tasks are well-structured, exploration is virtually nonexistent, and content is not a major determinant of behavior. Typical interactions with the WWW, on the other hand, are very likely to involve many impasses, ill-structured goals and tasks, navigation and exploration, and substantial influences from the content that is encountered. In this paper we present an approach to the analysis of protocols of WWW use that is aimed at capturing these phenomena and that is aimed towards the development of predictive models that are of use in science and design. The purpose of this paper is to introduce a replicable WWW protocol analysis methodology illustrated by Permission to make digital or hard copies of all or part of this work for personal or classroom use is granted without fee provided that copies are not made or distributed for profit or commercial advantage and that copies bear this notice and the full citation on the first page. To copy otherwise, or republish, to post on servers or to redistribute to lists, requires prior specific permission and/or a fee. SIGCHI’01, March 31-April 4, 2001, Seattle, WA, USA. Copyright 2001 ACM 1-58113-327-8/01/0003…$5.00.
application to data collected in the laboratory. To support replicability and reuse, we are developing a bank of ecologically valid WWW tasks and a WWW Protocol Coding Guide, which will be available on the WWW. As side ventures, we have developed prototypes of tools for instrumenting, coding, and visualizing WWW interactions. We have framed our coding methodology with an eye towards developing a computational model of information foraging on the WWW that extends our earlier theory [11]. Here we present some of the assumptions we have made about cognitive representations and processes in WWW interaction. Most, if not all, of these assumptions have come from information foraging theory. Logfile Analysis
It is relatively easy to collect usage data at WWW servers, and with small effort one may instrument a browser client to log user and system actions. Because such server and client logs of user and system behavior are easy to collect, they provide the source for many analyses of WWW interaction. For instance Catledge and Pitkow [3], did some early descriptive analysis of WWW surfing, Tauscher and Greenberg [17] analyzed revisitation patterns based on log file analysis, and Hodkinson, Kiel, and McColl-Kennedy [6] developed a graphical methods to analyze WWW consumer behavior. Our own lab has developed user path analysis routines [13] and user flow models [4] from log file analysis. These click-stream analyses are informative because of the sheer volume and breadth of data available. They do not, however, provide any trace of the moment-bymoment cognition that occurs between user clicks. If we are interested in developing detailed models of such moment-by-moment cognition—for instance, to better understand how peoples’ goals evolve, how people perceive and process the contents of WWW pages, how and why they make surfing decisions, and so on—then progress will be accelerated by having more detailed data traces of that cognition. This was one of the main
motivations for the development of verbal protocol analysis in cognitive psychology [10]. Analysis of Tasks
Protocol analysis of videos of a day-in-the life study was performed to catalog and provide descriptive statistics for WWW tasks by Byrne, John, Wehrle, and Crow [1]. The day-in-the-life study required users to turn on a video camera each time they used the WWW in their everyday routine. Interestingly, Byrne et al. found that the majority of users’ time was spent reading content, which was not given a more refined analysis. Information Foraging Theory
Information foraging theory [11] is an approach to understanding how user strategies and technologies for information seeking, gathering, and consumption are adapted to the flux of information in the environment. The framework borrows from biology, and especially from the field of optimal foraging theory [16]. Information Patches. The task environment of an information forager often has a “patchy” structure. Information relevant to a person’s information needs may reside in piles of documents, file drawers, bookshelves, libraries, or in various on-line collections. Often the information forager has to navigate from one information patch to another—perhaps from one WWW site to another, or from one search engine result to another. The person is faced with decisions such as the allocation of time among patch foraging tasks. Information Scent and Information Diet. Information foraging often involves navigating through spaces (physical or virtual) to find high-yield patches. For instance, imperfect information at intermediate locations is used by the forager to decide on paths through a library or an on-line text database to target information. Such intermediate information has been referred to as “residue” by Furnas [5]. In keeping with foraging terminology, we have called this scent. Information scent is the (imperfect) perception of the value, cost, or access path of information sources obtained from proximal cues, such as WWW links. For example, on a Web page, information scent may be delivered by link descriptors, images, contextual clues, such as preceding headings, or by page arrangement. Our notion is that the proximal perception of information scent is used to assess the profitability and prevalence of information sources. These scent-based assessments inform the decisions about which items to pursue so as to maximize the information diet of the forager. Our protocol analysis methodology is aimed in part at codifying information scent, and we will analyze the effects of information scent on WWW behaviors. WEB BROWSING STUDY METHOD
The main purpose of this experiment was to collect data relevant to the identification of the foraging methods employed by users on some simple but typical tasks.
Another purpose was to develop instrumentation and methodology for studying Web and other informationintensive tasks. The WWW Task Bank
To develop the methodology, we have attempted to work with a set of ecologically-derived tasks as described below. The day-in-the-life study of Byrne et al (1999) illustrates one method for collecting realistic, ecologically valid data. It is limited, however, in the rate at which one can catalog such tasks. There are also questions about the representativness of the tasks (i.e., how many other users in the world perform the same tasks) and whether or not one can repeatedly study the same task with other users. We decided to take another tack: To develop banks of WWW tasks that come from users out there in the world, which we can translate into the laboratory. The Graphics, Visualization, and Usability Center (GVU) at Georgia Institute of Technology has conducted ten online surveys assessing Internet demographics and usage patterns. From October 10 through December 15 of 1998, the following question was posted on the Web and Internet Use subsection of the questionnaire: "Please try to recall a recent instance in which you found important information on the World Wide Web, information that led to a significant action or decision. Please describe that incident in enough detail so that we can visualize the situation." There were 2188 usable responses to the survey question along with their accompanying demographics. Three taxonomic classifications focusing on the Purpose of people’s search on the Web, the Method people use to find information, and the Content of the information for which they are searching were developed [8]. Participants
Data were collected from fourteen members of the Stanford University community, mean age 23, half female. Nearly all participants reported using the Web daily. Participants were excluded if we were unable to track their eye movements. Tasks
Based on the responses to the survey question discussed above, we identified finding information as one of the three primary reasons for search on the Web. Six find information tasks were generated using responses to the survey question. The following is one participant’s response to the survey question: “Searched for and found (Using Yahoo Canada) a comedy troupe web site to copy their photo for a poster to be printed and distributed locally for an upcoming community event.” Our experimental task (nicknamed CITY), based on that response, is as follows: You are the Chair of Comedic events for Louisiana State University in Baton Rouge, LA. Your computer has just
crashed and you have lost several advertisements for upcoming events. You know that The Second City tour is coming to your theater in the spring, but you do not know the precise date. Find the date the comedy troupe is playing on your campus. Also find a photograph of the group to put on the advertisement.
Each task was continuously displayed on screen to the user in a window to the left of the Internet Explorer browser. All participants completed all six tasks. The tasks were administered in random order. Participant and Task Selection Criteria
The current analyses examine the data from four out of 14 participants on two of the six the experimental tasks, the previously-described CITY task and a task named ANTZ (in which users were to find four posters from the movie Antz). The following criteria were used to select the two tasks and the four participants: (1) mean completion time close to the median of mean completion time for all tasks, (2) variance close to the median of completion time variance for all tasks (3) nearly intact data for four participants. Procedures
Participants were given an introduction explaining the purpose of the study. The think-aloud procedure was explained and demonstrated, and participants were given several brief practice problems in order to get used to this procedure. Participants were encouraged to conduct their search as they would typically, except they were instructed not to spawn additional windows, even if they would normally, due to the usage of the WebLogger software. The first question was then brought up on the screen and participants began their search. If participants were silent for a period of time, they were reminded to think aloud. If they were still working on a task after 10 minutes, they were given a hint by the experimenter, but the task was counted as a failure. The experiment lasted approximately ninety minutes. Instrumentation
Our instrumentation package consists of: •
A program called WebLogger [14] that tracks user keystrokes, mouse-movements, use of browser button, (BEFORE-NAVIGATE (DOC-MOUSEMOVE (NAVIGATE-COMPLETE (EYETRACKER-SYNC (DOCUMENT-COMPLETE (SCROLL-POSITION (DOC-MOUSEMOVE (DOC-MOUSEMOVE (DOC-MOUSEMOVE (EYETRACKER-SYNC (CHAR (EYETRACKER-SYNC (DOC-KEYPRESS
and actions by the browser application. An example of the WebLogger output database is presented in Figure 1 and caches all the Web pages visited by a user. •
An ISCAN RK-426PC eyetracker that outputs eye point-of-regard data.
•
A program called Web-EyeMapper, that inputs eyetracker and WebLogger outputs and outputs a database of all the elements of WWW pages visited by eye fixations
•
Video taping of users as they think aloud while performing a task. The video is focused on the screen.
Protocol transcription
The different sources of data were combined into a protocol (see Figure 2). A protocol transcript contains: the URL of the currently displayed Web page, an image of the Web page on the screen, the times for selected events, derived from the WebLogger file, a transcript of the user’s verbal utterances, appropriately segmented, and interpretive encoding of the events. Eye movements and mouse movements are superimposed over the web page using a novel visualization that inserts timing labels every second. This allows the chronometric relationships between eye and mouse movements to be seen. In Figure 2, at second 231, the user is looking at a name on the list of posters as she begins to move the mouse to the search box. Eye and mouse coincide on the search box at second 233, whereupon the user begins typing ‘antz’. At second 235 the user looks at the search button. The mouse arrives there at second 236 and clicks the search button. ANALYSIS AND RESULTS Information Structure
The information space of the Web is distributed into patches. Patches (a) decompose into other patches, forming a hierarchy, and (b) vary along many dimensions, and consequently we expect patches to be like other “natural kinds” category structures that are defined by family resemblances. The following are some of the
(http://altavista.com/ ) 105.331s (881 122 ) 105.431s (http://www.altavista.com/)105.632s (103 ) 106.242s (http://www.altavista.com/)106.773s (0 0 759 1181 ) 106.853s (874 123 ) 107.024s (874 123 ) 107.044s (874 123 ) 107.214s (104 ) 107.244s (a 874 123 ) 108.125s (105 ) 108.245s (a INPUT ) 108.446s
Figure 1. WebLogger event file fragment.
0.100s 0.100s 0.201s 0.610s 0.531s 0.080s 0.171s 0.020s 0.170s 0.030s 2.904s 1.001s 0.201s
951763010 951763010 951763011 951763011 951763012 951763012 951763012 951763012 951763012 951763012 951763013 951763013 951763013
10:36:50) 10:36:50) 10:36:51) 10:36:51) 10:36:52) 10:36:52) 10:36:52) 10:36:52) 10:36:52) 10:36:52) 10:36:53) 10:36:53) 10:36:53)
URL
Observed Actions & Transcript
http://www.123posters.com/
230.191 230.842 232.555 233.777 234.638 236.891
Let’s see what they’ve got for me. Woah! Search for Antz.. (SCROLL) (MOVE-MOUSE) (MOUSE-CLICK SearchBox) (TYPE: antz) (MOVE-MOUSE) (MOUSE-CLICK SearchButton) Mmm, what are we gonna get?
Model Interpretation
(O*SEARCH SITE 123posters.com null “Antz”)
Figure 2. Protocol fragment. (See color plate on page 000.) meaning that can be assigned a truth value). In practice, these are small collections of English words and phrases that could be used by a cognitive operator (for instance in judging the relevance or utility of a link).
patches we have identified (depicted schematically in Figure 3): •
Web. This is included for completeness. Goals are often specified in terms of locating information or searching the entire web.
•
Web site. Users often seek out a particular Website (e.g., Amazon.com), then search within it. Websites are the large patches in Figure 3. Some specific subclasses are: Index (portal) sites and Searchengines.
•
Page. A page (white rectangles or circles in Figure 3) can be thought of as a patch containing link descriptors (textual or image-based), contentelements, and other elements. They may also contain some additional patchy structure, such as sidebars and other groupings, or regions, but we do not distinguish these for the moment. Because pages are the universal structure for accessing content on the Web, they have the various subclasses: Website entry page, Index page, Search engine page, Hitlist page. Foraging on a page for link descriptors and contentelements is done by a combination of visual search and scrolling.
Within the patches, there are: •
Content-elements. It is the content that is the end point of the foraging. The consumption of content provides the reward for foraging. In theory, we assume that the smallest elements are equivalent to propositions (by definition: the smallest elements of
In addition, there are several kinds of elements that serve as specifiers of pages. Search for content elements can proceed by search through spaces composed of sets of these elements. •
Link descriptors give information about a URL (that is to say, a page). Content links lead to pages that contain content, but category links lead to pages containing other links (index pages).
•
URL. In addition to the implicit role that URL’s play when users click on link descriptors, users can also manipulate them directly, by typing them into the browser.
•
Keyword. List of words and control modifiers of words that can be can be turned into pages by a search engine.
Users are always deciding whether to search within a patch (e.g., visual search within a page) or to traverse between patches (e.g., by clicking a link). Problem Space Structure
The user is analyzed as working in a problem space [9][10]. A problem space is defined by a set of states, a set of operators for moving between states, an initial state, a goal state, and a current state. In our protocols, we saw evidence of four problem spaces (Table 1): a URL
Boolean operators or quotation marks or + to the words to modify the search. To simplify, we have again represented moves in the space by a single operator S.
NETSCAPE SECOND CITY
•
LOUISIANA STATE UNIVERSITY
Figure 3. Hierarchical patches. (See color plate on page 000.)
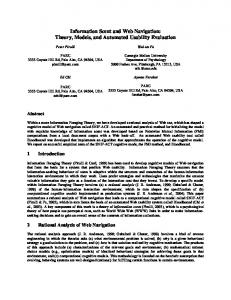
Figure 4 shows the behavior of four users in our study, each performing two tasks. The behavior is plotted as a Web behavior graph (WBG) generated automatically from the WebLogger file so as to visualize the behavior. A Web behavior graph is a version of a problem behavior graph (Newell and Simon, 1972). Each box in the diagram represents a state in one of the problem spaces. Each arrow depicts the execution of an operator, moving the state to a new state. Double vertical arrows indicate the return to a previous state, augmented by the experience of having explored the consequences of some possible moves. Thus time in the diagram proceeds left to right and top to bottom.
problem space, a link problem space, a keyword problem space, and a visual search space. In order to keep the analysis simple, we have deliberately used simple operators to define these spaces, even though they are capable of greater articulation. We have also for the moment avoided the complications of history lists and bookmarks, although these can be readily added to the analysis. •
States in the URL problem space consist of the set of all legally-formed URL’s. Moves in the problem space consists in typing or editing a new URL into the browser, (operator TU).
•
States in the Link problem space are also URLs. But moves in this problem space consist of clicking on a link descriptor, whether textual (CL) or imaginal (CI) or hitting the Back button (B).
•
States in the Keyword problem space are the set of all word lists that can be typed into a search engine and the number of hits associated with each. This includes expressions of the word made by adding
States in the Eye-movement space consist of the set of visible objects and the point of regard. Moves consist of saccades of the eye from position to position in the space to search for information (accompanied by content consumption activities by the eye—that is to say, reading—when it encounters information prey). Other moves are scrolling the display so as to change which elements are visible. In this paper, we do not discuss further the complicated task of visual search. The reader is referred to [12] for discussions of visual search made with our analysis tools.
The WBG is particularly good at showing the structure of the search. Color surrounding the boxes in the diagram represent different Web sites. Oval boxes are distinguished so as to show hit lists from a search. An X following a node indicates that the user exceeded the time limits for the task and that it was therefore a failure. A loop has been drawn around the problem spaces, showing how the users pass from one problem space into another as the operators in one become less effective.
Table 1. Problem spaces for Web search. URL Problem Space
Link Problem Space
Keyword Problem Space
Visual Search Space
URLs
URLs
Word Lists
Visible objects, Point of regard
[TU] TYPE-URL
[CL] CLICK LINK
[S] SEARCH-ON-WORDS
Eye-movement
States
Moves
Scrolling
[CI] CLICK-IMAGE [B] BACK S
Example
TU
www.antsthemo vie.com
TU
www.google.com
CL
www.antz.com
CL
www.antz.com /home.htlm
CL
Posters and prints
Movie Memorabilia
www.antz.com /antzstore
Movie Memorabilia Movie Memorabilia
S
S
Antz
Antz + Posters
S1
S2 S2
S3 S8
S4 S9
S5 S10
S6
S1-ANTZ
S7
S1
S2
S3
S4
S5
S6
S11
S7
S8
S7
S9
S1-CITY
S10 S9 S8
S12
S8
S12
S8
S13
S14
S13
S15
Keyword problem space
Note:
S13 S8
S4
S16
S17
S18
S19
S20
S19
S20
• Colors indicate different Websites. • Darker nodes are pages with higher information scent
S19 S18
S1
S2
S3
S4
Link problem space
S5
S6
S5
S7
S5
S8
S21
S22
S21
S23
X
S6-ANTZ
S6-CITY S1
S9
S2
S3
S4
S3
St?5
S10
S6
S7
S8
S9
S8
S 10
S9
S 11
S 12
S8
S 12 S5
S8
S11
S12
S13
S 13
S14
S 12 S14
S 11 S2
S15
S1 S2
S1
S2
S16
S17
S16
S18
S3
S4
S19
S20
S7
S 10
X
S7-ANTZ
S5
S6
S5
S7
S8
S9
S8
S10
S5
S11
S12
S13
S1
S2
S3
S2
S4
S6
S8
S9 S9
S7
S16
S17
S18
S20
S21
S20
S22
S7
S6
S19
S15 S14
S7
S8
S6
S15
X
S7
S11 S14
S7
S7-CITY S5
S12
S5
S 10
S5
S 10
S 11
S 12
S 13
S4
S5
S6
S7
S8
S7
S9
S20 S14 S5
S11
S23
S11
S24
S11
S25
S26
S27
S28
S29
S30
S34
S35
S36
S35
S37
S31
S32
S27 S26
S1
S2
S3
S4
S5
S33
S6
S7
S8
S9
S6
S 10
S 11
S 12
X
S10-ANTZ S 13
S1
S2
S3
S10-CITY
Figure 4. Web Behavior Graphs for users in the study. Solid enclosing lines indicate that the states and operators are part of the Link problem space. Dotted lines enclose the keyword search problem space. Square dotted lines enclose the direct URL typing problem space. (See color plate on page 000.)
It should be noted that multiple Websites were used by all users on these problems, a geometric mean of 5.6 Websites for the ANTZ problem and 2.8 Websites for the CITY problem. There were many more transitions within a site than between sites. The ratio of within to between transitions was 2.1 for ANTZ and 5.2 for CITY.
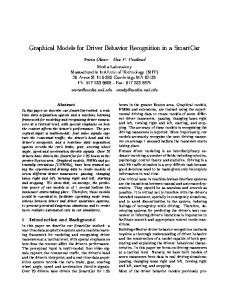
3 3- V isits (N =3)
2.5
2 Sce nt rating
It can readily be seen from Figure 4 that the ANTZ task is more difficult than the CITY task, since there are fewer successful solutions (25% vs. 75%), more nodes and more backtracking. The ANTZ problem requires an average of 21.7 unique states vs. 9.8 for the CITY problem (using the geometric mean) and each ANTZ problem requires more states than the corresponding CITY problem for the same user.
1.5
1
5-V isits( N =6)
0.5
0 Last-4
Last-3
Last-2
Last-1
L ast
A vg Next
Page vis it at s ite
Information Scent
One of the aims of a methodology should be to capture the signature phenomena of the objects of empirical study, and one of the aims of theory should be to explain those signature phenomena. Information scent appears to be one of the major controlling variables in Web foraging behavior. Two of the phenomena it gives rise to are: (a) the propensity of users to make their link choices based on the information scent of links (scent-following), and (b) the propensity of users to switch to another information patch (e.g., another site or a search engine) when the information scent of the current site becomes low (patch scent policy). These phenomena are not only evident in our protocols, but are known to the Web usability analysts [15]. Scentfollowing has been found to characterize behavior in other systems [4] and is the basis of Web usability guidelines (Scanlon, 2000). In the protocols, high and low scent seemed to be associated with user’s decisions to keep on a trail or to backtrack or change problem space based on spontaneous comments in the protocol. User remarks such as “that sounds promising” or “That’s what I want, ‘ANTZ’ movie posters” seemed to indicate high scent. Whereas “But there’s nothing on Antz” or “I think I’ll have more luck with the WebRing” seemed to indicate low scent. In order to have enough data to make a systematic analysis, however, a side experiment was run in which three judges rated the scent of a page (that is, the likelihood of finding the answer to the question by following any of the links on that page). They used the scale of No Scent (0), Low Scent (1), Medium Scent (2), or High Scent (3). The geometric mean of the judges ratings were taken to reduce the effect of outlying ratings. These ratings are plotted on a scale of white (0), light gray (1), medium gray (2) and dark gray (3) on the nodes of Figure 4. Inspection of the figure suggests that as information scent declines, users are more likely to backtrack.
Figure 5. Information scent as a function of distance from the last node before backtracking. To test this hypothesis in the aggregate, Figure 5 is a plot illustrating the patch scent policy in our data. From the protocols we identified segments where users sequentially visited three or more pages at a site (not a search engine or portal) and then switched to another site, search engine, or portal. We found N = 3 sequences of three-page visits at a site and N = 6 sequences of five visits to a site (no other sequence lengths were found). Each point in Figure 5 is the geometric mean of scent ratings of the visited pages produced by an independent panel of raters. Also plotted in Figure 5 is the geometric mean rating of the next page visited after leaving the site, and the geometric mean rating of all pages. When interpreting Figure 5, it is important to recall that the ratings form an ordinal scale and consequently the graph cannot be interpreted quantitatively (without additional assumptions). Figure 5 shows that initially the information scent at a site is high, and when that information scent becomes low, users switch to another site or search engine. We interpret this by elaborating information forging theory [7] with the notion of patch potential developed in optimal foraging theory and consistent with other models of Web surfing. The idea is that a user is assessing the potential rewards of foraging at a site based on information scent. So long as the potential rewards are above some threshold, then the user continues foraging at the site. When the potential rewards pass below that threshold, then the user moves on to another site. DISCUSSION
This paper has introduced a WWW protocol methodology and used it on the analysis of a study of users searching the WWW for information, a task derived from a task bank of tasks based on a Web survey of 2000 users. To go beyond what is known from analyses of Web Log URL sequences, the methodology uses instrumentation to
obtain detailed recordings of user actions, caches for later analysis of all Web pages encountered, and videotaped talk-aloud protocols to infer goals and intentionality. Data are analyzed through coding of integrated protocol displays, through automatically generated visualizations of the behavior such as the Web Behavior Graph, and through analyses of derived databases as a step toward accelerating evaluations of Website usability and the design of novel Internet systems. Using this methodology and this early study, the following picture for Web search tentatively emerges: 1. The space does seem to have somewhat of a patchy character. Many more transitions are within a site than across sites. This effect seems to be even more pronounced for an easy task than a hard task. And visual search within a page is less costly than transitioning between pages. 2. The search patterns of Figure 4 are clearly heuristic search. Thus, parts of the behavior are not GOMS-like. If the behavior was GOMS-like the then the search trails in the figure would be more like horizontal lines. Notice that for the easier task, the pattern is more linear and GOMSlike. This suggests that building improved systems could concentrate on two rather different operations: improvements to time limiting operators (e.g., accelerated reading/skimming and reduced response time)., that is, improvements assuming GOMS-like behavior. The second operation to concentrate on is reducing the extent of search (e.g., creating better information scent), that is, improvements assuming non-GOMS-like behavior. 3. The heuristic search is not just through a single problem space, but through a combination of perhaps four of them. The user reacts to an impasse in one problem space by quickly shifting to another. This suggests thinking if there might be more that might be invented. 4. In addition to backtracking in heuristic search, users also seem to go back to landmark pages, such as doing hub and spoke searching from a search engine hitlist. But there is no navigation mechanism built into the standard browsers to do this. 5. Finally, information scent seemed to play a central role in the searches of Figure 4 as confirmed by Figure 5. Dwindling information scent caused users to backtrack or switch problem spaces. These results are preliminary, but they do suggest that with this methodology we may be able to obtain insights into the structure of user behavior on the Web. ACKNOWLEDGMENTS
This work is supported by an Office of Naval Research grant No. N00014-96-C-0097 to Peter Pirolli and Stuart Card.
REFERENCES 1. Byrne, M. D., John, B. E., Wehrle, N. S., & Crow, D. C. (1999). The tangled web we wove: A taxonomy of WWW use. CHI ‘99, Conference on Human Factors in Computing System 9, 544-551. Reading, MA: Addison Wesley 2. Card, S. K., Moran, T. P., and Newell, A. (1983). The Psychology of Human-Computer Interaction. Hillsdale, N.J.: Erlbaum. 3. Catledge, L. and Pitkow, J. (1995). Characterizing browsing strategies in the world wide web. Third International World Wide Web Conference. 4. Chi, E., Pirolli, P. and J. Pitkow (2000). The scent of a site: A system for analyzing and predicting information scent, usage, and usability of a Web site. CHI 2000, Human Factors in Computing Systems. NY: ACM. 5. Furnas, G. W. (1997). Effective view navigation. CHI ’97, Human Factors in Computing Systems, pp. 367-374. 6. Hodkinson, C., Kiel, G., and McColl-Kennedy, J. R. (2000). Consumer web search behaviour: diagrammatic illustration of wayfinding on the web. Int. J. of HumanComputer Studies 52: 805-830. 7. McNamara, J., (1982) Optimal patch use in a stochastic environment. Theoretical Population Biology, 21: 269-288. 8. Morrison, J. B., Pirolli, P., and Card, S. K. (2000). A taxonomic analysis of what World Wide Web activities significantly impact people’s decisions and actions. UIR Technical report UIR-R-2000-17, Xerox PARC. 9. Newell, A. (1990); Unified Theories of Cognition. Cambridge, MA: Harvard University Press. 10. Newell, A. and Simon, H. A. (1972). Human Problem Solving. Englewood Cliffs, NJ.: Prentice-Hall. 11. Pirolli, P. and S. K. Card. (1999). Information foraging. Psychological Review, 106, 643-675. 12. Pirolli, P. Card, S. K., and Van Der Wege, M. (2001). Effects of information scent and information density in the hyperbolic tree browser. CHI 2001, ACM Conference on Human Factors in Computing Systems. 13. Pitkow, J. E. and Pirolli, P. (1999). Mining longest repeated subsequences to predict World Wide Web surfing. Second USENIX symposium on Internet Technologies and System. 14. Reeder, R., Pirolli, P., and Card, S. K. (2000). WebLogger: A data collections tools for Web-use studies. UIR Technical report UIR-R-2000-06, Xerox PARC. 15. Scanlon, T. (2000). On-site Searching and Scent. Report #10, UIE Reports. North Andover, MA. 16. Stephens, D. W. and Krebs, J. R. (1986). Foraging Theory. Princeton, N. J.: Princeton University Press. 17. Tauscher, L. M. and Greenberg, S. (1997). How people revisit web pages: empirical findings and implications for the design of history mechanisms. Int. J. of HumanComputer Studies 47, 94-137.