Informatization refers to the degree by which an area, an economy, or a ..... quality information online, and create their own materials (e.g. a national .... Ana Sekulovska received her BSc and MSc degrees from the Faculty of Education, ... Science, and the PhD degree in Computer Science from the Ss. Cyril and Methodius.
International Journal of Managing Public Sector Information and Communication Technologies (IJMPICT) Vol. 7, No. 4, December 2016
INFORMATIZATION LEVEL ASSESSMENT FRAMEWORK AND EDUCATIONAL POLICY IMPLICATIONS Ana Sekulovska and Pece Mitrevski Faculty of Information and Communication Technologies, University “St. Kliment Ohridski”, Bitola, Republic of Macedonia
ABSTRACT Seeing the informatization as a measure of the educational policy, we propose an informatization level assessment framework and introduce a composite indicator – Education Informatization Index, calculated as a weighted sum by applying the Rank-Order Centroid method for weight designation. Although it is made up of only two main categories (Educational Policy Implementation subindex and Educational Policy Creation subindex) and a total of six individual indicators, it captures well all the socio-political flows in the educational sphere in the Republic of Macedonia in the past five-year period. Namely, a slight decline of the value of the Education Informatization Index can be observed in 2013 in comparison to 2012, and in 2016 in comparison to 2015. Whereas only the value of the implementation subindex suffered in the first case, the value of the creation subindex suffered, as well, in the latter. Having in mind that policymakers can assess the improvement of a country over time, the methodology and the results can aid in making knowledgeable decisions or in establishing greater commitment to incorporating ICT into the education system.
KEYWORDS Information Technology, Informatization, Educational Policy, Education Informatization Index, RankOrder Centroid Method
1. INTRODUCTION Informatization refers to the degree by which an area, an economy, or a society as a whole, is becoming information-based, i.e., “enlargement of its information labor force” [1], whereas educational policy encompasses all the principles and policy-making in the educational domain, as well as the set of laws and rules that manage the operation of education systems [2]. Policymaking, in general, is an interdisciplinary activity that incorporates transformation of political decisions into real solutions that are implemented in the society. One of the crucial phases in the development of a new policy, or adjusting an existing one, is the process of adaptation and/or alteration of the legal framework on which the policy is implemented. Bringing about new legislation, or analyzing an existing one, should have one single starting point: effective address to the problems of a certain area for both the directly involved, and for the society as a whole. To achieve this goal, it is necessary to perform a comprehensive and detailed analysis, including internal and external circumstances of the problem being treated, to find regulatory and/or nonregulatory solutions, to make analysis of the parties involved, and most importantly, to determine the most favorable decision in terms of the economic justification for the decision [3]. The educational policy analysis, in particular, tries to find answers to the questions about the purpose of education, the goals (both societal and/or personal) that it is designed to accomplish, the methods for achieving them, and the tools for quantifying their success or failure. DOI : 10.5121/ijmpict.2016.7402
11
International Journal of Managing Public Sector Information and Communication Technologies (IJMPICT) Vol. 7, No. 4, December 2016
As national and local governments in developing countries work to implement policies and programs for integrating Information and Communication Technologies (ICTs) in education, a greater need has developed for assessing and evaluating how effective, efficient and transformative these technologies are in education [4]. Existing ICT policies should be revised to guarantee that they stimulate effective use of technology through the program of study, as well as support wider educational reforms. All the countries require a nationally unified informatization level evaluation index system that captures well the situation in the country, on one hand, and interrelates with the international community, on the other. Among the issues is whether “informatization” can be measureable opposite to the tangible products of industrialization, for example. Taylor and Zang [5] addressed the issues behind the boundaries of current theoretical models with regard to quantifying the “positive impacts of ICT projects”. Many international organizations, such as the United Nations’ World Summit on the Information Society (WSIS), the International Telecommunication Union (ITU), as well as the Organization for Economic Co-operation and Development (OECD) also identified this necessity and have placed initiatives to improve the methodologies for “measuring an information society” [6]. The remainder of this paper is organized as follows. Section 2 focuses on related work and identifies the main motivations. It addresses some important initiatives for measurement of the level of informatization as an ongoing area of development: the World Economic Forum’s Networked Readiness Index (NRI), the Global Networked Readiness for Education of the Berkman’s Center for Internet & Society at Harvard Law School and the Chinese Framework of National Informatization Indices. But, how can we know what our position is in the process of global informatization? What development strategies should be taken? In Section 3 we introduce our proprietary informatization level assessment framework, i.e. the Education Informatization Index (EII), and discuss its development procedure, weights designation and principal findings. Finally, Section 4 concludes the paper.
2. MOTIVATION AND RELATED WORK The World Economic Forum’s Networked Readiness Index (NRI), also referred to as Technology Readiness, measures the predisposition of countries to take the advantage of the opportunities offered by information and communication technologies (ICTs). It is published as part of their annual Global Information Technology Report (GITR) [7], which is considered “the most authoritative and comprehensive assessment of how ICT impacts the competitiveness and wellbeing of nations”. Similarly, in an effort to address some of the shortcomings of monitoring, evaluation, and data collection, and to provide insight for policymakers, the ICT for Education Program of the World Bank Institute and the Berkman Center for Internet & Society at Harvard Law School, with the support of the Education Development Center, launched a pilot research project in 2003 –Global Networked Readiness for Education [4], to directly solicit user experiences of ICTs in developing world schools. Eleven developing countries including Brazil, Costa Rica, El Salvador, the Gambia, India (state of Karnataka), Jordan, Mexico, Panama, the Philippines, South Africa, and Uganda participated in the study, selected on the basis of a combination of characteristics including geography (three African, one Middle Eastern, two Asian and four Latin American nations), income, language, population, ICT-education activity at the secondary education level, and presence of on-the-ground contacts. East Asian countries (i.e. South Korea [8], [9] and China [10], in particular) have worked on establishing a Framework of National Informatization Indices [11], which consists of six aspects: 12
International Journal of Managing Public Sector Information and Communication Technologies (IJMPICT) Vol. 7, No. 4, December 2016
1) Information resources, 2) National information network, 3) Application of information technologies, 4) Information technologies and industry, 5) Informatization talents, and 6) Policies, regulations and standards. They even propose a methodology for measurement and calculation of National Informatization Index Quantity (NIQ) [12] in order to conclude, for example, that “China’s NIQ in 2000 was 38.46, and the average NIQ growth from 1998 to 2000 was 21.9%”. Zhang [13] applies the Grey forecasting model from Grey theory to forecast precisely the informatization index of China and other countries from 2013 to 2020 and makes comparison among them. The findings provide a valuable starting point for governments in drafting relevant informatization policies. The following subsections provide insight into their basic building principles and major design guidelines.
2.1. Networked Readiness Index The Networked Readiness Index [7], introduced by the Information Technology Group at the Harvard University’s Center for International Development, pursues to better understand the “impact of ICT on the competitiveness of nations” and is a composite comprised of three components: • • •
the environment (market, political, regulatory, and infrastructure) for ICT; the readiness of the country’s key stakeholders (individuals, businesses, and governments) to use ICT; the usage of ICT among these stakeholders.
Four main categories (subindexes), 10 subcategories (pillars), and 53 individual indicators distributed across these different pillars, translate into a composite indicator – NRI: A. Environment subindex 1. Political and regulatory environment (9 indicators) 2. Business and innovation environment (9 indicators) B. Readiness subindex 3. Infrastructure (4 indicators) 4. Affordability (3 indicators) 5. Skills (4 indicators) C. Usage subindex 6. Individual usage (7 indicators) 7. Business usage (6 indicators) 8. Government usage (3 indicators) D. Impact subindex 9. Economic impacts (4 indicators) 10. Social impacts (4 indicators) A country’s overall NRI score is produced by combining subindex scores, which in turn are obtained by combining pillar scores. In a process of successive aggregations, the latter are obtained by aggregating individual indicators, about half of which are provided from international organizations. The main sources are the International Telecommunication Union (ITU), UNESCO and other UN agencies, and the World Bank – the rest of the NRI indicators are derived from the World Economic Forum’s Executive Opinion Survey, which is used to measure concepts that are “qualitative in nature” or for which internationally comparable statistics are not available for enough countries. For example, over 14,000 business executives in more than 140 countries participated in the compilation of the 2015 edition of the Survey. Thus, a country 13
International Journal of Managing Public Sector Information and Communication Technologies (IJMPICT) Vol. 7, No. 4, December 2016
profile sums up the performance of an economy in different dimensions of the Networked Readiness Index.
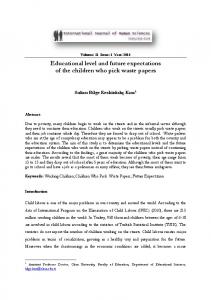
2.1.1. A Set of Education-Related Individual Indicators for the Republic of Macedonia A number of individual indicators (Figs. 1-4) show a slight decline in 2016 when compared to 2015. These include: • • • •
Importance of ICTS to gov’t vision (range 3.88-4.88 with a decline to 4.82 in 2016); Effectiveness of law-making bodies (range 3.36-4.22 with a decline to 4.20 in 2016); Internet access in schools (range 4.79-5.46 with a decline to 5.18 in 2016), and Quality of math & science education (range 3.90-4.44 with a decline to 4.30 in 2016).
The observed trend negatively affects both the creation and the implementation aspects of the educational policy in the Republic of Macedonia. Yet, another group of indicators (Figs. 5-7) demonstrate stagnation in 2013 when compared to 2012. These include: • • •
Int’l Internet bandwidth (range 16.8-41.8 kb/s per user); Availability of latest technologies (range 4.61-5.04 with a decline to 4.56 in 2013), and Quality of management schools (range 3.70-4.00 with a decline to 3.66 in 2013).
Figure 1. Importance of ICTS to gov’t vision
Figure 2. Effectiveness of law-making bodies
Figure 3. Internet access in schools
Figure 4. Quality of math & science education
The Quality of educational system, as a whole (Fig.8), shows a slight decline in 2013 when compared to 2012 (3.37 vs. 3.63), as well as in 2016 when compared to 2015 (3.82 vs. 3.96). 14
International Journal of Managing Public Sector Information and Communication Technologies (IJMPICT) Vol. 7, No. 4, December 2016
Altogether, they clearly speak about worsening in the implementation of the educational policy in 2013, in comparison to the preceding year. Biggest fluctuations in the past five-year period (Figs. 9-10) can be perceived in: • •
Secondary education gross enrollment rate (range 81.91-83.67), and Tertiary education gross enrollment rate (range 38.46-40.76).
Figure 5. Int’l Internet bandwidth, kb/s per user
Figure 7. Quality of management schools
Figure 9. Secondary ed. gross enrollment rate
Figure 6. Availability of latest technologies
Figure 8. Quality of educational system
Figure 10. Tertiary ed. gross enrollment rate
The E-Participation Index (Fig. 11) moves in the range 0.13-0.22, whereas the Government success in ICT promotion (Fig. 12) exhibits the biggest drop in 2016, when compared to 2015 (i.e. from 5.00 down to 4.87). The latter, once again, speaks about the lower level of commitment of educational policymakers in 2016. 15
International Journal of Managing Public Sector Information and Communication Technologies (IJMPICT) Vol. 7, No. 4, December 2016
Figure 11. E-Participation Index
Figure 12. Gov’t success in ICT promotion
At the first level of aggregation, four out of ten pillars (Figs. 13-16) show performance drop in both 2013 and 2016: • • • •
3rd pillar: Infrastructure (range 4.36-4.55 with the biggest drop down to 3.99 in 2013); 5th pillar: Skills (range 5.00-5.20 with the biggest drop down to 4.70 in 2013); 8th pillar: Government usage (range 3.90-4.41 with an obvious negative trend in the past couple of years and a drop from its maximum value down to only 4.05 in 2016), and 1st pillar: Political and regulatory environment (range 3.50-3.90 with a slight decline down to 3.85 in 2016).
Figure 13. 3rd pillar: Infrastructure
Figure 15. 8th pillar: Government usage
Figure 14. 5th pillar: Skills
Figure 16. 1st pillar: Political and regulatory environment
16
International Journal of Managing Public Sector Information and Communication Technologies (IJMPICT) Vol. 7, No. 4, December 2016
Figure 17. Environment subindex
Figure 18. Usage subindex
At the next level (Figs. 17-20), even though the environment subindex (range 3.95-4.41) and the usage subindex (range 3.68-4.16) increase continuously, two of the four subindexes of NRI speak about worse performance in both 2013 and 2016 in comparison to the preceding year: • •
The readiness subindex (Fig. 19) with the lowest value of 3.89 in 2013 and a decline from 5.26 down to 5.20 in the past year, and The impact subindex (Fig. 20) with the lowest value of 3.36 in 2013 and a decline from 3.93 down to 3.87 in 2016, as well.
Figure 19. Readiness subindex
Figure 20. Impact subindex
What is the value of the Networked Readiness Index (NRI) for the Republic of Macedonia and where is its place on the ladder of more than 140 ranked countries at the dawn of the Fourth Industrial Revolution? The NRI ranges between 3.89 and 4.42 with the lowest value in 2013 (Fig. 21), whereas the country continuously improves from the 66th place in 2012 up to the 46th place in 2016, with a temporary deterioration at the 67th place in 2013 (Fig. 22). According to the last Global Information Technology Report (GITR), the Republic of Macedonia makes company to countries like Italy, Slovakia, Turkey and Hungary (for comparison, the topmost ranked countries are Singapore and Finland with NRI value of 6.0).
17
International Journal of Managing Public Sector Information and Communication Technologies (IJMPICT) Vol. 7, No. 4, December 2016
Figure 21. Networked Readiness Index
Figure 22. Networked Readiness Index Rank
2.2. Global Networked Readiness for Education The Global Networked Readiness for Education project [4] pursues: • • •
to help school leaders and policymakers by gathering and analyzing preliminary data that evaluates the early impact of ICTs in education; to provide important resources that addresses the requirements and concerns of education leaders and policymakers in developing countries; and to prepare an initial report on ICTs and educational practice.
As of the beginning of this project, there were no good international datasets of cross-national statistical indicators relating to ICTs and Education. Country coordinators developed a list of potential participant schools according to project guidelines, whereas respondents groups included 3.768 students, 1.088 teachers, 121 lab supervisors and 126 heads of school. The procedure included: • • •
Development of survey tool questions Deployment of surveys: the respondents were asked to fill in the hard copies, and then enter the results using the survey’s web interface. Data collection: the electronically entered data was collected into a common database for further analysis.
Viewed from the perspective of educational policy implications, a host of issues arise from this analysis that policymakers need to take into account when designing and implementing ICT in education programs: •
•
•
•
Having a computer in the classroom has positive effects on improved skills and learning – while the most practical first step is a lab, policymakers need to make greater efforts to get the tools closer to the classroom and the teachers and students who work there. Clear integration of use of ICTs in the curriculum is important for their effective use in the classroom. It is not surprising that word processing and programming were highly valued uses of the computer as they have clear and direct benefits to enhancing work done in the curriculum. Getting computers into the hands of school heads and administrators is clearly a strong positive for further diffusion among the teaching staff and in turn more effective use of the technology for teaching and learning. Finally, content is the most important – policymakers need to make sure that training exists for teachers to develop information literacy skills to assist them to find and identify quality information online, and create their own materials (e.g. a national educational portal [14]). 18
International Journal of Managing Public Sector Information and Communication Technologies (IJMPICT) Vol. 7, No. 4, December 2016
2.3. Chinese Framework of National Informatization Indices Articles [10] and [11] discuss the design guidelines, as well as the design principles of measuring and evaluation of the higher education informatization index system in China. Then they compare the evaluation index system of education informatization and higher education informatization that have been in effect in their country, analyze their advantages and disadvantages, give suggestions of modifying the index system in empirical research, and promote improvement and development of higher education statistics work. According to [12], “informatization is an integrated system, with the extensive application of information technologies as its aim, information resources as its nucleus, information network as its basis, information industry as its pillar, information talents as its reliance, and regulations, policies and legal standards as its safeguard”. The National Informatization Evaluation Center (NIEC) is mainly responsible for the research on informatization index system, evaluation of informatization level (enterprise informatization, governmental informatization, E-Commerce, information resources, urban informatization, etc.), as well as consultancy services. The National Informatization Index Quantity (NIQ) can be calculated by the formula:
where n is the number of subindexes; m is the number of indicators of the ith subindex; wij and wi are the corresponding weights; pij is the normalized indicator value. The informatization indices system of China is based on a total number of 20 indicators.
3. INFORMATIZATION LEVEL ASSESSMENT FRAMEWORK: EDUCATION INFORMATIZATION INDEX (EII) Starting from the available indicators in the World Economic Forum’s Global Information Technology Report [7], and by following the methodology for calculation of the Chinese National Informatization Index Quantity [12], we propose a measure of the education informatization level in the Republic of Macedonia.
3.1. Development Procedure and Weight Designation Having in mind that the problem is observed through the prism of the educational policy and its two complementary aspects – a) creation and b) implementation, we introduce the Education Informatization Index (EII) as a composite indicator made up of 2 (two) main categories (subindexes) and 3 (three) individual indicators in each of them, rank-ordered in descending order: 1. Educational Policy Implementation subindex (weight w1) o 1. Quality of Educational System (normalized value p11, weight w11) o 2. Availability of latest technologies (normalized value p12, weight w12) o 3. Internet access in schools (normalized value p13, weight w13) • 2. Educational Policy Creation subindex (weight w2) o 1. Effectiveness of law-making bodies (normalized value p21, weight w21) o 2. Government success in ICT promotion (normalized value p22, weight w22) o 3. Importance of ICTs to government vision (normalized value p23, weight w23) Consequently, the Education Informatization Index (EII) can be calculated as a weighted sum by the formula: •
19
International Journal of Managing Public Sector Information and Communication Technologies (IJMPICT) Vol. 7, No. 4, December 2016
where: • • • • •
2 is the number of subindexes, wi is the weight of subindex i, 3 is the number of indicators for subindex i, wij is the weight of indicator j of subindex i, pij is the normalized value of indicator j of subindex i.
By applying the Rank-Order Centroid method, the subindexes and the indicators are listed in order from most important to least important, and the following formulas are used for assigning weights:
3.2. Principal Findings From Table 1 and Fig. 23, a slight decline of the value of the Education Informatization Index (EII) can be observed in 2013 in comparison to 2012 (3.94 vs. 4.02), and in 2016 in comparison to 2015 (4.37 vs. 4.39). At the lower level of aggregation, one can conclude that only the value of the implementation subindex suffered in the first case, whereas in the latter, the value of the creation subindex suffered, as well. Namely, in 2013, only the indicators that refer to the “Availability of latest technologies” and the “Quality of educational system” had lower values in comparison to 2012. Yet, in 2016, almost all the indicators comprising both the complementary aspects of the educational policy have deteriorated: “Importance of ICTs to government vision”, “Government success in ICT promotion” and “Effectiveness of law-making bodies” (on the creation side), as well as the “Internet access in schools” and the “Quality of Educational System” (on the educational policy implementation side). Table 1. Education Informatization Index (EII).
Weight wi
EDUCATIONAL POLICY CREATION 0.25
EDUCATIONAL POLICY IMPLEMENTATION 0.75
Importance of ICTs to government vision
Government success in ICT promotion
Effectiveness of law-making bodies
Internet access in schools
Availability of latest technologies
Quality of Educational System
Weight wij
0.11
0.28
0.61
0.11
0.28
0.61
2012 2013 2014 2015 2016
3.88 4.12 4.59 4.88 4.82
4.97 4.97 4.92 5.00 4.88
3.36 3.58 3.89 4.22 4.20
4.79 4.84 5.06 5.46 5.18
4.62 4.56 4.74 4.86 5.04
3.63 3.37 3.66 3.96 3.82
EII
4.02 3.94 4.19 4.49 4.37
20
International Journal of Managing Public Sector Information and Communication Technologies (IJMPICT) Vol. 7, No. 4, December 2016
Figure 23. The Education Informatization Index (EII) and its subindexes
Even though the Education Informatization Index is a composite indicator made up of only 2 (two) main categories (subindexes) and a total of 6 (six) individual indicators, from the point of view of verification and validation, the proposed informatization level assessment framework captures well all the socio-political flows in the sphere of educational policy creation and implementation in the Republic of Macedonia in the past five-year period (2012-2016).
4. CONCLUSIONS AND EDUCATIONAL POLICY IMPLICATIONS As the selection of indicators is often the result of a process of debates and compromises among stakeholders, i.e. national participants and international experts (a group of countries may identify certain indicators as very policy-relevant and straightforward, while other countries may find the same indicators as irrelevant and/or intricate [6]), there still remain some open questions about the number of subindexes, the number of aggregation levels, the number of indicators, methods for weight assignment, feasibility for collecting reliable data, and international comparability. Having in mind that policymakers can assess the improvement of the country over time in comparison with their nationally defined targets, the presented methodology and the results can aid in making knowledgeable decisions or in establishing greater commitment to incorporating ICT into the education system. It is important to indorse the use of ICT in education systematically in a strategic manner, from the aspects of software, hardware, and personnel. The ICT use in education should be supported effectively, in line with the policy targeting to create a learning system and schools appropriate for the 21st century [15]. In this process, many related parties in a number of fields should be involved, above and beyond experts in the fields of ICT and education.
ACKNOWLEDGEMENT This research was partially supported by a Civica Mobilitas grant under the Call for Proposals CM-FEL-01. Civica Mobilitas is a Swiss Agency for Development and Cooperation project that is implemented by NIRAS from Denmark, the Macedonian Center for International Cooperation (MCIC) and the Swedish Institute for Public Administration (SIPU).
21
International Journal of Managing Public Sector Information and Communication Technologies (IJMPICT) Vol. 7, No. 4, December 2016
REFERENCES [1] [2] [3] [4] [5]
[6] [7] [8] [9] [10] [11]
[12] [13]
[14]
[15]
Russell, Jesse & Cohn, Ronald (2012) Informatization, Book on Demand. Bell, Les & Stevenson, Howard (2006) Education Policy: Process, Themes and Impact, Taylor & Francis. Fischer, F., Miller, G. J. & Sidney, M. S. (2007) “Handbook of public policy analysis: theory, politics, and methods“, Implementing Public Policy, Taylor & Francis Group, LLC. (2005) Global Networked Readiness for Education, The Berkman Center for Internet & Society, Harvard Law School. Taylor, Richard & Bin Zhang (2007) Measuring the impact of ICT: Theories of Information and Development, Retrieved November 08, 2016, from http://www.academia.edu/2068941/ Measuring_the_Impact_of_ICT_Theories_of_Information_and_Developoment (2009) Guide to Measuring Information and Communication Technologies (ICT) in Education, UNESCO Institute for Statistics. (2016) Global Information Technology Report 2016, World Economic Forum. (2013) National Informatization White Paper, Republic of Korea. Kim, JaMee & Lee, WonGyu (2011) “An analysis of educational informatization level of students, teachers, and parents: In Korea”, Computers & Education, Vol. 56, pp 760–768. Chen, Ai-juan, Ren, Xiao-yan & Huang, Duo (2006) “Evaluation Research Summarization of Higher Education Informatization Level of our Country”, Information Science, 2006-09. Deng, Xiaozhao, Wu, Xiaozhou, Han, Yi & Fan, Zhiwei (2003) “Theoretical Problems on the Study of Informatization Indices System – Review of ‘The Framework of National Informatization Indices’”, Јournal of the China Society for Scientific and Technical Information, 2003-01. Xu, Chuan-xiang (2004) National Informatization Index System of China, Center of the International Cooperation for Computerization (CICC). Zhang, Yancai (2015) “Forecast of the Informatization Index of China from 2011 to 2015 Using the Grey Forecasting Model”, Proc. of the IEEE International Conference on Grey Systems and Intelligent Services (GSIS). Sekulovska, Ana & Jahija, Jahi (2016) “Informatization as a Measure for Improvement of the Education Policy – Case Study: Electronic Content Portal”, Proc. of the International conference on Applied Internet and Information Technologies (AIIT 2016), pp. 404-409, Bitola, Republic of Macedonia. (2011) The Vision for ICT in Education – Toward the Creation of a Learning System and Schools Suitable for the 21st Century, Ministry of Education, Culture, Sports, Science and Technology, Japan.
Authors Ana Sekulovska received her BSc and MSc degrees from the Faculty of Education, University “St. Kliment Ohridski” – Bitola. She is currently a PhD student at the Faculty of Law “Iustinianus Primus” (Political Science Department) at the Ss. Cyril and Methodius University in Skopje, Republic of Macedonia. Her research interest is the informatization as an educational policy measure, with an emphasis on informatization level assessment models. Pece Mitrevski received his BSc and MSc degrees in Electrical Engineering and Computer Science, and the PhD degree in Computer Science from the Ss. Cyril and Methodius University in Skopje, Republic of Macedonia. He is currently a full professor and Dean of the Faculty of Information and Communication Technologies, University “St. Kliment Ohridski” – Bitola, Republic of Macedonia. His research interests include Computer Architecture, Computer Networks, Performance and Reliability Analysis of Computer Systems, e-Commerce, e-Government and e-Learning. He has published more than 100 papers in journals and refereed conference proceedings and lectured extensively on these topics. He is a member of the IEEE Computer Society and the ACM.
22