developed for vehicle classification in urban areas. The system contains an .... Profiles of vehicle 4 (Ford Fiesta Sedan) at speeds 20 km/h, 40 km/h and 60 km/h, ...
Infrared-based system for vehicle classification Antônio Carlos Buriti da Costa Filho, João Pereira de Brito Filho, Renato Evangelista de Araujo
Clayton Augusto Benevides Claro Tecnologia Ltda. Recife, Pernambuco, Brazil
Department of Electronics and Systems Federal University of Pernambuco Recife, Pernambuco, Brazil
Abstract—This paper presents a low-cost infrared-based system developed for vehicle classification in urban areas. The system contains an equipment that is placed above the roadway and emits down-looking pulsed infrared beams through infrared LEDs (Light-Emitting Diodes). Vehicle profile is obtained detecting and analyzing the infrared light reflected by the vehicle passing directly below the equipment. Profiles of different vehicles were obtained to build a template databank. Vehicle classification is achieved by comparing a vehicle profile with all of the templates. Dynamic Time Warping (DTW) technique is used for carrying out the comparisons. Results obtained are presented and discussed. Keywords-dynamic time warping; vehicle classification; vehicle profile; infrared.
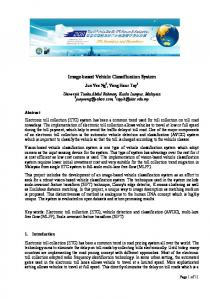
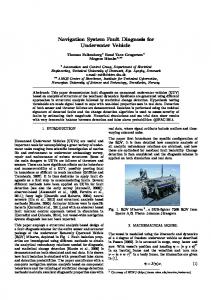
I. INTRODUCTION Traffic management is a common problem in urban areas. Vehicle classification is an important tool for traffic management. Vehicles can be classified by their types such as passenger car, pick-up, van, bus and truck. In this context, a number of solutions have been proposed exploring different technologies as image processing-based solutions [1-4], microwave radar [5] or infrared laser and ultrasonic sensors [6]. User needs and classification conditions can require the use of a specific solution with specific advantages. In this work we present a low-cost infrared-based system for vehicle classification. In our system, infrared light emitted by LEDs (Light Emitting Diodes) is exploited in the downlooking vertically-mounted equipment, positioned above the roadway (Fig. 1). As the vehicle passes below the equipment, a portion of the emitted light is reflected back to the equipment and detected by a photodiode that generates an electronic signature representing the vehicle profile. We show that Dynamic Time Warping (DTW) can be explored for comparisons of vehicle profiles.
Figure 1. Equipment (circular detail) mounted in a public illumination pole.
II.
ELECTRONIC SECTION OF THE SYSTEM
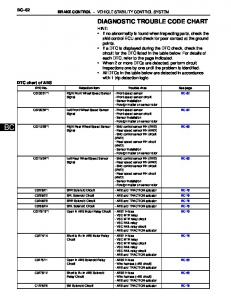
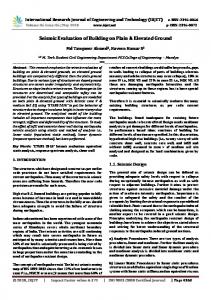
A. Block Diagram The system is composed of two parts: the emitter, responsible for emitting pulsed infrared light through LEDs, and the receiver, responsible to detect the reflected light that comes from a vehicle inside the coverage area of the equipment. The block diagram of the system is depicted in Fig. 2. B. Emitter The emitter is based on eighteen infrared LEDs (operating in the near infrared region of the electromagnetic spectrum at 940 nm) spatially disposed in three sets with six LEDs. They create an infrared-illuminated zone, corresponding to the coverage area of the equipment. This zone presents a cone shape with a viewing angle of about 25o, resulting in an illuminated area with a diameter of 2.5 m at ground level (see Fig. 3).
This paper is organized as follows: the electronic setup used in the system is described in section II. Results of field tests are shown in section III. Considerations on Dynamic Time Warping (DTW) and its application to the data obtained in field tests are formulated in section IV. The conclusions are presented in section V. Figure 2. Block diagram of the system.
This work was supported by the National Council for Scientific and Technological Development (CNPq), under the processes 480390/2007-0 and 303683/2008-2, and by the Coordination for the Improvement of Higher Education Personnel (CAPES).
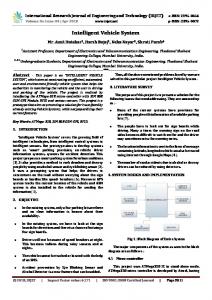
Figure 4. Profiles of vehicle 1 (color red Fiat Uno Hatchback) at speeds 20 km/h, 40 km/h and 60 km/h, respectively.
Figure 3. Cone shape of coverage area of the equipment.
The equipment emits a modulated light beam. The microcontroller generates the modulating signal, i. e., a pulse train with frequency of 10 kHz and duty cycle of 25%. For further system improvement purposes we have used a microcontroller instead of a simple pulse-width-modulation (PWM) control circuit. A current driver composed of MOSFET transistors is triggered by the pulse train. Its function is to drive the LEDs.
Figure 5. Profiles of vehicle 2 (color white Fiat Uno Hatchback) at speeds 20 km/h, 40 km/h and 60 km/h, respectively.
C. Receiver The receiver is composed of a photodiode followed by a signal amplifier, a bandpass filter and an envelope detector.
Figure 6. Profiles of vehicle 3 (Toyota Corolla Sedan) at speeds 20 km/h, 40 km/h and 60 km/h, respectively.
The photodiode is used to acquire the light reflected by the vehicles under the illumination zone. The signal on the photodiode terminals varies according to the vehicle shape, but suffers from degradation due to ambient illumination. The signal is amplified and forwarded to the bandpass filter. This filter is used to attenuate signal frequencies other than 10 kHz. Therefore, contributions from sunlight, lamps and hot objects to the detected signal are filtered out. The amplitude of the filter output signal is a good measure of vehicle profile. The task of the envelope detector is to capture the amplitude at the exact time of emission of the light. This is accomplished through synchronization between light emission and envelope detection. III.
RESULTS OF FIELD TESTS
Field tests were performed exploring different vehicles (passenger cars). The tests consist of the passage of vehicles, at constant speed, in the coverage area of the equipment. Vehicles profiles were obtained for each vehicle at speeds 20 km/h, 40 km/h and 60 km/h. Equipment output signals were acquired from a digital oscilloscope and are shown in Figs. 4-7. The amplitude of equipment output signal depends on the reflectance of vehicle parts that reflect the emitted infrared light, and on the distance between the equipment and these parts. As distinct vehicle parts (hood, windshield, rear window, roof, etc.) have different heights and reflectances, amplitude varies according to the vehicle shape, generating a representative signal of vehicle profile. One can also observe in Figs. 4-7 that each vehicle presents similar overall profiles in all of the three speeds.
Figure 7. Profiles of vehicle 4 (Ford Fiesta Sedan) at speeds 20 km/h, 40 km/h and 60 km/h, respectively.
IV. DYNAMIC TIME WARPING The analysis of the measured profile can be performed by comparing the obtained result with a known vehicle profile previously stored on the template databank. The databank can be created by performing several field tests. The choice of a profile that can be used as a template is made by determinating the one that better represents each vehicle. Car classification is achieved by choosing a template that best matches with the measured profile. If no acceptable match is found, it means the measured profile is not available in databank and car classification is not achievable. An approach that can be used for comparisons in this case is DTW (Dynamic Time Warping), formerly applied in speech recognition. However, a number of papers have recently shown other DTW applications such as pattern recognition of ECG (electrocardiogram) changes [7], classification of motor activities [8] and recognition of new and old banknotes for secure financial self-services [9]. A. Description of Dynamic Time Warping (DTW) technique DTW is a particular case of pattern matching [10] that performs non-linear alignment in time domain to minimize the
distance between two time series (e.g. two discrete-time signals). The distance is used as a measure to evaluate the similarity between two time series. If distance is null, similarity is maximum (identical series). On the other hand, the more the distance increases, the more the similarity decreases. A great advantage of DTW is that two time series can be compared even when they are shifted, shrunk or stretched in time domain, so that the two time series can be of different lengths. An example of DTW alignment applied to two signals is illustrated in Fig. 8. The pseudocode for DTW algorithm is shown in Table I.
B. Results of application of DTW on the vehicle profiles The distance values obtained by applying DTW method on the profiles of databank are illustrated in Table II. The results mean as follows: vehicle 1 has maximum similarity with itself (distance is null), and similarities non-zero if compared with other vehicles. The highest degree of similarity of vehicle 1 is with vehicle 2 (6.8488), because they are the same vehicle model, but with different colors. Lower degrees of similarity are obtained for less similar vehicles. To better understand the method viability, the DTW analyses were also performed between profiles with normalized amplitudes. As amplitude normalization is a linear operation, the overall shape of the signals was preserved. DTW application in such a case produces the results presented on Table III. One can observe that the DTW distances are reduced with the normalization of the signal profiles. The decision of choosing an acceptable value that guarantees matching can be merely empirical and no previous signal normalization is required to perform the DTW analysis. V.
Figure 8. DTW alignment applied to two continuous-time signals with similar overall shapes. Due to continuity of time variable, signals are sampled and DTW distance is calculated over the sampled values.
TABLE I.
PSEUDOCODE FOR DTW ALGORITHM
Algorithm: DTW Input: A = {a1, a2, a3, …, aN} B = {b1, b2, b3, …, bM} Output: Dist : DTW distance between two time series that are represented by vectors A and B. Variables: pp(n,m) : point-to-point distance between the value of nth point of A (an) and mth point of B (bm). acc(n,m) : accumulated distance, obtained from the sum of point-topoint distances with the minimal value of neighbor accumulated distances. This minimal value guarantees that the DTW distance is kept in its minimal value. for n ← 1 to N for m ← 1 to M pp(n,m) ← |a(n) - b(m)| end end acc(0,0) ← 0 acc(1,0) ← 0 acc(0,1) ← 0 for n ← 1 to N for m ← 1 to M acc(n,m) ← pp(n,m) + min[acc(n-1,m),acc(n-1,m-1),acc(n,m-1)] end end Dist ← acc(N,M)
CONCLUSIONS
A low-cost infrared-based system for vehicle classification has been presented. The reflected infrared light generated specific signal patterns for each vehicle used on the field tests. We have developed a profile databank for passenger cars and we have shown that Dynamic Time Warping technique can be used on vehicle classification. An infrared-based vehicle classification system applied for other vehicle types such as pick-up, van, bus and truck is currently under evaluation and a new and more robust profile databank is being developed. ACKNOWLEDGMENT The authors thank Adams Soares Teles for technical support to this work. TABLE II.
Vehicle 1
DTW DISTANCES OF COMPARISONS BETWEEN TWO NONNORMALIZED VEHICLE PROFILES Vehicle 1
Vehicle 2
Vehicle 3
Vehicle 4
0
6.8488
77.1288
140.2480
Vehicle 2
6.8488
0
7.0632
25.3224
Vehicle 3
77.1288
7.0632
0
2.3856
Vehicle 4
140.2480
25.3224
2.3856
0
TABLE III.
DTW DISTANCES OF COMPARISONS BETWEEN TWO NORMALIZED VEHICLE PROFILES Vehicle 1
Vehicle 2
Vehicle 3
Vehicle 4
Vehicle 1
0
0.3472
0.8228
2.8385
Vehicle 2
0.3472
0
0.6803
2.1918
Vehicle 3
0.8228
0.6803
0
0.8980
Vehicle 4
2.8385
2.1918
0.8980
0
REFERENCES [1]
[2]
[3]
[4]
[5]
J.–W. Hsieh, S.–H. Yu, Y.–S. Chen, and W.–F. Hu. “Automatic traffic surveillance system for vehicle tracking and classification,” IEEE Trans. Intell. Transp. Syst., vol. 7, no. 2, pp. 175-177, June 2006. M. Bertozzi, A. Broggi, and A. Fascioli. “Vision-based intelligent vehicles: state of the art and perspectives,” Robot. Auton. Syst., vol. 32, no. 1, pp. 1-16, 2000. S. Gupte, O. Masoud, R. F. K. Martin, and N. P. Papanikolopoulos. “Detection and classification of vehicles,” IEEE Trans. Intell. Transp. Syst., vol. 3, no. 1, pp. 37-47, March 2002. G. S. K. Fung, N. H. C. Yung, and G. K. H. Pang. “Vehicle shape approximation from motion for visual traffic surveillance,” Proc. IEEE Conf. Intell. Transp. Syst., pp. 608-613, August 2001. I. Urazghildiiev et al.. “Vehicle classification based on the radar measurement of height profiles,” IEEE Trans. Intell. Transp. Syst., vol. 8, no. 2, pp. 245-253, June 2007.
[6]
L. E. Y. Mimbela, and L. A. Klein. “A summary of vehicle detection and surveillance technologies used in intelligent transportation systems,” The Vehicle Detector Clearinghouse, August 2007. [7] Tuzcu. V.; Nas. S.. "Dynamic time warping as a novel tool in pattern recognition of ECG changes in heart rhythm disturbances," Systems. Man and Cybernetics, 2005 IEEE International Conference on, vol.1, no. 1, pp. 182-186, October 2005. [8] Muscillo. R., Conforto. S., Schmid. M., Caselli. P., D'Alessio. T.. "Classification of Motor Activities through Derivative Dynamic Time Warping applied on Accelerometer Data," Engineering in Medicine and Biology Society. 2007. EMBS 2007. 29th Annual International Conference of the IEEE, pp. 4930-4933, August 2007. [9] Baiqing Sun; Jilu Li, "The Recognition of New and Old Banknotes Based on SVM," Intelligent Information Technology Application, 2008. IITA '08. Second International Symposium on, vol.2, pp.95-98, December 2008. [10] J. Coleman. “Introducing Speech and Language Processing,” Cambridge University Press, 2005.