Supporting Information
Infrared Characterization of the Bidirectional Oxygen-Sensitive [NiFe]-Hydrogenase from E. coli Moritz Senger 1, Konstantin Laun 1, Basem Soboh 2 and Sven T. Stripp 1,* Department of Physics, Experimental Molecular Biophysics, Freie Universität Berlin, 14195 Berlin, Germany;
[email protected] (M.S.);
[email protected] (K.L.) 2 Department of Physics, Genetic Biophysics, Freie Universität Berlin, 14195 Berlin, Germany;
[email protected] * Correspondence:
[email protected]; Tel.: +49-030-838-55069 1
Contents
Figure S1
13
CO isotope editing
Figure S2
Further H2 titrations and Ni-R band assignment
Figure S3
Further CO titrations
Catalysts 2018, 8, x; doi: FOR PEER REVIEW
www.mdpi.com/journal/catalysts
Catalysts 2018, 8, x FOR PEER REVIEW
2 of 4 1944 (Fe-12CO)
absorbance / 10-3
1 2084 2074
2054 (Ni-12CO)
0
S
Ni+2
45
-1
2009 (Ni-13CO)
S
S
Fe+2 S
Ni-SCO
-2 2100
2050
2000
1950
1900
-1
frequency / cm
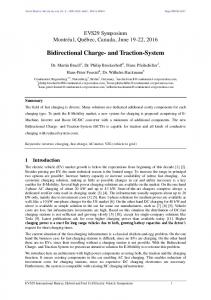
Figure S1. 13CO isotope editing. The black difference spectrum shows the enrichment of Ni-SCO over Ni-C and Ni-SI upon 12CO binding the nickel ion (see main script). In the presence of 13CO, the Ni-CO signal shifts from 2054 to 2009 cm−1 (orange difference spectrum). The observed shift of 45 cm−1 to 𝑚1𝑚2 lower frequencies is explained by the difference in reduced mass µ = between 12CO and 13CO. 𝑚1+𝑚2
The Fe(CN)2CO signature remains unaffected by the isotope editing, which proves the presence of an individual CO ligand at the nickel site.
Catalysts 2018, 8, x FOR PEER REVIEW
3 of 4
sum of peak area / 10-3
(a)
N2
1% H2 100%
O2
0,6
0,3
0,0 0
15
(b)
30
45
60
time / min
0,2
absorbance / 10-3
N2
0,9
Ni-R1
Ni-R2
2062 2064 2048
2076
Ni-R3
0,0 2054 2068 2078 2088
-0,2
Ni-C 2100
2050
2000
1950
1900
frequency / cm-1
sum of peak area / 10-3
(c) 0,6
H2
H2
H2
30
45
H2
0,4
0,2
0,0 0
15
60
75
90
time / min
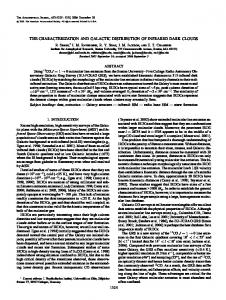
Figure S2. Further H2 titrations and Ni-R band assignment. (a) In order to assign the Fe(CN)2CO signature of the Ni-R states the following procedure was attempted. First, the sample was brought in contact with 1% O2 to homogenize the film and enrich Ni-B over the as-isolated mixture of Ni-C and Ni-SI (see Figure 6 in the main script). Second, O2 was replaced by 1% H2 to reductively activate the enzyme. The reduced species Ni-C and Ni-R were found to dominate the spectrum with no increase of the oxidized Ni-SI in the presence of H2. However, the H2 – O2 difference spectrum still included the negative bands of Ni-B. Although the film was completely reactivated with 1% H2, a further increase of Ni-R over Ni-C was observed by switching the gas stream to 100% H2. (b) “100% H2 – 1% H2” difference spectrum that depicts the increase of Ni-R1 – R3 over Ni-C. The Fe(CN)2CO signature of Ni-C was identified before (see main script). Based on the singular peaks at 2076, 2054, and 2048 cm-1 and the observation that both CO and CN– bands shift in the same direction, a unique fit was achieved for the Fe(CN)2CO assignment of Ni-R1 – R3 (see Table 1 in the main script). (c) This data was used to describe the concomitant increase and decrease of R-states, e.g., depending on the presence or absence of H2 from the carrier gas.
Catalysts 2018, 8, x FOR PEER REVIEW O2
1
2
5
10 25 50 100
H2
0,9
(b) sum of peak area / 10-3
sum of peak area / 10-3
(a)
4 of 4
0,6
0,3
0,0 0
15
30
45
60
N2
1
1
2
5
10
25
50 100
1,0
0,5
0,0 15
30
time / min
N2
0,5
0,0 0
10
20
30
40
50
time / min
1,5
0
100
1,0
75
(d) relative population / %
sum of peak area / 10-3
H2
50
1,5
time / min
(c)
10
45
60
100 75 50 CO/N2 CO/H2 CO/O2
25 0 0
20
40
60
80
100
%CO
Figure S3. Further CO titrations. (a) In the presence of O2 carrier gas, no CO inhibition was observed even when the gas stream was switched to 100% CO. The reaction with O 2 very efficiently removes Ni-SI from the equilibrium of species. Therefore, CO cannot bind to the [NiFe] active site. (b) With N2 as carrier gas, 1% CO in the gas stream completely converts the film into Ni-SCO. The mixture of NiC and Ni-SI (characteristic for HYD-2 under inert gas) facilitates an immediate conversion into NiSCO in the presence of CO. (c) With H2 as carrier gas, an apparent decrease in the CO affinity is observed (see main script). (d) When the relative population of Ni-SCO is plotted against CO ambient partial pressure, the differences in CO affinity as a function of carrier gas can be visualized in a single graph.