benefits to adopting green infrastructure in urban areas. The eight technologies for which adequate performance data exist to support analysis are described in ...
GREEN INFRASTRUCTURE Lessons from Science and Practice
June 2015
About the Science Policy Exchange “Green Infrastructure: Lessons from Science and Practice” is a project of the Science Policy Exchange (SPE) with Syracuse University. SPE is a consortium of six research institutions in the northeastern United States all dedicated to increasing the value of science to environmental decision-making. SPE was founded by Syracuse University, Cary Institute of Ecosystem Studies, The Ecosystems Center at MBL, Harvard Forest of Harvard University, Hubbard Brook Research Foundation, and University of New Hampshire. The findings expressed in this report are solely those of the authors. To learn more about SPE visit: www.science-policy-exchange.org. Recommended citation: Driscoll, C.T., Eger, C.G., Chandler, D.G., Davidson, C. I., Roodsari, B.K., Flynn, C.D., Lambert, K.F., Bettez, N.D., Groffman, P.M. 2015. Green Infrastructure: Lessons from Science and Practice. A publication of the Science Policy Exchange. 32 pages. Charles T. Driscoll, Caitlin G. Eger, David G. Chandler, Babak K. Roodsari, Cliff I. Davidson, Carli D. Flynn, Department of Civil and Environmental Engineering, Syracuse University, Syracuse, NY 13244 Kathleen F. Lambert, Science Policy Exchange, Harvard Forest, Harvard University, Petersham, MA 01366 Neil D. Bettez and Peter M. Groffman, Cary Institute of Ecosystem Studies, Millbrook, NY 12545 Graphic Design: Theoharides Consulting, www.theoharidesconsulting.com June 2015
EXECUTIVE SUMMARY
administered a survey to municipal officials on factors that may affect decisions related to green infrastructure adoption for stormwater management.
Green infrastructure is an emerging engineering approach used to address stormwater and water quality challenges in urban areas using cost-effective technologies, which also provide environmental, social, and economic benefits. Green infrastructure can decrease water inputs to sewers, wastewater facilities, and surface waters by increasing the available storage across the urban landscape. The extent to which water is detained in the structure, removed through evapotranspiration to the atmosphere or infiltration to groundwater underlies substantial differences in function and performance among different green infrastructure designs.
We found from available literature and data that there is considerable variability in the retention of stormwater quantity and quality across green infrastructure technologies and across storm events. In general, bioretention cells (mean 90% retention) and green roofs (mean 73% retention), and to a lesser extent porous pavement (mean 58% retention), are technologies that promote stormwater loss through a combination of enhanced evapotranspiration or infiltration. In contrast, other technologies are less effective at removing water (swales with mean 27% retention; detention ponds with mean 8% retention; media filters with mean 8% removal; retention ponds with mean -2.4% retention; wetlands with mean -11% retention), but accomplish stormwater management largely by allowing for additional storage for stormwater events. Yet, average retention performance differs more by sites than by events within a given green infrastructure technology.
Despite the growing interest in green infrastructure for stormwater management, information is limited on its design, implementation, operation and performance. The approach is still relatively new and, although it is being widely adopted, there are few studies in the peer-reviewed literature that report and contrast the performance of different green infrastructure technologies. To begin to address green infrastructure information needs, we: (1) gathered and analyzed water quantity and quality performance data for green infrastructure technologies that are commonly used for stormwater management from the peer-reviewed literature and a large national database; and (2)
Based on the limited studies that exist in the literature, we found the water retention capacity of bioretention cells and green roofs can be diminished under cold season conditions, compared to warm weather conditions. This reduction in performance is variable across the studies examined and can be attributed to
1
changes in the functioning of green infrastructure, such as decreased evapotranspiration at lower temperatures, reduced plant water uptake, and reduced infiltration into frozen soil. Note that for certain technologies and in certain climates the quantity and intensity of water inputs can decrease during winter due to differences in seasonal precipitation and snow removal. Overall, we find that given appropriate design and operation, green infrastructure can still process stormwater effectively during winter conditions.
releasing quantities to downstream water, likely due to the application of fertilizer to biological systems. We found little evidence of retention of chloride in stormwater structures, but generally trace metals, lead and cadmium, were effectively retained. Based on a case study in Onondaga County NY, discussions with municipal water managers, and a survey, we found that key factors enabling the adoption of green infrastructure programs include 1) strong local leadership and entrepreneurship; 2) collaboration with multiple and diverse community groups and stakeholders; 3) learning from the experiences of other green infrastructure adopting communities; and 4) consideration of social benefits related to green infrastructure technologies. Conversely, barriers that discourage the adoption of green infrastructure programs include 1) concern about cost-effectiveness (including operation and maintenance costs); 2) lack of interdepartmental coordination and funding; and 3) inadequate technical capacity and expertise.
The effectiveness of green infrastructure in removing contaminants in stormwater depends on the contaminant of interest and the technology used. Virtually all green stormwater technologies are effective at removal of suspended solids, with mean removals ranging from 71% for bioretention cells to 33% for wetlands. We found bioretention cells, media filters, detention ponds and retention ponds retain modest quantities of total nitrogen and total phosphorus. In contrast, swales, porous pavement, wetlands and green roofs retain minimal quantities of these nutrients, with some systems
INTRODUCTION
2011), the ability to predict the effectiveness of green infrastructure practices in diverse urban watersheds in a range of climatic and seasonal settings remains poor. This disconnect may lead to gaps between stakeholder expectations and actual system performance and stymy the diffusion of green infrastructure technology. Therefore, as with any new technology, it is critical to invest the necessary time and resources to compile and synthesize data from early adopters to improve green infrastructure design and performance.
Aging water infrastructure is failing to meet contemporary environmental standards in cities across the U.S. Traditional stormwater infrastructure designed for efficient flow routing and drainage capacity has resulted in increased peak flows, decreased low flows, enhanced delivery of nutrients and toxics to urban waters, and degraded downstream aquatic habitat. Many older cities still have linked storm and sanitary sewers that experience combined sewer overflows (CSOs) during wet weather conditions and expose people in densely populated areas to health risks from waterborne pathogens and toxics.
With support from the Surdna Foundation, we conducted a literature and database review to synthesize existing information on the water quantity and water quality performance of specific green infrastructure technologies.
Green infrastructure (GI) has emerged as a promising alternative for reducing the cost and disruption associated with grey infrastructure replacement, for improving watershed management and water quality performance, and for providing an array of urban sustainability benefits. Green infrastructure has become a centerpiece of many urban stormwater management plans and combined sewer overflow (CSO) consent decree agreements (e.g., NYC DEP 2013, PWD 2009, MMSD 2013).
OVERVIEW OF GREEN INFRASTRUCTURE STORMWATER TECHNOLOGIES Several technologies have been applied as green infrastructure for stormwater management. These technologies each have advantages and limitations, and the effectiveness of their application depends on stormwater management needs, their operating conditions relative to design conditions, and the configuration of the surrounding built, landscape and surficial environment in which they are deployed. The primary objective for the application of green infrastructure for stormwater management is for the costeffective processing of the water quantity associated with short duration storm events (i.e., rain storms, snowmelt). In general, this objective can be accommodated by two mechanisms: by increasing in storage to retain stormwater runoff until it can be processed by the stormwater infrastructure; or by facilitating water loss by evapotranspiration to the atmosphere or infiltration to the groundwater system, thereby eliminating the need to process that stormwater runoff through wastewater treatment or by surface water discharge. Green infrastructure technologies vary in their ability to process water by these two mechanisms.
Green infrastructure uses vegetation and natural processes to capture, store, and slowly release water to the atmosphere, ground water or existing drainage systems. It can include many different technologies that are generally small scale and distributed throughout the urban landscape among neighborhoods and communities. Specific technologies vary and can range from planters, street trees and rain gardens, to porous pavement and green roofs, to bioswales, bioretention ponds and constructed wetlands. The size and distribution of these technologies in networks across an urban landscape strongly influence how effective the overall green infrastructure system works in mitigating stormwater and its impacts. The next several years will be a critical period in the advancement of green infrastructure as cities move from planning to implementation and, ultimately, to evaluation against regulatory and legal standards. Despite its promise and the many green infrastructure studies that are underway (Zhou et al. 2009, 2010,
2
3
DATA SOURCES AND PRESENTATION
In addition to this primary objective, a secondary objective of green infrastructure for stormwater management is the potential for water quality treatment which can decrease the cost of wastewater treatment and potentially improve surface water quality. There may also be social, environmental and public health cobenefits to adopting green infrastructure in urban areas. The eight technologies for which adequate performance data exist to support analysis are described in Appendix 1. The technologies are: bioretention cells, green roofs, media filters, porous pavement, grassed swales, and constructed wetlands which are considered to be green infrastructure, and detention ponds and retention ponds which are conventional technologies generally used to store stormwater inflows for later treatment by wastewater facilities.
Data summarized in this report are primarily from the International Stormwater Best Management Practice database, a collection made available to the public by the Water Environment Research Foundation (WERF), Environmental Protection Agency (EPA) and Environmental Water Resources Institute (EWRI; WERF 2013). In addition, data were obtained from the peerreviewed literature. From these sources, we compiled data from 121 sites involving 4,277 hydrologic and 35,476 water quality observations from individual storm events into an original Microsoft Access database that we created for this study. In this report we summarize the hydrologic and water quality performance of stormwater technologies by
stormwater structure providing an additional water source that result in greater export of water quantity and contaminants than collected by the inlet of the facility. Also, for some facilities contaminants can enter a structure by pathways other than precipitation and stormwater run on, such as addition of nutrients during fertilizer application to vegetation or application of road salt to porous pavement.
presenting observations as runoff reduction. Runoff reduction is simply the percent decrease in the volume of water or the mass of a contaminant for a stormwater runoff event observed for an individual storm water facility. A positive value for runoff reduction indicates the extent of removal of the quantity of water or the mass of a contaminant by the stormwater technology during an individual event. A value of 100% indicates complete removal of water or a contaminant. A value of 0% indicates no removal of water or a contaminant, or that the material entering the stormwater facility is the same as that leaving the facility. A negative value indicates that there is more water quantity or mass of contaminant leaving the facility than entering. This condition may seem counterintuitive, but can occur. For example, for some technologies groundwater can seep into the
The runoff reduction results within each figure are ordered with the best performing technology on the left and decreasing performance of technologies from left to right. These facilities are at varied locations under different landscape and climatic settings, and have varied designs and operating conditions relative to site conditions and age of the facility. As a result, the summary of performance for a given technology demonstrates considerable variability.
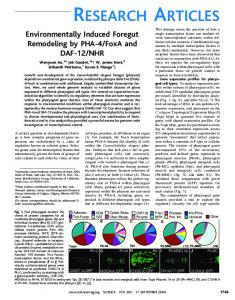
Sample Boxplot cluster of data points; half of all observations fall within the red bracket. The % water volume and % contaminant load reduction datasets are negatively skewed, highly variable and bounded at 100%; as a result they do not meet criteria for using parametric methods of analysis. The “shortest half” metric helps interpret the observations without transforming the data. This is useful for identifying normal operational function: during a given storm event, there is a 50% chance that the storm event will result in a % reduction value within the “shortest half” bracket. If a technology has a very narrow “shortest half” range and a mean that falls far outside it, that likely indicates that most storm events fall within the shortest half, but the overall annual average performance is influenced by a few, infrequently occurring large events. If a technology has a wider “shortest half” bracket that encompasses both mean and median, that likely indicates that the technology performs roughly the same during events of unequal size or time interval. Note that all technologies may experience storm events (or a series of events) that exceed their capture capacity or expand their effective capture, resulting in negative values of runoff reduction.
We summarized the green infrastructure performance data by technology type using box and whisker plots of runoff reduction (Figure 1). The white line in the middle of each box plot represents the median value for all observations (half the observations are above and half are below this value). The yellow rectangular markers represent the arithmetic mean value (average). The mean values are reported in the lower right corner of the figure. The edges of the boxes above and below the median represent the values for the interquartile range (25th to 75th percentile). The lines extended from the boxes are upper and lower whiskers that extend 1.5 times beyond the interquartile range. Observations that occur outside the box and whiskers are labeled as individual points, and could be considered “outliers” in the dataset, although they are included in the calculation of the mean and median values. The red brackets along the left hand side of the box plot represent the “shortest half”, which indicates the densest
4
6– – Outlier
5– 4– Plotted Value
HOW TO READ A BOX AND WHISKER PLOT
– 1.5 x Interquartile Range
3– 2– 1–
Shortest half 50% of data fall – in this bracket
– 75th percentile Mean – 50th percentile
0– -1 –
– 25th percentile – 1.5 x Interquartile Range
-2 – Figure 1. Conceptual diagram illustrating the features of a box and whisker plot.
5
SUMMARY OF GREEN INFRASTRUCTURE PERFORMANCE FOR STORMWATER MANAGEMENT
Most technologies displayed some runoff retention observations as negative values (up to -300%), which indicates input of water to the facility from another source, such as groundwater. Given these observations, values of negative retention should be considered a normal occurrence, for some green infrastructure technologies. Wetlands, media filters and retention ponds all showed negative values of average mean retention from -11% to -12%, indicating that they are hydrologically connected to groundwater sources. These technologies are designed to delay and reduce peak runoff rather than total runoff, so are still likely to reduce combined sewer overflow impacts, but not the total water volume.
RETENTION OF STORMWATER QUANTITY Overall, volumetric capture of stormwater was highly variable across the stormwater technologies, including green infrastructure. We present statistical analyses of runoff reduction values first using the average of events at individual sites (Figure 2) and then using the runoff reduction of all events across all sites for a given technology (Figure 3). For the first analysis, we found the average mean retention for porous pavements (72%), bioretention cells (65%) and green roofs (52%), indicate a significant capture advantage over other stormwater management strategies, such as swales (26%) and detention ponds (16%) (Figure 2).
By comparison to Figure 2, the distribution of individual storm event observations (Figure 3) shows a greater range of runoff retention values. Similarly, the range in average event reduction efficacy of bioretention cells (90%) green
Mean of Site Means – % Volumetric Reduction
% Volumetric Reduction
100 –
50 –
0–
-50 – PP BR GR SW DWMF R-
-100 –
PP
BR
GR
SW
D
W
MF
Porous Pavement: 72.0% Bioretention: 64.8% Green Roof: 52.3% Swale: 25.7% Detention Pond: 15.5% Wetland: -10.7% Media Filter: -11.6% Retention Pond: -12.4%
R
Stormwater Technology Type
Figure 2. Stormwater capture, loss and leakage by technology, summarized as percent volume reduction of influent water. The values in the lower left corner represent the mean performance at individual sites.
6
7
GREEN INFRASTRUCTURE PERFORMANCE UNDER COLD CONDITIONS
roofs (73%) and porous pavement (58%) is greater than for the “mean of site means” analysis (Figure 2). As in Figure 2, average runoff reduction by swales (27%) is somewhat better than detention ponds (8%) and media filters (8%), whereas retention ponds and wetlands tend not to reduce total runoff volume on an average basis. It is notable that the wide range of response for individual storm event observations highlights the opportunity for good performance or failure for any of the technologies, depending on the combination of site design or capacity and precipitation/snowmelt intensity and magnitude. An important caveat is that these results may be biased by more data from sites constructed with a conservative design or by sites in climates with higher frequency, smaller events.
One potential barrier to adoption of green infrastructure technologies for stormwater management is concern about performance during the cold season. Although there are numerous references to the performance of green infrastructure, the number of studies on seasonal performance of green infrastructure technologies is limited. The University of New Hampshire Stormwater Center (UNHSC) has demonstrated the considerable potential for warm and cold season performance of welldesigned and carefully operated sustainable stormwater systems (Roseen et al. 2009). Although their study was carefully conducted, the performance metrics focus on peak flow reduction and mean detention time and cannot easily be translated into runoff reduction metrics.
In our assessment, cold climate hydrologic performance was first analyzed across site type categories for technologies with data available for summer and winter, then focused on two green infrastructure technologies, bioretention cells and green roofs. To examine the influence of seasonal variation on hydrologic performance, data from the WERF database were categorized into summer or winter based on the date of the observation (Summer: June 21 to Sept 20; Winter: December 21 to March 20; Figure 3). For the bioretention and green roof comparison, we reviewed 10 papers in the peer-reviewed literature with information on cold climate performance, in addition to the observations present in the WERF database. Observations from the literature reporting evidence of soil freezing or non-zero snow depth have been included as ‘winter’ observations even if they were outside this date range.
mean of site means (Figure 2), but no consistent shift from summer to winter performance. Porous pavement clearly outperforms all other technologies in terms of average event runoff reduction for both summer (93%) and winter (99%) conditions. Bioretention cells perform equally well in summer (76%) and winter (74%). Only green roofs and wetlands show a significant difference between summer (53% and 7%) and winter (48% and -14%) event average retention, evident by a shift in the shortest half. Other technologies have low runoff reduction values. Improvements in winter runoff reduction across stormwater management technologies is likely a reflection of reduced water input due to snow removal, slow input rates from snowmelt, and a decrease in the likelihood of prolonged or intense rainfall during winter. Again, the variability across sites and events may obscure significant differences in performance between winter and summer for individual sites. We provide additional site-specific analyses of seasonal performance for the non-pavement technologies with greatest potential, bioretention and green roofs.
Broad seasonal comparison of the stormwater technologies in summer and winter (Figure 4) shows similar patterns in performance for summer as the
All Observations % Volumetric Reduction 100 –
Seasonal Performance in Summer (orange) and Winter (blue) 100 –
0–
50 –
-50 –
-100 – -150 – BR GR PP SW MF DRW-
-200 – -250 – -300 – BR
GR
PP
SW
MF
D
R
Bioretention: 90.3% Green Roof: 73.2% Porous Pavement: 57.5% Swale: 27.4% Media Filter: 8.34% Detention Pond: 7.51% Retention Pond: -2.42% Wetland: -11.3%
W
Stormwater Technology Type
% Volumetric Reduction
% Volumetric Reduction
50 –
0–
-50 –
-100 –
PP BR GR SW DRWMF -
Porous Pavement: Bioretention: Green Roof: Swale: Detention Pond: Retention Pond: Wetland: Media Filter:
S 93.4 S 76.0 S 53.0 S 31.2 S 20.9 S 2.63 S 6.61 S -9.87
W W W W W W W W
98.9 73.6 48.0 23.1 12.3 -21.9 -13.5 -14.7
-150 – PP
BR
GR
SW
D
R
W
MF
Stormwater Technology Type
Figure 3. Summary of volumetric stormwater capture, loss and leakage by technology, summarized as percent volume reduction of inflowing water. The values shown are of performance by individual events.
8
Figure 4. Summary of event based volumetric runoff reduction (retention) by technology, for summer (orange) and winter (blue) periods.
9
Bioretention Cell Seasonal Performance
The study showing the greatest retention of stormwater quantity (Khan et al. 2013) exhibited the least decrease in performance from warm to cold season, indicating that it is likely appropriately sized or oversized for the small water receiving area it serves. The other studies showed less overall retention of stormwater inflow and exhibited increasingly diminishing performance during the cold period (Hunt et al. 2008, Muthanna et al. 2008). The extreme negative retention values belie a fundamental issue in the runoff reduction analysis approach and winter maintenance of parking areas. Whereas snow removal from parking areas has the potential to markedly improve winter performance, storage of removed snow on bioretention cells can impair performance through ice development and dam formation. Negative runoff reduction values are most likely the direct outcome of the enhanced, but unaccounted for, input of water from snowmelt during rain on snow events.
In select bioretention cells, a decrease in runoff reduction performance is consistently observed from the warm to cold season from the three studies available in the literature, although the magnitude of the decrease in performance was highly variable across these studies and the reduction in stormwater capture was not significant (Figure 5). The variability reported in the literature can be explained by the temperature dependence of evaporation of water from surfaces and transpiration by plants and the reduction of plant activity due to seasonal dormancy. However, the effect of these seasonal changes should be considered small when compared with the overall effect of appropriate sizing and design of these systems.
Seasonal Performance of Selected Bioretention Cells 100 –
% Volumetric Reduction
50 – 0– -50 –
Khan et al. (2013) Warm: 93.5 Cold: 87.5
-100 – -150 –
Hunt et al. (2008) Warm: 88.0 Cold: 52.6
-200 –
Muthanna et al. (2008) Warm: 30.0 Cold: -52.8
Warm
Cold
Khan et al. (2013)
Warm
Cold
Hunt et al. (2008)
Warm
Cold
Muthanna et al. (2008)
Figure 5. Summary of volumetric stormwater capture, loss and leakage during warm and cold seasons for bioretention cells based on studies in the literature, summarized as percent volume reduction of inflowing water. The values shown are of performance by individual events.
10
11
Green Roof Seasonal Performance
during the winter. Although green roofs display reduced performance during winter months, the range in winter (shortest half 15 to 45%) still shows better operation than warm weather performance of most other studied technologies (Figure 4).
In contrast to bioretention cells, the performance of green roofs at retaining water shows a stronger dependency on event size than season (Schroll et al. 2011; Carson et al. 2013; Figure 6). However, our review of the literature shows some decrease in retention of precipitation inputs during the cold season. This is most likely due to decreased rates of evapotranspiration, ice formation in the porous growth media and melt of accumulated snow and ice during rain-on-snow/ice events. The change in mean runoff reduction performance of green roofs from warm to cold seasons was analyzed from fourteen studies in the literature and WERF database (Figure 4). It is likely that the sizing and media depth of a green roof may also influence the effectiveness of roofs
Seasonal Performance of Selected Green Roofs
APPLICATION OF RESULTS
WATER QUALITY IMPROVEMENT BY CONTAMINANT REMOVAL
Based on our review of current available data, we conservatively recommend that green infrastructure models should use a sliding scale bounded by the shortest half range, which represents the densest 50% of data and should give a reasonable estimate for modeling stormwater retention performance for these various technologies (Table 1).
Our review of literature and available data showed that green infrastructure has been investigated for the removal of a large number of water quality parameters (Appendix 1). For this report we focused on measurement of a few water quality contaminants for which there are many observations across the eight different technologies. These contaminants are of general interest to urban water managers due to their contributions to conditions of impaired surface waters. The contaminants include total suspended solids, chloride (a measure of human contamination, and road salt), total nitrogen and total phosphorus (important nutrients), and lead and cadmium (important trace metals).
Table 1. Summary of green infrastructure stormwater management performance values obtained from this study.
100 –
% Retention
% Volumetric Reduction
80 –
Technology Type 60 –
Mean
Interquartile Range
Shortest Half Range
40 –
Green roofs
GR
52
35
to
85
45
to
55
20 –
Rain gardens, bioretention cells, stormwater trees
BR
65
45
to
100
80
to
100
SW
26
0
to
50
10
to
55
D
16
-5
to
35
5
to
30
PP
72
25
to
100
90
to
100
R
-12
-35
to
10
-10
to
15
W
-11
-25
to
15
-5
to
25
Schroll et al. (2011)
0– -20 – -40 –
-2410%
Warm
Cold
Warm
Green Roof
Green Roof Warm: 83.4 Cold: 62.8
Grassed/dry swales and grassed waterways
Media Only Roof Warm: 69.7 Cold: 59.4
Porous pavement
Cold
Media Only Roof
Wet swales and wet ponds
Figure 6. Representative summary of volumetric stormwater capture, loss and leakage during the warm and cold season from Schroll etr al. (2011), summarized as percent volume reduction of rainfall. Data displays performance by individual events.
12
13
SUSPENDED SEDIMENT REMOVAL
sheetflow under high sediment loading, which may reflect the lower rate of suspended solids removal compared with bioretention cells and media filters. The water flow through constructed wetlands is not significantly different from retention ponds under high flow conditions, and thus they would be expected to perform similarly for removal of suspended solids. The limited runoff reduction of suspended solids from green roofs is misleading. Green roofs have very low input of suspended solids in precipitation, and the stormwater exiting these systems can mobilize some suspended solids from the soil media. This creates a low level discharge of sediment in water draining green roofs, but negative values when expressed as runoff reduction. Note that green roofs are not an important source of suspended solids to wastewater systems or surface waters.
Most technologies, except green roofs, provide for removal of suspended particulates from influent stormwater (Figure 7). The two technologies that use filtration through porous media (bioretention and media filters) achieve greater mean capture rates than retention and detention ponds, which use sedimentation as the mechanism for water clarification, as well as swales, which generally use overland sheet flow to process storm water runoff. These observations are consistent with the design objective that little water entering a bioretention cell or media filter circumvents the filtering pathway. Retention and detention ponds (conventional stormwater technologies) have limited retention time during high flow periods and likely have limited opportunity for particle sedimentation and therefore less removal of suspended solids. Porous pavement is known to clog and produce
Suspended Sediment Capture 100 –
% Reduction by Mass
50 – 0– -50 –
-100 – BR MF RDSW PP WGR -
-150 – -200 – BR
MF
R
D
SW
PP
W
Bioretention: 70.8% Media Filter: 66.1% Retention Pond: 49.7% Detention Pond: 44.4% Swale: 43.0% Porous Pavement: 40.8% Wetland: 33.0% Green Roof: -5.74%
GR
Stormwater Technology Type
Figure 7. Total capture, loss and leakage of the mass of suspended solids in stormwater for each technology studied.
14
15
NUTRIENT REMOVAL
total nitrogen (mean retention 57%), whereas green roofs show a large net release of total nitrogen (mean retention -2410%). Note that data for green roofs were only available for four sites. Nevertheless this pattern of net nitrogen leaching is almost certainly due to the application of fertilizer in the green roof media during installation, pointing toward the need for better design and installation guidelines for green roofs. Note also that the nitrogen input for green roofs is largely atmospheric deposition, a relatively low input compared with values for urban runoff which supply much of the source of nitrogen for the other technologies.
Nitrogen There is an ongoing discussion in the green infrastructure community as to the extent to which living green infrastructure systems, such as green roofs and bioretention cells, leach nutrients to outflowing waters. Previous studies have suggested that these systems can release nutrients based on measured increases in concentration in the outflowing water compared with the concentrations in water entering the facility, rather than considering the mass inflow and outflow of nutrients. Estimates of the percent reduction of total nitrogen based on mass load of influent and effluent shows a stark contrast between bioretention and green roof systems (Figure 8). Bioretention cells effectively capture
Interestingly, detention ponds clearly retain a fraction of stormwater nitrogen inputs (mean retention 49%), which is not reflected in the permanently wet retention ponds (mean retention 12%) or wetlands (mean
Phosphorus
retention 16%). This difference may be due to repeated wetting and drying cycles that occur between storm events in detention ponds, allowing for nitrification and denitrification and facilitating the removal of nitrogen, or simply indicate the load of nitrogen that has infiltrated to groundwater. Wetlands and retention ponds do not exhibit the same nitrogen load capture as detention ponds likely due to a difference in soil chemistry. Swales are expected to perform in a similar manner to detention ponds and bioretention cells based on their infiltration capacity, although it is likely that the grass or sod in the swale has been fertilized, releasing nitrogen to water flowing through these facilities. There were not enough data to report on porous pavement performance for the removal of total nitrogen.
As with nitrogen, we found that phosphorus is leached from the green roofs, and also from swales (fertilizer), wetlands, and porous pavement (Figure 9). Again the release values for green roofs are misleading because precipitation typically contains low concentrations of total phosphorus. Bioretention cells (mean retention 59%), detention ponds (mean retention 13%), retention ponds (mean retention 32%), and media filters (mean retention 17%) all exhibit phosphorus retention to some degree, likely by capturing phosphorus that is associated with suspended matter. Retention ponds and bioretention cells may also capture dissolved phosphorus.
Total Phosphorus Capture
Total Nitrogen Capture 100 –
100 –
0–
50 – % Reduction by Mass
% Reduction by Mass
-100 –
0– -50 –
-100 – -150 –
-200 – -2410%
-250 – BR
MF
D
R
SW
W
BR MF DRSW WGR -
Bioretention: 57.3% Media Filter: 56.8% Detention Pond: 49.4% Retention Pond: 12.4% Swale: 3.71% Wetland: 15.7% Green Roof: -2410%
GR
Stormwater Technology Type
Figure 8. Summary of stormwater capture, loss and leakage of the mass of total nitrogen by technology. The values shown are the average of performance by event observations. Note that observations are not shown for green roofs because the values of runoff retention show much greater net loss than the other technologies (mean value -2410%).
16
-200 – -300 – -400 – -500 – BR RMF DPP WSW GR -
-600 – -700 – -800 – BR
R
MF
D
PP
W
SW
Bioretention: 58.5% Retention Pond: 32.0% Media Filter: 17.3% Detention Pond: 12.7% Porous Pavement: -9.25% Wetland: -19.9% Swale: -76.3% Green Roof: -791%
GR
Stormwater Technology Type
Figure 9. Summary of stormwater capture, loss and leakage of the mass of total phosphorus by technology. The values shown are the average of performance by event observations.
17
CHLORIDE
waters such as application of road salt or inputs from shallow groundwater. Note that green roofs were not monitored for chloride. Our review of the literature found few observations for sodium. We would anticipate high concentrations and loading for sodium based on observations for chloride. We would expect sodium to preferentially be retained on cation exchange surfaces associated with green infrastructure. This accumulation could result in long-term problems in system operation and maintenance. Future studies should involve analysis of sodium and its retention in green infrastructure.
Previous researchers have noted that the accumulation of dissolved salts in living green infrastructure could result in maintenance and performance problems over the long term. However, many green infrastructure facilities receive large quantities of fresh (non-salty) water after the spring thaw, which may facilitate the flushing of accumulated salts. In general, the observations show that the technologies do not accumulate chloride (Figure 10). An apparent exception is bioretention basins, which seem to indicate moderate retention of chloride, but this pattern is based on data for only two bioretention cells. Note that in contrast to many other water quality parameters, chloride is not strongly retained by soil and plants. The net losses of chloride from detention and retention ponds, media filters and porous pavement are likely due to chloride inputs not measured in inflowing
TRACE METALS All the green infrastructure technologies were relatively effective in removing lead and cadmium in influent water (Appendix 2).
Chloride Retention 0–
% Reduction by Mass
-500 –
-1000 –
-1500 – BR SW WDMF RPP -
-2000 –
-2500 –
BR
SW
W
D
MF
R
Bioretention: 26.9% Swale: -16.2% Wetland: -49.7% Detention Pond: -215% Media Filter: -263% Retention Pond: -480% Porous Pavement: -813%
PP
Stormwater Technology Type
Figure 10. Summary of stormwater capture, loss and leakage of the mass of chloride by technology. The values shown are the average of performance by event observations.
18
19
ENABLING FACTORS AND BARRIERS TO ADOPTION OF GREEN INFRASTRUCTURE
3. Thirty-five percent of respondents strongly agreed that a collaborative partnership exists for the development of green infrastructure projects, and 55% agreed that monitoring efforts are often shared with organizations outside of those tasked by the local government. While many respondents agreed that diverse socioeconomic groups are involved in the planning of green infrastructure initiatives (60%), the results are mixed for the involvement of indigenous groups.
Recently there has been a notable growth in green infrastructure adoption after the U.S. EPA released an official statement in support of green infrastructure (U.S. EPA 2007). Many U.S. municipalities have embarked on wide scale green infrastructure programs while others are lagging. We conducted a literature review; a case study in Onondaga County, NY; and a survey to better understand the factors that influence decisions to adopt green infrastructure. Barriers identified through the case study and literature review are summarized in Table 2 and Appendix 3. The survey of municipal officials representing 23 communities that are currently implementing widescale green infrastructure plans was conducted at the second annual EPA Community Summit on Green Infrastructure on October 26-28, 2014. The survey results revealed:
4. The majority of respondents agreed that lack of interdepartmental coordination has been a barrier to green infrastructure adoption (65%). However, many respondents also felt there was not a need to utilize new engineering firms in the development of green infrastructure projects (77%); thus, local technical capacity for green infrastructure may not be a major hindrance for many municipalities. But 79% agreed or strongly agreed that operations and maintenance issues were barriers to adoption.
1. The majority of respondents (55%) strongly agreed that local leadership efforts generally played an important role in the adoption of green infrastructure in their municipality, and that generally these efforts were linked to a collaborative organization. While several communities noted a single individual who had a key role in promoting green infrastructure strategies, many respondents (45%) disagreed that such credit could be placed on an individual.
5. A majority of respondents agreed or strongly agreed that the consideration of social criteria (such as health and recreation benefits 91%) and the dissemination of knowledge from other green infrastructure adopting communities (96%) are critical to the development of a green infrastructure programs. The importance of social criteria may be linked to the fact the adoption of green infrastructure technologies within a framework of purposeful sustainability goals that seek to maximize welfare gains for the respective communities.
2. The majority of respondents agreed or strongly agreed that non-government organizations (NGOs) supporting green infrastructure initiatives are present in their communities (100%) and: are generally helpful in assisting green infrastructure initiatives (92%); act as watchdogs that monitor the actions of the government (87%); and are successful in encouraging green infrastructure use among governing bodies and citizens (87%).
20
CONCLUSIONS
nutrients, with more effective removal in bioretention cells, retention and detention ponds, and media filters. This result is likely due to the removal of the particulate fraction of nutrients. Removal is less effective, based on data used in this analysis, for porous pavement, swales, constructed wetlands, and green roofs. We observed limited accumulation of chloride by green infrastructure.
We offer the following conclusions from this study. •
•
•
There is considerable variation in the effectiveness of green infrastructure to reduce quantities of stormwater by site, event and technology applied. The mean decrease in stormwater inflows by site ranges from large decreases for porous pavement (72%) and bioretention cells (65%) to a negative decrease (or, increase inflows) for constructed wetlands (-11%), media filters (-12%) and retention ponds (-12%). Water retention may be more effective in summer than winter for bioretention cells, porous pavement and green roofs -- technologies which rely on water loss by evaporation. However, given adequate design and operation green infrastructure can perform effectively during the cold season. Performance for removal of contaminants from stormwater varies by technology and contaminant considered. In general, removal is effective across most technologies for suspended solids and trace metals (lead, cadmium). Removal is mixed for
21
•
We recommend that groups developing and applying green infrastructure models use conservative performance estimates for volume reduction in order to ensure that predicted performance and actual performance are aligned. This alignment is important for appropriately managing public expectations and meeting regulatory obligations.
•
Leadership efforts, collaboration with stakeholders (particularly NGOs), consideration of potential social criteria/ co-benefits, and learning from the experiences of other communities are perceived to be key enabling factors for green infrastructure adoption. Lack of interdepartmental coordination and operation and maintenance concerns are perceived to be among the greatest barriers to green infrastructure adoption.
REFERENCES
Godwin, D., B. L. Parry, F. A. Burris, S. S. Chan, and A. Punton. 2008. Barriers and opportunities for low impact development: Case studies from three Oregon communities. Oregon Sea Grant, Oregon State University Corvallis. http://seagrant.oregonstate.edu/sites/default/ files/sgpubs/onlinepubs/w06002.pdf.
Alexander, D., and R. Tomalty. 2002. Smart growth and sustainable development: Challenges, solutions and policy directions. Local Environment 7:397–409. Baptiste, A. K., C. Foley, and R. Smardon. 2015. Understanding urban neighborhood differences in willingness to implement green infrastructure measures: A case study of Syracuse, NY. Landscape and Urban Planning 136 (April):1–12.
Hammitt, S. 2010. Toward sustainable stormwater management: Overcoming barriers to green infrastructure. Massachusetts Institute of Technology. Hunt, W. F., J. T. Smith, S. J. Jadlocki, J. M. Hathaway, and P. R. Eubanks. 2008. Pollutant removal and peak flow mitigation by a bioretention cell in urban Charlotte, NC. Journal of Environmental EngineeringASCE 134:403-408.
Brown, R., M. Farrelly, and N. Keath. 2009. Practitioner perceptions of social and institutional barriers to advancing a diverse water source approach in Australia. Water Resources Development 25:15–28. Carson, T. B., D. E. Marasco, P. J. Culligan, and W. R. McGillis. 2013. Hydrological performance of extensive green roofs in New York City: Observations and multi-year modeling of three full-scale systems. Environmental Research Letters 8:1-13.
Khan, U. T., C. Valeo, A. Chu, and J. X. He. 2013. A data driven approach to bioretention cell performance: Prediction and design. Water 5:13-28. LaBadie, K. 2010. Identifying Barriers to Low Impact Development and Green Infrastructure in the Albuquerque Area. The University of New Mexico. https://repository.unm.edu/handle/1928/12552.
CH2MHill. 2010. Survey of Local Governments That Participated in the 2005-2009 LID Local Regulation Assistance Project. Puget Sound Partnership. http://www.psp.wa.gov/downloads/LID/ PSPSurveyLIDRegulAsistance_23April2010.pdf.
Lassiter, R. 2007. An Assessment of Impediments to Low-Impact Development in the Virginia Portion of the Chesapeake Bay Watershed. M.S. Virginia Commonwealth University. http://scholarscompass.vcu. edu/etd/892/?mode=full.
Clean Water America Alliance. 2011. Barriers and Gateways to Green Infrastructure. Washington D.C. www.uswateralliance.org/pdfs/gireport.pdf.
Madden, S. S. A. 2010. Choosing Green Over Gray: Philadelphia’s Innovative Stormwater Infrastructure Plan. MS. Massachusetts Institute of Technology.
Earles, A., D. Rapp, J. Clary, and J. Lopitz. 2009. Breaking down the barriers to low impact development in Colorado. World Environmental and Water Resources Congress. ASCE 2009:914-923.
McGinnis, M., and E. Ostrom. 2012. Social-ecological system framework: Initial changes and continuing challenges. Ecology and Society 19(2):30. http://www. iub.edu/~workshop/publications/materials/W11-6_ McGinnisEO.pdf.
Flynn, C. D., and C. I. Davidson. 2015. The classification of factors influencing green infrastructure adoption in Onondaga County, NY using the socialecological system framework. In preparation to be submitted March 1, 2015.
22
23
Milwaukee Metropolitan Sewerage District [MMSD]. 2013. Regional Green Infrastructure Plan, MMSD Contract No. M03064P03, MMSD File Code: P8600, June 2013 http://www.freshcoast740.com/ PDF/final/MMSDGIP_Final.pdf.
Philadelphia Water Department [PWD]. 2009. Green City Clean Waters: The City of Philadelphia’s Program for Combined Sewer Overflow Control – A Long Term Control Plan Update, September 2009 http://www.phillywatersheds.org/ltcpu/LTCPU_ Complete.pdf.
Montalto, F. A., T. A. Bartrand, A. M. Waldman, K. A. Travaline, C. H. Loomis, C. McAfee, J. M. Geldi, G. J. Riggall, and L. M. Boles. 2013. Decentralised green infrastructure: The importance of stakeholder behaviour in determining spatial and temporal outcomes. Structure and Infrastructure Engineering 9 (12):1187–1205.
Roseen, R. M., T. P. Ballestero, J. J. Houle, P. Avellaneda, J. Briggs, G. Fowler, and R. Wildey. 2009. Seasonal performance variations for stormwater management systems in cold climate conditions. Journal of Environmental Engineering-ASCE 135:128137.
U.S. EPA. 2007. Green Infrastructure Statement of Intent. U.S. Environmental Protection Agency, April 19, 2007 http://water.epa.gov/infrastructure/ greeninfrastructure/upload/gi_intentstatement.pdf.
Zhou, J., F. A. Montalto, Z. K. Erdal, and P. T. Mcreanor. 2009. Sustainability. Water Environment Research 39:1451-1489. Zhou, J., Z. K. Erdal, P. T. Mcreanor, and F. A. Montalto. 2010. Sustainability. Water Environment Research 82:1376-1395.
WERF, EWRI, EPA, USDOT, APWA, Wright Water Engineers, Geosyntec Consultants. 2013. Master BMP Database v 03 24 13. International Stormwater BMP Database Website. Accessed 11/1/2014. http:// www.bmpdatabase.org.
Zhou, J., P. T. Mcreanor, F. A. Montalto, and Z. K. Erdal. 2011. Sustainability. Water Environment Research 83:1414-1438.
Roy, A. H., S. J. Wenger, T. D. Fletcher, C. J. Walsh, A. R. Ladson, W. D. Shuster, H. W. Thurston, and R. R. Brown. 2008. Impediments and solutions to sustainable, watershed-scale urban stormwater management: Lessons from Australia and the United States. Environmental Management 42(2): 344–359.
Muthanna, T. M., M. Viklander, and S. T. Thorolfsson. 2008. Seasonal climatic effects on the hydrology of a rain garden. Hydrological Processes 22:1640-1649. New York State Department of Environmental Protection [NYC DEP]. 2013. Green Infrastructure Annual Report http://www.nyc.gov/html/dep/pdf/ green_infrastructure/gi_annual_report_2014.pdf.
Ruppert, T., and M. Clark. 2009. Understanding and overcoming legal and administrative barriers to LID: A Florida case study. Low Impact Development for Urban Ecosystem and Habitat Protection, ASCE:1-10. http:// ascelibrary.org/doi/abs/10.1061/41009(333)50.
Olorunkiya, J., E. Fassman, and S. Wilkinson. 2012. Risk: A fundamental barrier to the implementation of low impact design infrastructure for urban stormwater control. Journal of Sustainable Development 5(9):27-41.
Schroll, E., J. Lambrinos, T. Righetti, and D. Sandrock. 2011. The role of vegetation in regulating stormwater runoff from green roofs in a winter rainfall climate. Ecological Engineering 37:595-600.
Oregon Environmental Council. 2007. Stormwater Solutions: Turning Oregon’s Rain Back into a Resource. Portland, OR: Oregon Environmental Council. http:// www.co.benton.or.us/cd/stormwater/documents/ oregonstormwatersolutions_09.pdf.
Siglin, D. D. 2012. Municipal Use of Green Stormwater Infrastructure in The Delaware River Basin: Barriers, Drivers, And Opportunities For Implementation. MS. The Pennsylvania State University. https://etda.libraries. psu.edu/paper/15290/12231.
Ostrom, E. 2009. A general framework for analyzing sustainability of social-ecological systems. Science 325:419-422.
Stockwell, A. 2009. Analysis of Barriers to Low Impact Development in the North Coast Redwood Region, California. MS. Humboldt State University. http://humboldt-dspace.calstate.edu/bitstream/ handle/2148/595/stockwell_thesis_2.12.10_FINAL2. pdf?sequence=1.
24
25
A bioretention cell (BR), also known as a bioretention basin, biofilter or bioswale is a green infiltrative system that captures water from building and roadway runoff by interrupting the traditional urban stormwater pathway and allowing it to collect at a location upstream from the storm sewer inlet. The cells are installed by excavating a pit or trench and back-filling with a porous, low-nutrient media, such as a layer of sand-loam mix over coarse gravel, and topped with a layer of mulch. The site is planted with a variety of native or horticultural species, which are usually fertilized or given compost only during an initial establishment period. The volume of stormwater captured in bioretention cells is related to the contributing area, the size and depth of the soil media, the porosity of the underlying native soil, whether or not the site is equipped with an underdrain and/or liner (not recommended), and to a lesser extent, the types of plants used. The primary mechanisms to reduce runoff are both infiltration and evaporation.
Swales (SW), also called grassed waterways or vegetated filter strips, may be confused with bioretention cells (sometimes called bioswales). Grassed swales are generally planted with grass seed or sod and they may resemble a wide, gently sloping, shallow trench. The soil in the swale may be excavated and replaced with better-draining media replacement, or commonly, native soil that is re-graded to create a trench to facilitate stormwater collection. This type of swale is common in agricultural and transportation applications as well as residential developments to slow the velocity of flow and allow for the removal of suspended solids from runoff via overland sheet flow. Swales with sod have limited connectivity with underlying groundwater, although the amount of infiltration is highly dependent upon the underlying soil type and wetting/drying cycles. Vegetated swales are often maintained by periodic mowing (at weekly to seasonal intervals), whereas bioretention cells are usually not mowed and have much more porous soil.
A green roof (GR) consists of several layers of liners to protect the building structure from water damage, overlaid by a lightweight soil matrix, and planted with a variety of drought-tolerant plants, such as sedums, native or pioneer species, and occasionally, edible or horticultural plants. The volume of stormwater captured by a green roof is directly related to the roof area and depth of the soil media. The primary mechanism to reduce runoff is via evapotranspiration. There are many different types of porous pavement (PP), including porous asphalt, porous concrete, permeable/grassed interlocking pavers, cobblestone, and other materials used for vehicle and pedestrian surfaces. Porous pavement is usually installed over layered courses of gravel or crushed stone and may include an underdrain. The volume of capture depends upon the contributing area, permeable surface area, and infiltration rate. A large fraction of the stormwater capture is diverted to infiltration to groundwater and evaporation through the surface after the storm event. Evaporation from permeable asphalt surfaces is influenced by solar radiation, permeable surface color and the planting scheme of adjacent lands.
Detention ponds (D) are traditional stormwater management structures designed to attenuate the peak of hydrologic discharge during a storm runoff event. They are generally grassed or sparsely vegetated, and nearly always have a piped inlet and outlet. There are subtle differences between detention ponds and swales that are related to the purpose of the structure. Detention ponds appear like a pond when they are full of water, and a grassed field with surrounding berms when they are dry. Detention ponds almost always have distinct culverts or pipes serving as point inlets and outlets, while swales typically receive water as overland
26
flow along the length of the swale. Ideally a detention pond will fill during a wet-weather event and then slowly release the collected water over the 12 to 48 hours that follow the event, providing short-term storage but little permanent capture. Retention ponds (R) are similar to detention ponds, except they maintain permanent standing water, thus creating hydric soils and supporting a different biotic community.
removal, depending on groundwater exchange and oxidation-reduction conditions. APPENDIX 2 Water Quality Results for Lead and Cadmium
LEAD All the green infrastructure technologies were relatively effective in removing lead, including porous pavement and green roofs, which on average had low influent concentrations compared with other technologies (Figure A.2.1). The low concentrations of lead in input waters for green roofs and maybe porous pavement are likely due to lower concentrations in atmospheric deposition, compared to other stormwater sources.
Constructed wetlands (W) are frequently installed in areas adjacent to known tributaries or seasonal rivulets, or in pockets of low-lying, poorly draining soils. They may be built to replace disturbed natural wetlands after the completion of a construction project. They provide additional surface storage during wet-weather events, and may act to infiltrate stormwater or conversely, as a conduit for discharge of groundwater depending on the groundwater table. Wetlands are known to provide flood and inclement weather protection as well as nutrient
Lead Capture 100 –
50 – % Reduction by Mass
A media filter (MF) uses a substrate to remove suspended solids and clarify water as it passes through the filter. Media filters rely on a wide variety of substrates such as sand, peat, geotextile fabric, crushed rock or glass, carbon, shredded paper, rubber pellets, and foam. Media filters, sometimes called “biofilters” because they provide microbiological habitat surface, may also be designed to remove dissolved pollutants, especially ammonia and nitrate. Most media filters have a small storage volume with limited connectivity to natural groundwater tables and therefore may impact water quality without changing overall stormwater volume.
APPENDIX 1 Green Infrastructure Technologies Analyzed
0– -50 –
-100 – GR BR MF DSW RWPP -
-150 – -200 – GR
BR
MF
D
SW
R
W
Green Roof: Bioretention: Media Filter: Detention Pond: Swale: Retention Pond: Wetland: Porous Pavement:
PP
Stormwater Technology Type
Figure A.2.1. Summary of stormwater capture, loss and leakage of the mass of lead by technology. The values shown are the average of performance by site observations.
27
61.1% 49.9% 40.1% 31.8% 22.7% 17.6% 16.9% 12.1%
CADMIUM
APPENDIX 3. Barriers to Adoption
Cadmium was also generally retained effectively by all technologies except for constructed wetlands (Figure A.2.2). The relatively poor performance of constructed wetlands might be explained by the reducing environment of permanently wet soils. The anoxic conditions in wetland ecosystems can create conditions that allow mobilization of cadmium and other trace metals.
familiarity of barriers previously identified1. Many studies focused on barriers facing municipal leaders as well as barriers facing individual actors and other institutions, such as community residents and engineering firms. Categorization of the barriers is based loosely on the social-ecological systems framework (Ostrom 2009; McGinnis and Ostrom 2011). While some studies ranked the severity of various barriers experienced by communities, these results are not expressed in Table A.3.1.
A review of barriers identified in various research efforts related to green infrastructure adoption and implementation is provided in Table A.3.1. Original research efforts (as opposed to synthesis reviews) were considered, including case studies and workshop analyses that focused on green stormwater infrastructure or low impact development technology adoption; thus, barriers to developing sustainable urban water systems were not included. Note that much of the barrier identification literature relies on the solicitation of experts’ perceptions of barriers in combination with a researcher’s
1 For example, barriers identified by Roy (2008) consists of a synthesis of the literature and compilation of the authors’ ideas
Table A.3.1. Summary of barriers to adoption of green infrastructure.
Category
Cadmium Capture
Barrier
Leadership and entrepreneurship
100 –
· Political, community and industry
50 –
Community involvement, partnerships, and outreach Knowledge of system and technologies
-50 –
· Awareness
-100 –
· Mental model of watershed system and infrastructure effects
-150 – GR BR SW MF RDPP W-
-200 – -250 – -300 – GR
BR
SW
MF
R
D
PP
Green Roof: 59.4% Bioretention: 46.5% Swale: 29.2% Media Filter: 28.2% Retention Pond: 24.8% Detention Pond: 24.2% Porous Pavement: 12.8% Wetland: -12.2%
W
Actors
% Reduction by mass
0–
· Cultural preferences · Disparity among public, private, and government actors
(Ruppert and Clark 2009); (Stockwell 2009);(Clean Water America Alliance 2011); (Montalto et al. 2013); (Flynn and Davidson 2015)
(Lassiter 2007); (Oregon Environmental Council 2007); (Godwin et al. 2008); (Roy et al. 2008); (Earles et al. 2009); (Ruppert and Clark 2009); (CH2MHill 2010); (Hammitt 2010); (LaBadie 2010); (Madden 2010); (Clean Water America Alliance 2011); (Olorunkiya, Fassman, and Wilkinson 2012); (Siglin 2012); (Montalto et al. 2013); (Flynn and Davidson 2015); (Baptiste, Foley, and Smardon 2015)
(Montalto et al. 2013); (Flynn and Davidson 2015)
Past experiences
(Montalto et al. 2013); (Flynn and Davidson 2015)
Socioeconomic attributes
(Montalto et al. 2013); (Flynn and Davidson 2015); (Baptiste, Foley, and Smardon 2015)
Number of actors
28
(Godwin et al. 2008); (Madden 2010); (Flynn and Davidson 2015)
Trust and reciprocity among stakeholders
Stormwater Technology Type
Figure A.2.2. Summary of stormwater capture, loss and leakage of the mass of cadmium by technology. The values shown are the average of performance by site observations.
Sources
· Human capital constraints
(Oregon Environmental Council 2007); (Earles et al. 2009);(Stockwell 2009); (CH2MHill 2010); (Flynn and Davidson 2015)
29
Barrier
Regulatory rules and structure · Federal, state and local · Codes and ordinances · Water rights Funding issues · Program funding o Incentives · Cost-effectiveness o Life cycle costs
Governance
o Operation and maintenance costs
Interdepartmental coordination
Property rights/Land ownership
Operation and maintenance · Apportioned responsibility · Compliance · Demands of decentralized projects Repertoire of norms and strategies · Perceived risk · Resistance to change · Disparities between institutions Geographical scale of governance system
Sources
(Lassiter 2007); (Oregon Environmental Council 2007); (Godwin et al. 2008); (Roy et al. 2008); (Brown, Farrelly, and Keath 2009); (CH2MHill 2010); (Earles et al. 2009); (Ruppert and Clark 2009); (Stockwell 2009); (LaBadie 2010); (Madden 2010); (Clean Water America Alliance 2011); (Olorunkiya, Fassman, and Wilkinson 2012); (Flynn and Davidson 2015) (Oregon Environmental Council 2007); (Godwin et al. 2008); (Roy et al. 2008); (Brown, Farrelly, and Keath 2009); (Earles et al. 2009); (Ruppert and Clark 2009); (Stockwell 2009); (CH2MHill 2010); (Hammitt 2010);(LaBadie 2010); (Madden 2010); (Clean Water America Alliance 2011); (Olorunkiya, Fassman, and Wilkinson 2012); (Siglin 2012); (Flynn and Davidson 2015) (Roy et al. 2008); (Brown, Farrelly, and Keath 2009); (CH2MHill 2010); (Hammitt 2010); (LaBadie 2010); (Madden 2010); (Clean Water America Alliance 2011); (Flynn and Davidson 2015) (Brown, Farrelly, and Keath 2009); (Earles et al. 2009); (Clean Water America Alliance 2011); (Siglin 2012); (Montalto et al. 2013); (Flynn and Davidson 2015) (Lassiter 2007); (Oregon Environmental Council 2007); (Hammitt 2010); (Brown, Farrelly, and Keath 2009); (Earles et al. 2009); (Ruppert and Clark 2009); (CH2MHill 2010); (Madden 2010); (Clean Water America Alliance 2011); (Olorunkiya, Fassman, and Wilkinson 2012); (Montalto et al. 2013);
Category
Barrier
Technical capacity and expertise Engineering and Technology
Category
Table A.3.1. Summary of barriers to adoption of green infrastructure (continued).
Research support · Performance uncertainty · Safety Project implementation · Planning and review process · Challenging designs · Design standards and codes
Urban Watershed System
Table A.3.1. Summary of barriers to adoption of green infrastructure (continued).
Biophysical characteristics (particularly regarding site selection) · Available space · Landscape · Soil type
Sources
(Oregon Environmental Council 2007); (Godwin et al. 2008); (Roy et al. 2008); (Earles et al. 2009); (Ruppert and Clark 2009); (Stockwell 2009); (CH2MHill 2010); (Hammitt 2010); (LaBadie 2010); (Madden 2010); (Clean Water America Alliance 2011); (Olorunkiya, Fassman, and Wilkinson 2012); (Flynn and Davidson 2015) (Alexander and Tomalty 2002); (Lassiter 2007); (Oregon Environmental Council 2007); (Godwin et al. 2008); (Roy et al. 2008); (Earles et al. 2009); (Stockwell 2009); (CH2MHill 2010); (Hammitt 2010); (Clean Water America Alliance 2011); (Olorunkiya, Fassman, and Wilkinson 2012); (Oregon Environmental Council 2007); (Godwin et al. 2008); (Roy et al. 2008); (Earles et al. 2009); (Stockwell 2009); (CH2MHill 2010); (Hammitt 2010); (LaBadie 2010); (Clean Water America Alliance 2011)
(Lassiter 2007); (Oregon Environmental Council 2007); (Earles et al. 2009); (Stockwell 2009); (CH2MHill 2010); (Hammitt 2010); (Clean Water America Alliance 2011); (Olorunkiya, Fassman, and Wilkinson 2012); (Siglin 2012); (Montalto et al. 2013)
· Climate Existing stormwater infrastructure
(Earles et al. 2009); (Madden 2010); (Siglin 2012); (Montalto et al. 2013); (Flynn and Davidson 2015)
(Lassiter 2007); (Oregon Environmental Council 2007); (Roy et al. 2008); (Earles et al. 2009); (Ruppert and Clark 2009); (Stockwell 2009); (CH2MHill 2010); (Hammitt 2010); (LaBadie 2010); (Madden 2010); (Clean Water America Alliance 2011); (Olorunkiya, Fassman, and Wilkinson 2012); (Siglin 2012); (Flynn and Davidson 2015) (Stockwell 2009)
30
31
ACKNOWLEDGMENTS Major support for this report was provided by the Surdna Foundation. Additional support for graphic design was provided by the Syracuse University Center of Excellence for Environmental and Energy Systems and the Syracuse University Office of Sustainability Initiatives. We thank the Water Environment Research Foundation (WERF) for access to their Master BMP Database version 03 24 13. The findings and views expressed in this report are solely those of the authors of this report. Assistance, interviews and data were provided by: Center for Watershed Protection – Dave Hirschman and Deb Caraco
Atlantic States Legal Foundation – Samuel Sage
Vermont Department of Environmental
Office of the County Executive, Onondaga County, NY – Joanne Mahoney and Matthew Millea
Protection – Justin Kenney City of Camden, New Jersey – Scott Schreiber
Onondaga Environmental Institute – Ed Michalenko
GeoSyntec – Robert Roseen
Onondaga Nation – Joseph Heath
Wright Water Engineers – Jane Clary
Partnership for Onondaga Creek – Aggie Lane and Lindsay Speer
UNH Stormwater Center – Thomas Ballestero
Upstate Freshwater Institute – Steven Effler and Dave Matthews
CME Associates – Robin Stone Seattle Public Utilities – Shanti Colwell and Shelly Basketfield
Photo Captions Inside front cover: Three constructed wetlands at the Olentangy River Wetland Research Park, on the campus of the Ohio State University in Columbus, OH. Photo: William Mitsch, Florida Gulf Coast University.
Page 19: Paving/grating detail of new tree along Centennial Mall, approaching the State Capitol in Lincoln, NE. Trees are supported below ground by the Silva Cell system, which also allows the trees and soil to manage stormwater on-site. Stormwater enters the system through the pavers and grating shown here. Photo: Lyndsey Haag, DeepRoot (https://flic.kr/p/orP3VP).
Page 1: A bioretention cell or vegetated swale designed to capture runoff from the 690 overpass in Syracuse, NY. Photo: Caitlin Eger, Syracuse University.
Page 21: Native species from the Gadway sandstone pavement barrens planted on the Gateway Building of the SUNY-ESF campus in October 2013 (Syracuse, NY). Photo: Caitlin Eger, Syracuse University.
Page 2: Onondaga County’s Harbor Brook constructed treatment wetlands at the end of its first planted season (Syracuse, NY). Photo: Caitlin Eger, Syracuse University.
Page 22: A detention basin in Seattle, WA, during installation. Photo: Turner Construction Company.
Page 6: Purple coneflower (Echinacea purpurea) in rain garden with permeable pavers in a neighborhood in Chicago, IL. Photo: Center for Neighborhood Technology (https://flic.kr/p/og7eQS).
Page 25: Recently mown residential grassed swale in Montgomery County, MD. Photo: Montgomery County Department of Environmental Protection.
Page 10: Spring seedums on the Syracuse Center of Excellence green roof in Syracuse, NY. Photo: Amanda Westerdahl, Syracuse Center of Excellence.
Page 32 and 33: Because it sits atop a parking garage and rail yard, Chicago’s Millennium Park is considered the largest green roof in the world. Lurie Garden at Millennium Park – Chicago, IL. Photo: Center for Neighborhood Technology (https://flic.kr/p/o1nqXY).
Page 14: Permeable pavers and rain gardens, West Union, Iowa. Photo: Conservation Design Forum, via the Center for Neighborhood Technology (https://flic.kr/p/oq98XY).
32
33
34