IUMPST: The Journal. Vol 1 (Content Knowledge), May 2008. [www.k-12prep.math.ttu.edu]
Infusing Mathematics Content into a Methods Course: Impacting Content Knowledge for Teaching Megan Burton C.J. Daane Instruction and Teacher Education Curriculum & Instruction University of South Carolina University of Alabama Wardlaw 105 Box 870232 Columbia, SC 29208 Tuscaloosa, AL 35487-0231 (803) 777-2698 (205)-348-1199
[email protected] [email protected]
Judy Giesen Educational Studies University of Alabama Box 870231 Tuscaloosa, AL 35487 (205) 348-4081
[email protected]
Abstract This study compared content knowledge for teaching mathematics differences between elementary pre-service teachers in a traditional versus an experimental mathematics methods course. The experimental course replaced 20 minutes of traditional methods, each class, with an intervention of elementary mathematics content. The difference between groups was measured by the Content Knowledge for Teaching Mathematics Measure. Using a mixed ANOVA design, analysis revealed that experimental mathematics methods course participants demonstrated greater growth in mathematics knowledge for teaching. This study suggests that even limited amount of mathematical content embedded in a methods course may make a difference in mathematical content knowledge for teaching. Introduction One of the most widely offered explanations of why K-6 students do not learn mathematics is the inadequacy of their teachers’ knowledge of the mathematics they teach (Beckman et al., 2004; Clarke & Clarke, 2004). For this reason, the education of pre-service elementary teachers in both the effective teaching of mathematics and the understanding of the mathematics they teach has become a central issue in the improvement of elementary school mathematics education. In the past, most teacher education programs followed a format in which mathematics content courses and mathematics methods courses were separate entities, usually taught in separate departments (Ball, 1991; Brown & Borko, 1992; Grouws & Schultz, 1996). Most often, mathematics content courses address mathematics concepts and procedures, while mathematics methods courses focus on learning theories and the application of activities to facilitate learning. There is little opportunity for future elementary educators to explore the specific mathematical content that they will be teaching and even less time to explore it in the manner in which, they are being expected to teach it (Sowder & Schappelle, 1995). This separation of content and pedagogical practice often creates disconnect for both preservice teachers and researchers (Ball, 2000). In the past, researchers have explored two distinct strands to determine mathematical teacher knowledge: mathematical content knowledge and pedagogical content knowledge. However, Hill and Ball (2004) recently identified a third strand, content knowledge for teaching mathematics, which helps connect the other two strands. Content knowledge for teaching mathematics requires an understanding of the relationship between teaching and learning content (Ball, Hill & Bass, 2005). Ma (1999) described the knowledge of mathematics for teaching as flexibility in grasping multiple perspectives and understanding the
M. Burton, C.J. Daane, J. Giesen: Infusing Mathematics Content into a Methods Course: . . . . .
connection of ideas. An example of this knowledge would include understanding various common invented algorithms and understanding common student strategies used to explain their reasoning. Lack of content knowledge for teaching mathematics is especially apparent among teachers in the upper elementary grades. Phillip, Armstrong, and Bezuk (1993) stated that the biggest constraint on upper elementary pre-service teachers’ effectiveness is lack of conceptual understanding, connections, and understanding of how students develop mathematical conceptions. Sowder and Schappelle (1995) indicate that a major explanation for the drop in mathematics achievement of upper grade elementary students is their teachers’ lack of experience and understanding of mathematical content at that level. This suggests the need for research which explores ways to effectively prepare elementary mathematics teachers and strengthen their content knowledge for teaching mathematics. Upon examining effective ways to increase content knowledge for teaching elementary mathematics, Hill and Ball (2004) found that out of 15 professional development institutes in California, in-service teachers demonstrated the greatest growth through professional development that focused on mathematical content and problems they would face as teachers. Furthermore, Hill, Rowan, and Ball (2005) ascertained a correlation between elementary mathematics teachers’ mathematical content knowledge for teaching and elementary student achievement that is greater than the correlation between student socioeconomic status and student achievement.. They found the higher the mathematical content knowledge of the teachers, the higher the achievement of their students. In order to build pre-service teachers’ sense of content knowledge for teaching mathematics, colleges of education need to help pre-service teachers spend as much time as possible with the content they will be teaching while exploring the ways in which elementary students develop conceptions and misconceptions about this content (Phillip, et al., 1993). However, the instructors of mathematics methods courses many times assume that the requisite mathematics content should already have been taught and even if it has not, there is no room in the mathematics methods course to address mathematics content deficiencies. Most instructors may be reluctant to give up any instructional time devoted strictly to mathematics content since they have limited time to handle the vast amount of material that needs to be covered in a mathematics methods course as it was originally designed. Therefore, the purpose of this study was to explore if an intervention of 20 minutes of mathematics content infused into a mathematics methods course, would have an impact on the mathematical content knowledge of pre-service elementary teachers who eventually would be certified to teach Grades K-6. Twenty minutes was the maximum amount of time the researchers believed could be diverted from the traditional mathematics methods course and still maintain the integrity of the methods course. Because research has suggested that teachers’ lack of experience and understanding of upper grade mathematics content is problematic (Sowder & Shapelle, 1995), mathematics content from Grades 5 and 6 was selected for the intervention sessions. Methodology Subjects and Instructors Participants were 44 elementary pre-service teachers enrolled in two randomly assigned sections of a mathematics methods course at a mid-sized university in the southeastern United States. Twenty pre-service teachers were in the experimental (intervention) group while 24 were
2
Issues in the Undergraduate Mathematics Preparation of School Teachers
in the control group. The pre-service teachers in the experimental group consisted of 2 African Americans, 17 Caucasians, and 1 Asian. Three African American and 21 Caucasian pre-service teachers comprised the control group. All were females enrolled in the second semester of their junior year. They were taking the same 16 hours of coursework: mathematics methods, children’s literature, literacy methods, assessment and evaluation, and practicum. In addition, each participant had completed 12 semester hours (four courses) of mathematics prior to this semester. However, those four courses were not necessarily the same for each pre-service teacher. The majority of them had taken four courses from the following: (a) Finite Mathematics, (b) Precalculus Algebra, (c) Numbers and Operations for Elementary Teachers, (d) Geometry and Measurement for Elementary Teachers, or (e) Data Analysis and Probability for Elementary Teachers. Each section of the mathematics methods course was taught by a different instructor. The two instructors had somewhat similar backgrounds. Both were females and had teaching experience in a variety of elementary grades and settings. Both had taught the mathematics methods course in previous semesters. The instructor for the control group was National Board Certified, had earned an educational specialist degree in elementary education and an administrative certificate, and had taught for 26 years. At the time of this study, this instructor was teaching second grade and teaching the mathematics methods course as an adjunct faculty member one evening a week. The instructor for the intervention group had completed most of the requirements for a doctoral degree in elementary education and had taught elementary grades for 10 years. She was in her second year as a full time instructor teaching the mathematics methods course one afternoon a week. Instrument In order to determine if there was a difference in mathematics content knowledge for teaching between the control group and the experimental group, the Content Knowledge for Teaching Mathematics Measure (CKT-M) was used as a pretest (version A) and as a posttest (version B). This instrument was developed by Hill, Schilling, and Ball (2004). The CKT-M was used to measure content knowledge for teaching mathematics by asking questions that are common occurrences in the elementary mathematics classroom. Factor analysis was used by Hill et al. (2004) to determine the underlying dimensions for this instrument. A three-factor solution composed of numbers and operations; algebra, patterns, and functions; and geometry was determined to be the most interpretable solution. The numbers and operations factor is important because it is an integral foundational part of elementary mathematics and involves a large amount of instructional time in these grades. The algebra, patterns, and functions factor also is important since it represents a newer strand and many teachers may not have had training or experience in this area. The factor of geometry is important because of its growing recognition as foundational to future mathematics. Beckmann (2002) considers these three factors as the essence of foundational mathematics. Content validity for the CKT-M was established by multiple interviews and input from mathematicians and elementary mathematic educators (Hill et al., 2004). In addition, an examination of the relation between teachers’ performance on the instrument and those teachers’ real ability was done using cognitive tracing interviews. During these interviews, participants explained the thinking behind their answers. If teachers’ thinking does not reflect their answers, there may be problems of validity. The teachers’ answers were evaluated by mathematicians and
3
M. Burton, C.J. Daane, J. Giesen: Infusing Mathematics Content into a Methods Course: . . . . .
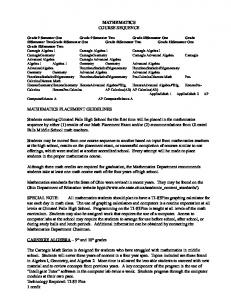
leading mathematics educators and were deemed to be representative of their underlying reasoning about the knowledge of content items Item response theory was used to determine reliability and equate the various forms of the assessment using the Rausch model. The item characteristic curve was found to be 0.559. For this instrument Bilog MG (Zimowski, Muraki, Mislevy, & Bock 2003) was used to estimate both one-parameter and two-parameter models. A two-parameter model on all data items found a reliability of 0.80 on the pretest (n = 652) and 0.83 on the post-test (n = 599) using BILOG MG. The pretest (version A) consisted of 30 stems and 62 multiple-choice items. The posttest (version B) consisted of 31 stems and 64 multiple-choice items. Figure 1 shows a sample stem with three multiple-choice items (also known as a testlet). Because of the different number of items the raw means between the pre-test and post-test are not comparable. Instead, the scoring of the instrument was conducted based upon a common person and common item equated conversion table (Hill et al., 2004). Common item equating, linking items across tests, was used in one pilot test by the authors while common person equating, linking participants across multiple tests, was used in another pilot test. These findings formed an equated conversion table to compare results from the two tests. This equated conversion table converted the raw number correct into a scaled score based upon an item response theory analysis. Figure 1 Sample Item for CKT-M 1. Ms. Dominguez was working with a new textbook and she noticed that it gave more attention to the number 0 than her old book. She came across a page that asked students to determine if a few statements about 0 were true or false. Intrigued, she showed them to her sister who is also a teacher, and asked what she thought. Which statement (s) should the sisters select as being true? (Mark YES, NO, or I’M NOT SURE for each item below.) I’m not Yes No sure a) 0 is an even number. 1 2 3 b) 0 is not really a number. It is a placeholder in writing big numbers.
1
2
3
c) The number 8 can be written as 008.
1
2
3
Design of Study Forty-four pre-service teachers completed the CKT-M (version A) at the beginning of the 16week mathematics methods course. At the end of the semester they were given version B. These instruments were proctored each time by the same impartial test administrator during the scheduled mathematics methods course time. Each of the mathematics methods courses met weekly for 3 hours. However, the course did not meet the last 2 weeks due to time in clinical placements. The first and last session did not have an intervention, due to administration of the pre-test and post-test. Therefore a total of 12 interventions were conducted.
4
Issues in the Undergraduate Mathematics Preparation of School Teachers
In order to construct parallel courses, the two instructors met regularly before the semester began to plan lessons, assignments, and to create the syllabus. During the semester they met weekly to discuss the previous lessons and review the upcoming lesson. This was done to ensure that both courses followed the same lesson plan each week, with the exception of the 20-minute intervention time. The instructors planned separately their 20 minutes of instruction time which differed between the control group and the experimental group. Table 1 shows a sample of the first few weeks of the course and the differences in the use of the 20 minutes. Although the instructor for the experimental group was teaching more upper grade mathematics similar to what was being tested by the CKT-M, neither of the instructors was able to see a copy of the CKT-M nor receive any information about the test results until the semester was over. Table 1 20 Minutes of Instructional Time Week
Topic
Traditional Group
Experimental Group
2
Data Analysis and Probability
Work with class generated data analyzing graphs and generate possible graphing topics
Analyze and evaluate different representations of data and descriptive statistics
3
Data Analysis and Probability
Conduct probability experiments with coins and dice
Examine factors that affect probability
4
Geometry
Read a trade book on the topic Examine angles; use of geometry and do activity based given angle measurements to on the book solve angle measurements
5
Measurement
Use geoboards to find area and perimeter
Analyze mathematical equations to determine area and perimeter
6
Measurement
Use 1” cubes to find the volume of various rectangular prisms
Examine and analyze mathematical equations used to determine volume
7
Place Value/ Numeration
Explore/play place value games for whole and decimal numbers
Compare, analyze, and order whole numbers and decimals; create alternative notations for numbers
8
Operations and computation of whole numbers
Explore regrouping for addition and subtraction with games
Examine the mathematics in standard and alternative algorithms for addition and subtraction
9
Operations and and division from the whole numbers
Do 2 activities on multiplication standard and alternative text; explore how games can be modified for various individual needs
Examine the mathematics in computation of algorithms for multiplication and division
5
M. Burton, C.J. Daane, J. Giesen: Infusing Mathematics Content into a Methods Course: . . . . .
The mathematics methods course typically taught at this university focused on teaching experiences related to children’s developmental learning of elementary mathematics following guidelines of the National Council of Teachers of Mathematics (NCTM) publication Principals and Standards for School Mathematics (PSSM). There was a strong emphasis on teaching strategies, real life applications, technology, manipulatives (NCTM, 2000) and other resources useful in learning how to teach mathematics in grades K-6. The majority of the course was taught through hands-on learning and discussions. The participants were introduced to a variety of mathematical materials and instructional tools to effectively instruct elementary students. The methods course also focused on educating pre-service teachers in the developmental process of conceptual understanding of various mathematical concepts. In addition to the coursework and as part of their practicum, the pre-service teachers spent 180 hours in an elementary classroom where they taught at least five mathematics lessons during the fieldwork, including one 3-day mathematics unit. Intervention Because upper grade mathematics content appears to be an area of concern for elementary teachers, 20 minutes of the experimental group’s time was devoted to covering fifth-grade and sixth-grade mathematical content on the specific content area focus for that mathematics methods session, while the control group continued with expanding some of the pedagogical activities common to both sections. The content topics for the experimental group’s intervention were determined by researching the lessons in fifth-grade and sixth-grade textbooks of the commercially produced basal series adopted by the schools in the area of the study and the most widely used elementary standardsbased textbook in the nation (Weiss, Banilower, McMahon, & Smith, 2001). To see how closely the two textbooks aligned with the methods course, in terms of percentage of time devoted to each separate area of mathematics, an analysis of the content was done. Table 2 illustrates the percentage of mathematical content from each area in Grades 5 and 6 for both textbooks. The percentages were calculated by combining the amount of time the fifth-grade and sixth-grade lessons spent on each topic. In addition, the percentage of time spent on each area was calculated for the methods course. There were some minor adjustments made in both sections of the course to align them more closely with the percentage of time spent in each area of mathematics in Grades 5 and 6. In addition to the two textbook series, the Alabama Course of Study: Mathematics (ACOSM), and the PSSM were used as guidelines for the course content. The ACOSM was used as a guide since teachers in Alabama must adhere to the objectives in that document. It “provides the framework for the K-12 mathematics program in Alabama’s public schools” (Alabama Department of Education, 2003, p. iv). In addition the authors of ACOSM used the PSSM extensively while writing their document.
6
Issues in the Undergraduate Mathematics Preparation of School Teachers
Table 2 Topic Data Analysis & Probability Numbers & Place Value Operations & Computation Algebraic Equations Fractions, decimals, & percents Ratios & Proportions Geometry Measurement
Percentage of Lessons Devoted to Specific Mathematical Topics Everyday Mathematics Houghton Mifflin Methods Course 19%
11%
19%
10%
9%
9%
11%
18%
16%
12%
6%
8%
17%
17%
16%
7%
9%
8%
10%
8%
8%
14%
22%
16%
The 20 minutes of mathematical content in the experimental group was scheduled at the most appropriate time during each lesson. A timer was used to make sure the intervention did not last over 20 minutes. The intervention involved analyzing problems, explaining connections and reasons behind formulas and algorithms, and evaluating mathematical information. Figure 2 shows an example of one 20-minute intervention. Figure 2 Sample Intervention Plan Display Data Transparencies- Have students identify types of graphs taken from the Everyday MathematicsSixth Grade Edition as they are displayed. Bar Graph- Why are there two colors of bars for each label? What does it mean when a bar does not land exactly on a line? Did the areas listed on the map have more or less total snowfalls in 1996 than is average? Could you find the exact mean or median using this graph? Why or why not? Why would you choose to use a bar graph? Line Graph- What kind of graph is this? What do you notice about this graph? What is happening? What would you do to find the mean, mode, and median on this graph? Are two of these measures the same? Does this data set have a mode? What types of information do line graphs usually display? Line Plots- What is this graph called? How is this data set display different from the previous one? What is the range? Maximum? Minimum? What effect do 0 and 35 have on this data? When would one use this type of graph? Stem and Leaf Plot- What type of graph is this? What do the numbers under the leaves column mean? What is the minimum on this graph? What does the minimum do to the reporting of the mean? Median? Mode? Range? When would this type of graph be effective? Why?
7
M. Burton, C.J. Daane, J. Giesen: Infusing Mathematics Content into a Methods Course: . . . . .
Topics for the intervention were based upon the topic for each session of the mathematics methods course. Topics covered included all the NCTM prescribed content strands, including data analysis and measurement, rather than just the three strands of operations and number, geometry, and algebra used in the CKT-M. Results The CKT-M was administered two times (pretest and posttest) in alternate forms. Using a conversion table derived from common person and common item equating, provided at the training for implementing the test, the raw number correct was converted into a scaled score based upon an item response theory analysis, the highest possible score being 6.35 and the lowest possible score being -7.10. The control group scored slightly higher than the experimental group on the pretest and lower on the posttest. Pretest scores scaled scores for the control group ranged from -4.21 to 1.77 with a mean score of -1.14, with higher scores correlating to higher mathematical content knowledge for teaching. The range for the control group’s posttest scores was -4.29 to 6.93 with a mean score of -1.58. Also, the posttest scores for the control group had a range of 11.22, which was the largest range analyzed on this instrument. Pretest scaled scores for the experimental group ranged from -3.91 to 2.64 with a mean score of -1.30. The experimental group had posttest scores ranging from -2.77 to 2.90. The range for this group was 5.67 and the mean was -.36. Group means and standard deviations for each time level are given in Table 3. Table 3 CKT-M Group Means and Standard Deviations Group Pretest Mean Posttest Mean Experimental -1.30 - .36 n = 20 (1.74) (1.42) Control -1.14 -1.58 n = 24 (1.51) (2.19) _____________________________________________________ Note: ( ) represents standard deviations
Using SPSS, a 2 x 2 mixed ANOVA design was used to analyze the data. An alpha level of .05 was used for all statistical tests. The between-subjects variable, Group, had two levels (experimental and control) and the within-subjects variable, Time, had two repeated levels (pretest and post-test). Tests for normality and homogeneity of variance were performed and the results indicated that these assumptions were met. The sphericity and compound symmetry assumptions do not apply when there are only two levels for the within subject factor and therefore were not tested. The between-subjects effect for the Group variable failed to reveal a statistically significant difference, F(1, 41) = 1.22, p = .28, ηp2 = .03. This means that average scores on the CKT-M did not vary between the experimental and the control groups. The effect size was very small (partial η2 = .03), which means the Group variable by itself accounted for only 3% of the overall (effect + error) variance. The Time x Group interaction effect was statistically significant, F(1, 42) = 9.42, p