May 27, 1997 - Time-Of-Arrival and Interferometric systems. Vladislav Mazur, 1 Earle Williams, 2 Robert Boldi, 3 Launa Maier, 4 David E. Proctor s. Abstract.
JOURNAL OF GEOPHYSICAL RESEARCH, VOL 102, NO. D10, PAGES 11,071-11,085, MAY 27, 1997
Initial comparison of lightning mapping with operational Time-Of-Arrival and Interferometric systems Vladislav Mazur,1 Earle Williams,2 RobertBoldi,3 LaunaMaier,4 David E. Proctors Abstract. The mapping of lightning radiation sourcesproducedby the operational Time-of-Arrival National Aeronauticsand SpaceAdministration/LightningDetection and Ranging(NASA/LDAR) systemis comparedwith that of the Interferometric FrenchOffice National D'Etudeset de RecherchesAerospatiales(ONERA-3D) system. The comparisoncompriseslightningactivity in three Florida stormsand also
individualflashesin oneof thesestorms.A•lthough limitedin scope,the comparison and analysisshow a significantdifferencein the representationof lightningradiation by eachmappingsystem. During the durationof a flash,the LDAR data showa continuityin time and a three-dimensionalstructureof radiation sources. The ONERA-3D
radiation
source data are more intermittent
in time and have a more two-
dimensionalstructure. The distinctionbetweenthe radiation sourcesmappedby the
twosystems isalsoreflected inthedifference between theirpropagation speeds, 104105 rns-1, estimated bytheLDARsystem, and107-10 8 rns-1, estimated bythe ONERA-3D system. We infer that this differenceoccursbecausemost of the radiationsourcesmappedwith LDAR are associatedwith virgin breakdownprocesses typical of slowly propagatingnegativeleaders. On the otherhand, most of the radiationsourcesmappedwith ONERA-3D are producedby fast intermittentnegative breakdownprocesses typical of dart leadersand K changesas they traversethe previouslyionizedchannels.Thus eachoperationalsystemmay emphasizedifferent stagesof the lightningflash, but neither appearsto map the entire flash. 1. Introduction
Every researcher should deal with the issue of instm•nentbiasin his interpretations of physicalprocesses.
Historically, knowledge of lightning behavior has advancedpri•narily through the results of various field observations.Nearly two decadesago,the Time-of-Arrival (TOA) andInterfermnetric(ITF) techniques firstpresented the opportunityto studythe dynamicsof lightning with a high degreeof spatialand temporalresolution,by mapping lightningradiationinitially in two dimensionsand later in three [e.g., Proctor, 1971, 1981; Proctor et al., 1988; Richard et al., 1986; Rhodes et al., 1994; Laroche et al., 1994]. Thesetechniques,and alsoin situ •neasurements of aircraft-and rocket-triggeredlightning,are responsiblefor the significantprogressachievedin identifyingindividual lightningprocesses, thusfurtherstimulatingthe searchfor the physical conceptsthat connectexperimentalresults with theoretical models.
• NationalSevereStormsLaboratory, NOAA, Nonnan• Oklahomaø
2 ParsonsLaboratory,Massachusetts Instituteof Technology,Cambridge.
3 LincolnLaboratory,Massachusetts Instituteof Technology, Lexington.
4NASA/KennedySpaceCenter,Florida. 5 Honeydew,SouthAfrica. Copyright 1997 by the American GeophysicalUnion.
Papernumber 97JD00174. 0148-0227/97/97JD-00174509.00
This issue is not limited to whether we observe the whole
processwith a given instrumentor technique,but alsoto whetherwe observethe sameor differentprocesseswith differenttechniquesthat are designedto measurethe same phenmnena.Specifically,in the caseof the TOA and ITF techniquesappliedto lightning processes,we shotfidask whether we are mapping one type of radiation with one system and another type of radiation with the other ("applesversusoranges").We address thisquestion in the paper.
Somehow, the idea of conducting coordinated measurementsof lightning processeswith both TOA and ITF simultaneously did not have much supportin the past, either amongthe principal researchersor the sponsoring agenciesinvolved. We seizedthe opportunityto do the comparisonof the two techniquesduring the 1992 and 1993 stormseasons, when the FrenchoperationalInterfero•netric system (ONERA-3D) operated near Orlando, Florida,lessthan 60 km from the TOA operationalsystem (LDAR) at NASA/Kennedy Space Center (KSC). However, we had no control of the observationswith either
mappingsystembecausewe were not directparticipantsin thesemeasurements. Thereforewe had to searchthrough data sets for simultaneous observations.
The primarygoalof the operational-grade systemis to detectand to set the locationof lightning flashes.On the other hand, the goal of the scientific-gradesystem is to representlightningflashesin great detail. We decidedto 11,071
11,072
MAZUR ET AL.' INITIAL COMPARISONOFLIGHTNINGMAPPING
utilize operational-grade systemsto addressscientific behavioris made possiblethroughthe use of wide bandissuessimplybecause we lackedthe oppommityto do it width radio receivers. In radio interferometry, the difwith scientific-gradesystems. We comparedthe two ferentialphaseat pairs of antennasis usedto calculatethe wave radiatedby the operational mappingsystmns by analyzingsimultaneousarrival angle of an electromagnetic source.The desiredaccuracyin determiningthe phasedif-
measurements of the same flashes and storms.
ference for arrivals at two receivers is best achieved for
2.
Time-of-Arrival
and
Interferometric
Techniques
narrow band CW signalswith approximatedelta function behaviorin the frequencydomain. In TOA, the distancesbetweenreceiving antennasare of the order of several kilometers.
Therefore the time-of-
The TOA technique usesthe differencein arrivaltimes arrival differenceis significantlygreaterthanthe smnpling of electromagnetic wavesat differentantennae to calculate interval of digitization within the data window, thus the positionof the radiationsourceat the intersection of providingthe requiredaccuracyin the pulsepeak timing hyperbolicsurfaces.Maximumprecisionin defaming a [Lennonand Maier, 1991]. In ITF, the baselineis setup time differenceis achievedif the sourceimpulsesare delta in wavelengths and half-wavelengths to resolve the functions.The preservation of approximate deltafunction ambiguityof the arrivalangle[Rhodes,1989].
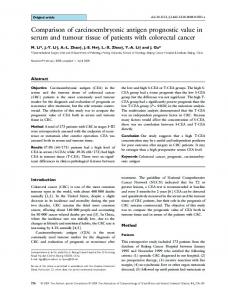
25 gs Figure1. Typesof VHF lightning radiation signals (adapted fromProctoret al. [1988])' (a)individual pulseor onein a slow-rate pulseseries, (b)noise-type radiation, alsocalledQ train,and (c) series of slow-rate pulses recorded at fivedifferent antennae.
MAZUR ET AL.: INITIAL Table
1.
COMPARISON
OF LIGHTNING
MAPPING
11,073
Specificationsof LDAR and ONERA-3D systems
Parameter
LDAR
ONERA-3D
Operatingfrequency, MHz
66
110-118
Data band width, MHz
6
1
Datawindow,gs
82
23
Datacollection rate
104
4x10³
(maximum), events s-1 Number of stations Minimum detectable
signal, dBm Baseline,km
6 remote, 1 central -79
2 remote -75
8-9 average
40
LDAR, LightningDetectionandRanging;ONERA-3D,OfficeNationalD'Etudeset de Recherches Aerospatiales.
From observations obtained earlier with the research-
analyze here therefore fall short of exploring the full capabilitiesof eitherthe TOA or the ITF techniques. The operationalcharacteristicsof each systemwere designedto take advantageof their respectivetechniques. The amplitudesof singlepulsesare higherat 66 MHz than lowrepetition rate(1-100pulses ms-1),withindividualat 110 MHz, which is the reasonwhy 66 MHz is preferable pulsesof approximately1 gs duration;and (2) a more for the TOA system. On the other hand, the ITF uses continuousnoise-typeradiation,lasting tens to hundreds higherfrequenciesto build hardwareof manageabledimenof microseconds, also called K changes or Q trains sions.Illustrationsof the conceptsof the TOA and the ITF [Proctor, 1981]. Theseobservationsand the principlesof systemsare presentedin Figures2 and 3.
grade TOA [Proctor, 1971] and ITF systems [e.g., Richard et al., 1986, Rhodes, 1989], we know that UHFVHF lightning radiation exhibits two distinct types of signals(Figure 1): (1) a discontinuous seriesof pulsesat
operation of the two systemssuggestthe following capabilities, which will be explored further with comparativeobservationsof commonlightning flashes with both mappingsystems:the TOA system(1) is best suitedfor mappingthe individual, spacedpulsesof short duration(a few microseconds long)in a low rateradiation process, (2) resolves pulses separatedin space and occurringat time intervalsgreaterthan the data window, but (3) cannotdiscernindividual pulsesin noise-like Q trains.The ITF system(1) is bestsuitedfor mappingthe Q train sequences (characterized by continuityof phase), but (2) cannot resolve two simultaneouscontinuing radiationprocessessepa-atedin space(e.g., two Q train sequences or oneQ train anda discontinuous sequence of pulses)[Mazur et al., 1994].
The
ONERA-3D
interferometer
consists
of
two
receiving stations:one is a true 3-D stationwith two dis-
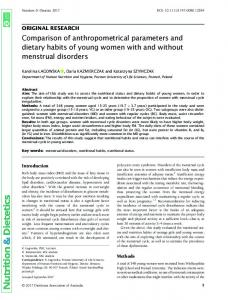
tinctsetsof antennae(sensors) to mea-surethe azimuthand elevationanglesof radiationsources,and the other one is a 2-D stationwith only one azimuthal sensor. The antenna set of the 3-D station is a circular vertical dipole array mountedarounda metallic mast of a 10-m height (Figure 2). The azimuthalsensoris on the top of the mast and is
GPS antenna
Azimuth
sensor
3. Simultaneous Lightning Mapping of the Same Storm by the LDAR and the ONERA3D Systems Simultaneouslightningmeasurements from the same stormswere obtainedby the three-dimensional (3-D) TOA systemat KSC natnedLightningDetectionandRanging (LDAR) [Lennonand Maier, 1991], andby the French interferometer,ONERA-3D [Larocheet al., 1994], during the summers of 1992 and 1993 in central Florida.
Elevation
sensor
I--t--!--I
The
LDAR is an operationalsystemwith real time displayof three-dimensional locationsof lightningradiationsources. The ONERA-3D is an experimental systemthatcalculates three-dimensionallocationsin post analysis,but works as
an operational systemfor two-dimensional (2-D) locations of radiation sources. (We conditionally identify the Data processingunit Data storageunit ONERA-3D asan operational system.)Both systems have dataacquisitionschemes muchcruder(e.g., greaterdata window,highersignalthreshold)thanthosein systemsof scientificgradein orderto decreasethe amountof data Figure 2. The 3-D remote station of the ONERA-3D processed in realtime(seeTable1). Themeasurements we interferometricsystemfor lightningmapping.
11,074
MAZUR ET AL.' INITIAL COMPARISON OF LIGHTNING MAPPING CENTRAL
STATION
TRIGGERS
SYSTEM
CENTRAL
TIME OF PEAK SITE
PULSE
1
t
Ops
t= 14ps
COMPUTER
t=61
•s
t=45
I•S
I(Calculates Location of VHF Sources)
I
lOO i•s WINDOW
25
ATLANTIC OCEAN
15
0
.6
10
15
20
25
30
35
40
DISTANCE (kin)
Figure 3. The signal processing scheme and antenna locations for the LDAR system at NASA/Kennedy SpaceCenter.
made of 8 identical dipoles. Their outputs are used to deliverthreebasicsignalsof the samemagnitude,but with phasesproportionalto the azimuth q, +2q, and-3q. The
provide two basic signalswith a phasedifference. This difference is a nonlinear, continuousfunction of the eleva-
tion angle of a radio source. With this principle, the elevation sensor is installed on the middle of the mast. It highestresolutionis obtainedfor an elevation angle of is madeof two coaxialeightdipolearrays,oneinner (close approximately 220;it is lowerfor anglesunder5ø. Figure to the mast) and one outer (of 1.8 m diameter). The 4 depictsthe locations of the two mapping systemsin passivemixing of the resulting 16 signalsis designedto centralFlorida, the contoursof accuracyin kilometersfor
11,075
MAZUR ET AL.' INITIAL COMPARISON OF LIGHTNING MAPPING
Distance East of FL-2 (km) -40
-30
-20
I
I
29.00
-10
0
10
20
30
40
50
60
70
I km/2D
(?
I km/3D
•
70
•) 60
•31
August 1992 ion
50
28.75
40
3O
14 August 1992
Storm Region
2O
28.50
o
10
z c•
0
ONERA-2 !
28.25
•
I ONERA-1
August 1993
-10
StormRegion
!
! !
-20
!
-30
28.00
-81.75
-81.50
-81.25
-81.00
-80.75
-80.50
Longitude Figure 4. Map of centralFloridawith locations of two remotestations of the ONERA-3Dsystem, LDAR system, andregions of thethreestorms analyzed.TheONERAstation farthest to thewesthas boththe azimuthalandelevationanglesensors; the stationto the easthasonlythe azimuthalangle sensor.Linesof mapping accuracy fortheONERA-3Dsystem aremarkedwithnumbers indicating the magnitude oftheerrorin kilometers. Distance is shown relativetotheradarsite(marked FL2). the ONERA-3D system,and the positionsof the three stormswe analyzed. The height-timeplots of lightningradiationsources from the storm on August 14, 1992, are presentedin Figure5, with heightincrements Az = 500 m, andtime increments At-- 90 s. These increments are the same for
data sets from both systems. This stonn's position
(Figme4) is veryfavorable for mapping withtheONERA3D systembecauseit is in the region of the system's highestlocationaccuracy.This is not the case,however, for the LDAR system,as the stormis at 40-60 km from KSC, toofar for the LDAR to be at maximumaccuracy. The comparison of radiationsourceplotsrevealsthat the regionof greatersourcedensityin the LDAR datais between 6 and 12 km altitude, with its maximum at
approximately 9 km;thisregionin theONERA-3Ddatais
situatedbetweenthe groundand 7 km, with its maximum at appro-ximately5 km. Radiation sourcesmapped by LDAR in the August 14 storm do not extend to the ground,while those mappedby ONERA-3D do. The upper boundaryof radiationsourcesin the LDAR data extendto 18 km, while thosein ONERA-3D remain below 15 kin. Onemay arriveat a similarconclusionconcerning the regionsof greatestdensityfrom examiningplots for the storm on August 31, 1992 (Figure 6), which was located beyond the optimum range of the LDAR system but nearthe edgeof the coveragearea of the ONERA-3D. In this storm, the upper boundary of radiation sources mappedby the ONERA-3D systemis higherthan that in the August 14 storm,up to 20 km (Figure 6), while the vertical extent of the radiation region mapped by the LDAR systemis lessthan that of the August 14 storm.
11,076
MAZUR ET AL.: INITIAL COMPARISONOF LIGHTNING MAPPING second peak in the vertical distribution of radiation sources,which we attributeto the bettermappingaccuracy at closerrange. Althoughthe stormis in closeproximity to the LDAR system(see Figure 4), the only radiation sources mapped are those inside the cloud, and no
20 I ' i ' i ' i ' I-' i ' :.:. :::::
...
'-::::
:55
...
.:..-:
i:: .:-. :i:...:i:i':-. ....
:-:.: :..'. :.: :-;
radiation sources between the cloud and the ground are
.:.:.:.:.:.:.::;:;;:.: ::::::::::::::::;:::::::::::
depicted. For the ONERA-3D system, the storm on August28, 1993, is outsidethe mappingrange,making it the worst case from the point of view of accuracy. Thereforethe abnormallyhigh altitudesof the ONERA-3D sourcesand the abnormally lower altitude of the peak in vertical distribution(Figure 7) are due to poor accuracy resulting from the long distancefrom the storm and the low elevation angles to the sources. What seemsconsistent in comparisonof the plotsin Figures5-7 is that even with the disparityin distancesfrom the storms,the main featuresof the vertical distributionplots for each system and the main differences between the plots for the two systemsremain the same. The difference in the locations of highest source densityregionsis much less noticeablein the X-Y plane plots. These plots show strong similarities between the
15
i:i:i:i:!:':: i:i:Bi:!:'::::,::?..:::-::-:i:.:.:iiiiii'::ii ii!•ii•!i!i•ii!iiii!i:'.:!!!i::i!i!i!iii !:i:i:i:i:i 5
.'.---::'..::i::" :!-'." :.":i:i•":'. i::':': !:':.::::: ::::::::::. ::::::!:•:i:: ::::::::::::::::::::::::::::: ':"':':::
o
lO
g .'.'.'..'.'.'. g- :-;•':-::' •::'g:::
20
::5
0 0
90
nce
)
70
60
50
½4o 0
0
20
40
60
80
1•
120
30
40
Time( •nutes )
50
60
70
E• distance (•
80
90
)
Figure 7. The height-timeandX-Y planeplotsof radiationsources mappedby (a)'theLDAR and(b) the ONERA-3D systemsfor the stormof August28, 1993, 1800-1915 UT.
radiation,Friel [ 1993] estimatedthe duty cycle for IC and CG flashesat VHF (68-71 MHz)'to be between60 and 65%, which indicates that lightning radiates energy throughouta significantportion of the flash (Figures 11 and 12). The distantflashesshow a much smaller duty cycleat 'thesamepowerlevel, usuallyless'than5% (Figure
13), indicating thatmuchof the energyradiated by lightningat the VHF band is weak. Althoughit may be arguedthat someflashesat closerangeshave a radiation duty cycle lower than 60-65%, it is indisputablethat the dutycyclefor the sameflashwill decrease with range. The powerfulradiationburstsseparatedby intervalsof tens of
MAZUR ET AL.' INITIAL COMPARISON OF LIGHTNING MAPPING
11,079
20
1
•
20
ß
I
-,•
•
107 m s-1 [Laroche et al., 1994] (see Fig. 14). It is well documentedthat these processes aremappedby the scientific-grade interferometric system [Rhodeset al., 1994]. Some of the ONERA-3D radiationsourcesin Figures8-10 may be negativestepped
leaders witha slower propagation speed of 105m s-1.
11,082
MAZUR ET AL.' INITIAL -40
COMPARISON
OF LIGHTNING
MAPPING
.
E
-
'13
-
m -60.
-
•
-
:::3
'
._..
C3.
-
E -70
•
=.
..
,.
,.,
-80
--
--
--
--
-
-
-90
55.2
55.4
55.6
55.8
56.0
56.2
56.4
Time (seconds)
Figure 11. VHF radiationof an IC flashat the 8.1 km from the receiver(adaptedfrom Friel [1993]). Here and in Figures 12 and 13, lightning radiationwas receivedwith a VHF antennaof 3 dB beam width in azimuthand elevationplanesof 45ø and71ø, respectively,andof 6 dB gain. The central frequencyof the VHF receiveris 68.5 MHz; the bandwidthis 3 MHz. This is especiallyplau-siblefor identifiedCG flashes.(The radiationsourcesof the downwardnegativesteppedleaders last longer and are more dispersedthan those of recoil streamers[Laroche et al., 1994]). However, even in the multistrokeCG flashes,there are many more dart leaders and K changesthan steppedleaders. In the case of the storm of August 28, 1993, with only 9 of 41 flashes
-20
I
'
'
'
1
'
'
'
I
identified as the CG type, we infer that the majority of radiationsourcesdetectedby the ONERA-3D are attributed to fastpropagatingin-cloudK changes. Strong evidenceexiststhat the ITF systemdoesnot map radiationfrom continuouspositiveleaders,probably becauseof the low amplitudeof their emissionin the VHF band, as indicatedby the radiationmeasurements of long
'
'
'
I
'
'
'
I
'
'
'
I
'
'
'
-
-
_ -
-30
-40
-70
-80
-90
34.0
34.2
34.4
34.6
34.8
35.0
35.2
35.4
Time (seconds)
Figure 12. VHF radiationofa CG flashat 9.8 km fromthe receiver(adaptedfromFriel [1993]).
MAZUR ET AL.' INITIAL COMPARISON OF LIGHTNING MAPPING
11,083
-55
-60
-65
-75
-80
21.30
21.40
21.50
21.70
21.60
21.80
21.9O
Time (seconds)
Figure 13. VHF radiationof a flash at 68.3 km (adaptedfrom Friel [1993]).
140
•
L
ONERA-3D ,
lOO ,
LDAR 40
o
1 03
1 05
1 07 Velocity
1 09
(m/s)
Figure 14. Propagationvelocitiesof radiationsourcesfor fast streamersmappedby ONERA-3D in a typicalstorm(dataprovidedby Laroche,alsousedin Larocheet al. [1994]) andfor lightningbranches (see appendix)in the storm of August 28, 1993, mappedby LDAR. In general,radiation sources
mapped bytheinterferometer alsohavepropagation velocities centered at 105 m s-1 associated with steppedleaders.Thesevelocitiesarepurposelyomittedin the ONERA-3D plot to emphasizevelocities of the majorityof sourcesmappedby the system,that is, fast in-cloudK changes.
11,084
MAZUR ET AL.' iNITIAL COMPARISONOFLIGHTNINGMAPPiNG
gapsparks(A. Bondiou,personalcommunication, 1992) maintaining a lightning discharge is the continuing and field observationsof rocket-triggered discharges breakdownat the tip of the positiveor negative(or both) endsof the lightning double-endedtree that extendsthe [Krehbiel et al., 1994]• channel and its branches into new cloud regions with storedelectrostaticenergy. Owing to the differentnature 5. Discussion of the electricalbreakdownassociatedwith positive and We are well aware that both the TOA and ITF negative leaders, lightning radiation may differ signisystems, in their scientificversionsandunderfavorable ficantly in the signal type, power, and frequencyband. circumstances, producemoredetailin imagesof lightning However,radiationof somekind (impulsive,noise-like,or processes than operational systemslike the LDAR and both)shouldalwaysbe presentduringthe entireflash;in ONERA-3D. The comparison attempted here,of datasets otherwords,in a wide frequencybandand at closerange, obtainedsimultaneously with the two techniques, is the lightning radiation should have a duty cycle close to first of its kind and is, in our opinion,a necessaryand 100%. usefulone.Our analysisshowsa significantdifferencein We concludethatan operational-grade interferometer, therepresentation of light•fingwith eachmappingsystem. like the ONERA-3D, mapsbestfast intermittentprocesses We speculate thatthemaincontributor to thisdifference is like K changesanddartleaders,while an operational-grade thedifferencein thetypeof radiationprocesses mappedby TOA system,like the LDAR, mapsbestthe continuously the two techniques. developingintracloudprocesses.SinceK changesappear The hypothesisthat the differencesin light-ning only in a subsetof previouslyformedchannels,it would representations ascribedto eachsystemare due to the appearthat the LDAR systemdepictsa more compredifferences in distance from the storm rather than to the hensiveimage of lightning. fundamentaldifferencesbetweenthe two techniquesis not Clearly,we considerthe analysispresented hereto be supported by theresultsof thisanalysis.A comparison of purelypreliminary. Additionalscientificexperiments for the radiation density plots (Figures 5-7) shows that comparisonof the TOA and ITF techniquesin lightning independentof the distancefrom the storm to the representation arecertainlydeskable.We expectthatfuture operational system,LDAR doesnotmapradiationsources synchronized,simultaneous lightningobservations with extendingto the ground,while ONERA-3D does;and both systems, collocated and with complementary LDAR showsa peakof sourcedensityat the level of 9-10 electricalandopticalmeasurements, will be ableto provide km heightthat ONERA-3D doesnot. Instead,ONERA- more definitive answers. One suchstudyis presentlyin 3D indicatesa peakof sourcedenityaround5 km height. progress[Shaoet al., 1996]. This contrastis especiallynoticeableif we comparethe vertical distributionsof sourcedensityfor the best cases for bothsystems, whichwouldbe the stormof August14, 1992,for the ONERA-3D (seeFigure5), andthe stormof Appendix: Propagation Speedsof Radiation August28, 1993,for theLDAR syste•n (seeFigure7). Sourcesin the LDAR System The verticaldistributions of sourcedensity(Figures57) also illustratetrendsin mappingresultingfrom the The strikingdistinctionbetweenthe radiationsources increasing distancefromthe storm:the increasing vertical mappedby the two systemsis illustratedby the plot of extent and lower height of the density peak for the propagationspeedsin Figure 14. The velocities of ONERA-3D systemandthe greaterheightof the density radiationsourceprogressionfor the LDAR systemwere peakfor the LDAR system.The factthatthe ONERA-3D calculatedfor individualbranchesof lightningflashessince shows a more two-dimensional
structure of radiation
LDAR can track more than one branch at a time. A branch
sources maybe explained by significant verticalerrorsthat is consideredto be extendingunderthe following condioccurwhen the stormis on the peripheryof the coverage tions:(1) the time intervalbetweenthe lastpointandthe areaforthesystetn.As fortheLDAR system, itsa•ntennaenewpointis lessthan30 ms; (2) thebranch'slastpointis (by design)receivefewer of the signalsbelow 15ø closerto the new pointthanthe otherbranch'slastpoints; pointsis less elevation;andat rangesgreaterthan25 km, lossesof lower and(3) the distancebetweenthe sequential radiationsourcesare significant.
Presumably, the ONERA-3Dmappingshouldshowa more three-dimensional
structure when the storms are
than 1 km. If an existingbranchis haltedin its extension, a new branchis then created. Velocity is calculatedfor each branch that has more than three sources. First, each
favorablylocated,as on August14, 1992(seeFigure4). velocitycomponent, Vx,Vy,andVz,is calculated. The Unfortunately, dataon the individualradiationsources for resultantvelocity is the squareroot of the sum of the velocitiessquared. lightning flashes in this storm were not available. component Thereforewe could not assessthe reversesituation,that is,
whenmappingof individualflasheswouldbe morefavorable for the ONERA-3D, as it was for the LDAR in the Acknowledgments. This work was supportedin part by storm of August 28, 1993. However, in view of the the MIT/Lincoln Laboratory Grant CX-16576 F19628-90-Csimilar features observedboth in radiation maps of all stormsandindividualflashes,we are confidentthatevenif such data had been available, it would not change our generalconclusions. The bidirectionalleaderconcept[Mazur, 1989;Mazur
andRuhnke,1993] emphasizes thatthe essential factorin
0002. We are grateful to Mark Weber for this support. We also appreciate the stimulating discussions with Paul Krehbiel, and we are most grateful to Philippe Richardfor his illuminating commentson the performanceof the ONERA-3D system. Our deep thanks to Marijo Hennagin-Mazurfor her assistancein editing this paper.
MAZUR ET AL.: INITIAL COMPARISON OF LIGHTNING MAPPING References
picturesof lightningflashesto ground,J. Geophys.Res., 93, 12,683-12,727,
Boccippio,D. J., E. R. Williams, S. J. Heckman,W. A. Lyons,L. Baker, and R. Boldi, Sprites,ELF transients,and positive groundstrokes,Science,269, 1088-1091, 1995. Friel, P. J., VHF lightning sensorsand field measurements: An applicationto airportweathermonitoring,Ph.D. dissertation,Departmentof Electrical Engineering, Tufts University, Medford, Mass., June 1993. Krehbiel, P. R., M. Brook, and R. A. McCrory, An analysisof the charge structureof lightning dischargesto ground,J. Geophys.Res., 84, 2432-2456, 1979. Krehbiel,P. R., X. M. Shao,M. Stanley,G. Gray, S. McCrary, R. Scott,J. Lopez, C. Rhodes,andD. Holden, Interferometer observationsof natural and triggered lightning at LangmuirLaboratory,(abstract)Eos Trans.AGU, 75 (44), Fall Meet. Suppl.,99, 1994. Laroche,P., A. Bondiou,P. Blanchet,and J. Pigere, 3D VHF mapping of lightning dischargewithin a storm,Publ. ONERA 1994-127, 1994.
1988.
Proctor,D. E., Regionswhere lightningflashesbegan,J. Geophys.Res., 96, 5099-5112, 1991. Rhodes, C. T., Interferometric observationsof VHF radiation from lightning, Ph.D.thesis,N.M. Inst. of Min. and Technol., Socorro, 1989. Rhodes,C. T., X. M. Shao,P. R. Krehbiel, R.J. Thomas,and C.
O. Hayenga, Observationsof lightningphenomenausing radio interferometry,J. Geophys. Res., 99, 13,059-13,082, 1994.
Richard,P., A. Delannoy,G. Labaune,andP. Laroche,Results of spatialand temporalcharacterizationof the VHF-UHF radiation of lightning,J. Geophys. Res., 91, 1248-1260, 1986.
Shao,X. M., P. R. Krehbiel, R. J. Thomas,and W. Rison, Radio interferometricobservationsof cloud-to-ground phenomenain Florida, J. Geophys.Res., 100, 2749-2783, 1995.
Shao,X. M., M. Stanley,P. Krehbiel,W. Rison,G. Gray, andV.
Lennon, C. L., and L. Maier, Lightning mapping system,NASA Conf publ., 3106, 89-1 to 89-10, 1991. Les RenardieresGroup, Positive dischargesin long air gaps at Les Renardieres-1975 results and conclusions,Electra, 53, 31-153, 1977.
Mazur, V., Physical model of lightning initiation on aircraft in thunderstorms, J. Geophys.Res., 94, 3326-3340, 1989. Mazur, V., and L.H. Ruhnke, Commonphysicalprocessesin natural and artificially triggered lightning, J. Geophys. Res., 98, 12,913-12.930.
11,085
1993.
Mazur,V., X. M. Shao,andP. R. Krehbiel,"Spider"intracloud and positive cloud-to-groundlightning in the late stage of a Florida storm,paperpresentedat International Aerospaceand Ground Conferenceon Lightning and StaticElectricity, Mannheim, Germany,May 24-27, 1994.
Proctor,D. E., A hyperbolicsystemfor obtainingVHF radio picturesof lightning,J. Geophys.Res., 76, 1478-1489, 1971.
Proctor,D. E., VHF radio picturesof cloud flashes,J. Geophys. Res, 86, 4041-4074,1981.
Proctor.D. E., R. Uytenbogaardt,and B.M. Meredith, VHF radio
Mazur, Results of observations with New Mexico Tech
VHF Lightning Interferometer,paperpresentedat 10th InternationalConferenceon AtmosphericElectricity, Osaka, Japan,1996. Williams, E, The tripole structureof thunderstorms,J• Geophys.Res., 94, 13,151-13,167, 1989. R. Boldi, Lincoln Laboratory, MassachusettsInstitute of
Technology,Lexington,MA 02173. (e-snail:obb•ll.mit.edu) L. Maier, NASA Kennedy Space Center, TE ISD 3A, Kennedy Space Center, FL 32899• (e-mail: lmaier• cidnet.ksc.nasa.gov) V. Mazur, National Severe Storms Laboratory, NOAA, Norman, OK 73069. (e-mail: mazur•spock.nsssl.uoknor.edu) D. E. Proctor, P.O. Box 193, Honeydew, 2040 South Africa.
E. Williams, ParsonsLaboratory, MassachusettsInstitute of Technology, Cambridge, MA 02139. (e-mail: earlew• 11.mit.edu)
(ReceivedApril 23, 1996; revisedDecember4, 1996; acceptedDecember 4, 1996.)