Sponsored document from
Injury Published as: Injury. 2011 January ; 42(1): 97–103.
Sponsored Document
Road use pattern and risk factors for non-fatal road traffic injuries among children in urban India Rakhi Dandonaa,b,c,d,⁎, G. Anil Kumara,b,c, Shanthi Ameratungae, and Lalit Dandonaa,b,c,d,f aPublic
Health Foundation of India, New Delhi, India bGeorge Institute for International HealthIndia, Hyderabad, India cHealth Studies Area, Administrative Staff College of India, Hyderabad, India dSchool of Public Health and George Institute for International Health, University of Sydney, Sydney, Australia eSchool of Population Health, University of Auckland, Auckland, New Zealand fInstitute for Health Metrics and Evaluation, University of Washington, Seattle, USA
Abstract Sponsored Document
Objective—We assessed the road use pattern and incidence and risk factors of non-fatal road traffic injuries (RTI) among children aged 5–14 years in Hyderabad, India. Methods—In a cross-sectional population-based survey, data were collected on 2809 participants aged 5–14 years (98.4% participation) selected using multi-stage cluster sampling. Participants recalled non-fatal RTI during the previous 3 and 12 months. RTI was defined as an injury resulting from a road traffic crash irrespective of severity and outcome.
Sponsored Document
Results—Boys (11.5) had a higher mean number of road trips per day than girls (9.6), and the latter were more likely to walk and less likely to use a cycle (p < 0.001). With increasing household income quartile, the proportion of trips using cycles or motorised two-wheeled vehicles increased while trips as pedestrians decreased (p < 0.001). Based on the 3-month recall period, the age-sex-adjusted annual rate of RTI requiring recovery period of >7 days was 5.8% (95% CI 4.9– 6.6). Boys and girls had similar RTI rates as pedestrians but boys had a three times higher rate as cyclists. Considering the most recent RTI in the last 12 months, children of the highest household income quartile were significantly less likely to sustain pedestrian RTI (0.26, 95% CI 0.08–0.86). The odds of overall RTI were significantly higher for those who rode a cycle (2.45, 95% CI 1.75– 3.42) and who currently drove a motorised two-wheeled vehicle (2.83, 95% CI 1.60–5.00). Conclusion—These findings can assist in planning appropriate road safety initiatives to reduce cycle and pedestrian RTI among children to reduce RTI burden in India. Keywords Children; India; Pedestrian; Risk factors; Road traffic injuries
© 2011 Elsevier Ltd. ⁎
Corresponding author at: Public Health Foundation of India, 4/2, Sirifort Institutional Area, August Kranti Marg, New Delhi 110016, India. Tel.: +91 11 4604 6000.
[email protected]@med.usyd.edu.au. This document was posted here by permission of the publisher. At the time of deposit, it included all changes made during peer review, copyediting, and publishing. The U.S. National Library of Medicine is responsible for all links within the document and for incorporating any publisher-supplied amendments or retractions issued subsequently. The published journal article, guaranteed to be such by Elsevier, is available for free, on ScienceDirect.
Dandona et al.
Page 2
Introduction
Sponsored Document
Unintentional injuries are important contributors to the preventable causes of mortality and morbidity among children worldwide. The vast majority of child injury deaths occur in lowand middle-income countries where the injury mortality rate among those aged less than 15 years is five times higher than that in the high-income countries. Drowning and road traffic injuries (RTI) are the two largest causes of injury mortality among children aged 5–14 years. The burden of disease due to injuries is increasing in the developing countries. RTI is the second leading cause of death among those 5–14 years of age worldwide with an estimated 180,000 children 14 years of age or less killed every year. While India still continues to address infectious conditions among children, injuries are emerging as a considerable public health problem with India having one of the highest childhood disability-adjusted life year rates attributable to injuries. RTI were the second leading cause of death and burden of disease among 5–14 years old in India in the year 2000. We assessed the road use pattern, incidence and risk factors for non-fatal RTI among those aged 5–14 years in urban India. Such data are an important input into decision-making related to designing of appropriate RTI policies and intervention programmes and for adapting the existing ones from developed countries to reduce the RTI burden in this age group in India.
Sponsored Document
Materials and methods This study was approved by the Ethics Committee of the Administrative Staff College of India, Hyderabad, India, and the research conformed to the principles embodied in the Declaration of Helsinki. The detailed methodology of this study on people aged 5–49 years is published elsewhere, and the details relevant to this paper are presented. Study design
Sponsored Document
This study was conducted from October 2005 to December 2006 in Hyderabad city (population of 3.8 million in 2001). Hyderabad city was divided into 2542 clusters of mostly 1400–1600 population and listed in sequence of which 50 clusters were selected using a three-stage systematic cluster sampling procedure with equal probability of selection based on their socioeconomic profile. We also selected one cluster of 49 homeless persons to represent this group in the population. Within each cluster (other than the homeless cluster), we enumerated the households and residents in each household. A household was defined as persons eating from the same kitchen. Hostels, hotels, commercial establishments, and prisons were not included. All residents 5–49 years of age in the selected clusters were considered eligible. Systematic sampling, with the first number drawn randomly, was carried out to sample households with the aim of sampling 215–225 eligible people in each cluster. This usually required a sampling interval between 5 and 8 households depending on the total number of households and the eligible population in a cluster. All members aged 5– 49 years in the selected households were sampled. Assuming 85% participation rate, a sample of 11,097 people aged 5–49 years was recruited for the survey. Interviews Trained interviewers obtained written informed consent from eligible people for participation in the study, followed by a confidential interview using a questionnaire designed for this study. Detailed demographic data were obtained for all participants aged 5–49 years. Information was collected from parent/guardian for participants less than 11 years of age, and in the presence of parent/guardian for those aged 11–14 years.
Published as: Injury. 2011 January ; 42(1): 97–103.
Dandona et al.
Page 3
Sponsored Document
Of relevance to this paper, the participants were asked details of their road use including the average number of trips and time spent on road per day, mode of transport, and whether they could ride a cycle or drive a motorised two-wheeled vehicle. The journey from the point of origin to the destination was considered as a trip, and was explained by giving appropriate examples (such as home to school, home to market, play area to home), and they were asked about average number of trips that they made on road and the time spent in these trips on a usual day. The participants recalled if they were involved in road traffic crash (RTC) in the preceding 3 and 12 months. They were then asked about any injury resulting from RTC irrespective of the severity. Detailed data including duration of RTI, vehicles involved, days of recovery/disability, and leaves taken from school/work were documented. If a participant reported more than one RTI during the recall periods, all RTI were documented. RTI was defined as any injury resulting from RTC irrespective of severity and outcome. RTC was explained to the respondent as any crash on a road involving at least one moving vehicle irrespective of it resulting in an injury. This could include collision with a vehicle or any non-moving object while driving/riding a vehicle, skidding/slipping/overturning of a moving vehicle while driving/riding a vehicle, collision with a moving vehicle while walking/running/standing/sitting on road, or fall from a moving vehicle. These explanations were given to each participant before asking questions on RTC and RTI. Data management and analysis
Sponsored Document
Data were entered in an MS Access database and data entered by one data entry operator were checked by another. SPSS was used for statistical analysis. Road use pattern is reported for boys and girls. Annual non-fatal RTI rates are calculated using 3-month recall periods for overall non-fatal RTI and for RTI as recall bias is a major limitation for data on non-fatal injuries, and less severe injuries in particular are underestimated with longer recall periods. We calculated the annual rates for RTI requiring recovery period of ≤7, 7–29 and >29 days for boys and girls wherein the recovery period was defined as days taken to return to normal daily activities as prior to RTI. The RTI rates were adjusted for the age distribution of Hyderabad population, and the 95% confidence interval (CI) include the design effect (DE) for the cluster sampling strategy. The incidence rates are not adjusted for exposure. The incidence of non-fatal RTI as a pedestrian, cycle user, and motorised twowheeled vehicle user are presented.
Sponsored Document
The characteristics of the crash resulting in RTI are presented for the most recent non-fatal RTI in the last 12 months. Univariate and multivariate analyses were performed to understand the association of a variety of risk factors for non-fatal RTI-overall, as a pedestrian and as a cycle user. In the multiple logistic regression models, the effect of each category of a multi-categorical variable was assessed by keeping the first or the last category as reference, and all the variables were introduced simultaneously in the models. Chi-square test for significance is reported where appropriate. Per capita monthly income of household was considered in four quartiles based on the distribution in the study population. Details of the injuries sustained, treatment sought, recovery period, and leave taken are presented. For participants who were still recovering at the time of interview and those who had not recovered, recovery period was taken to be the length of time since sustaining RTI. Estimates for the recovery days and school-person-days lost in Hyderabad annually are presented.
Published as: Injury. 2011 January ; 42(1): 97–103.
Dandona et al.
Page 4
Results A total of 2809 (98.4%) of the 2856 eligible participants aged 5–14 years participated in the study. 1425 (50.7%) were aged 5–9 years and 1460 (52%) were boys. Two hundred and fourteen children (7.6%) were currently employed for work (Table 1).
Sponsored Document
Road use pattern Table 1 summarises the road use details. The average number of trips on road per day was significantly higher for boys (mean 11.5, median 10) than for girls (mean 9.6, median 8). Girls were significantly more likely to walk and less likely to use a cycle for trips in a day when compared to boys (p < 0.001). The overall mean time spent on the road per day by children was 2.14 h (median 2.0), and boys spent significantly more time on the road (mean 2.35 h, median 2.16) than girls (mean 1.93, median 1.66) (p < 0.001). Among the 1045 (37.2%) children who knew how to ride a cycle, 291 (27.8%) were 5–9 years of age. All of the 85 children who currently drove a motorised two-wheeled vehicle were aged 12–14 years (mean 13.6 years), none had a driving license, none reported wearing a helmet, and the mean age at which they started driving a motorised two-wheeled vehicle on the road was 12.5 years. They were significantly more likely to be employed as compared with being a student (p = 0.007).
Sponsored Document
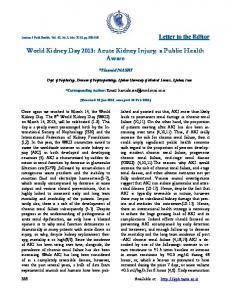
Significant differences were found in the road use pattern for the children based on the per capita monthly household income (Fig. 1). All trips by foot and the time spent on road per day decreased with increasing per capita household income quartile (p < .0.001). On the other hand, the proportion of trips by cycle (p < 0.001) or motorised two-wheeled vehicle (p < 0.001), knowing how to ride a cycle (p < 0.001) or currently driving a motorised twowheeled vehicle (p = 0.002) increased with increasing per capita monthly household income quartile. Incidence of non-fatal RTI
Sponsored Document
Based on the 3-month recall period, the annual age-sex-adjusted rate for overall RTI was 18.5% (95% CI 16.8–20.3; DE 1.5) and for RTI requiring recovery period of >7 days was 5.8% (95% CI 4.9–6.6; DE 1.05). The age-adjusted RTI rates for boys were 23.6% (95% CI 20.6–26.6; DE 1.83), 15.2% (95% CI 12.6–17.7; DE 1.91), 6.1% (95% CI 4.8–7.3; DE 1.04) and 0.9% (95% CI 0.3–1.5; DE 1.51) for overall RTI and RTI requiring recovery period of ≤7, >7–29, and >29 days, respectively. These rates for girls were 13.1% (95% CI 11.1–15.0; DE 1.19), 8.1% (95% CI 6.5–9.6; DE 1.14), 3.6% (95% CI 2.6–4.5; DE 0.94), and 0.9% (95% CI 0.6–1.2; DE 0.42), respectively. Boys and girls had similar RTI rates as a pedestrian and motorised two-wheeled vehicle user, but boys had three times higher incidence of RTI as a cycle user as compared with girls (Fig. 2). Characteristics of non-fatal RTI Based on 12-month recall period, 263 episodes of RTI were reported for 237 children (11% reported more than one episode). Table 2 summarises the characteristics of the 237 most recent non-fatal RTI episodes of which 109 (46%) were as a cycle user, 101 (42.6%) as a pedestrian, 20 (8.4%) as motorised two-wheeled vehicle user and 7 (3%) as other vehicle occupant. A major proportion of the crashes resulting in RTI occurred between 1500 and 1800 h (44.3%) and while on a trip not from/to school or work (81%). Nearly 95% of RTI as a cycle user and 15% of RTI as a motorised two-wheeled vehicle user was as a driver, and 24.8% of RTI as a pedestrian occurred while playing on the road.
Published as: Injury. 2011 January ; 42(1): 97–103.
Dandona et al.
Page 5
Sponsored Document
Collision with another vehicle was the cause of crash in 61.6% of the crashes and vehicle skidding was responsible for 22.3% of the crashes. Presence of sand and small stones on the road accounted for the majority of road-related reasons for vehicle skidding. Sudden application of brakes (due to appearance of a vehicle/person/animal) resulting in fall due to loss of balance were responsible for the majority of vehicle skidding/fall which was not due to road-related reasons. Risk factors for non-fatal RTI On applying multiple logistic regression to the 237 most recent RTI in the last 12 months (Table 3), children who had >15 trips per day on the road had four and two times the odds of RTI as a pedestrian and overall RTI, respectively. Those who rode a cycle and currently drove a motorised two-wheeled vehicle had significantly higher odds of overall RTI. Boys and those who rode a cycle were significantly more likely to have RTI as a cycle user, and those belonging to income quartile IV were significantly less likely to have RTI as a pedestrian. Mother's education level was significantly associated with overall RTI and RTI as a pedestrian. No significant interaction was found between the average number of trips and hours spent on road per day in the logistic models. Injuries, recovery and time off work or school
Sponsored Document
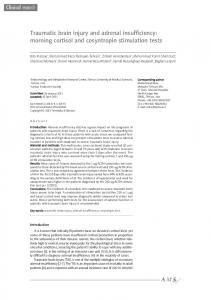
Among the 237 cases of the most recent RTI in the last 12 months, the majority reported injuries on legs (84%) and hand/arm (61.2%), followed by face (16.5%) and head (4.6%). Two (0.8%) reported having not recovered fully following the injuries and 6 (2.5%) were still recovering at the time of interview. A total of 136 (57.4%) had sought medical treatment for RTI as an out-patient and 2 (0.8%) as in-patient. Fig. 3 shows the recovery days and leave days taken due to the most recent RTI for the two sexes and type of road user. The mean number of recovery days required was 9.1 days (median 5.0; range 1–126 days), and RTI as a pedestrian required relatively more recovery days as compared with RTI as a cycle or motorised two-wheeled vehicle user (Fig. 3). Of the 213 children with the most recent non-fatal RTI who were currently in school, 113 (53.1%) reported taking leave from school for that RTI. Of the 24 children with RTI who were employed, 5 (20.8%) took leave from work. The mean number of leave days taken from school/work was 7.94 (median 3.0, range 1–120 days). Two children (1.7%) lost their schooling year due to RTI.
Discussion Sponsored Document
This population-based study describes the road use pattern, and context and risk factors for RTI in children from a large city in India. Extrapolating from a 3-month recall period, we found that 5.8% of children aged 5–14 years had experienced a non-fatal RTI during the previous year which had required a recovery period of more than 7 days. The majority of these RTI were sustained by cyclists or pedestrians. These data confirm the need to consider injuries experienced by children, particularly those who are vulnerable road users, as a public health priority in urban India. To the best of our knowledge, these are the first population-based data on road use pattern of children from a developing country setting. A distinct difference in the road use pattern was seen between boys and girls and based on socioeconomic strata. Girls were less likely to use a cycle and were more likely to walk. This is probably because boys are given more freedom and are less restrained by the parents to move around as compared with girls. This is also reflected in the larger number and variety of cycles available for boys than for girls in India. It is conceivable that the households with lower income are less able to afford a cycle for
Published as: Injury. 2011 January ; 42(1): 97–103.
Dandona et al.
Page 6
their children and hence the children belonging to the lower per capita household income quartile were the least likely to be making road trips using a cycle.
Sponsored Document
A high number of road trips per day were reported for children with the majority making six or more road trips. It is unlikely that the trips were over-reported as the interviewers asked the respondent to mention each road trip on usual days which were then counted to arrive at the number of trips. A little over 80% of RTI were reported during trips which were not related to school/work. More information including qualitative research that explores the reasons and context for these trips is needed to identify the most appropriate road safety interventions that can reduce RTIs in this age group. Though only 3% of children were reported to be currently driving a motorised two-wheeled vehicle, they were significantly more likely to be injured in RTC. This finding is of concern as they were driving a vehicle at an age below the legal age of obtaining a learners license for a motorised two-wheeled vehicle with 50cc engine or less in India (16 years). In addition, none of them reported using a helmet which increases their vulnerability for head injury in case of a crash. We have previously reported that 7.3% of motorised two-wheeled vehicle drivers currently aged 16 years or more in Hyderabad had started driving the motorised two-wheeled vehicle below the age of 16 years. Stricter law enforcement is needed to prevent such driving by children, and measures involving parents, schools and alternative safe public transport systems can also be explored to reduce underage driving on roads.
Sponsored Document
The annual rate of non-fatal RTI requiring a recovery period of more than 7 days for boys and girls in our study was 7.0% and 4.5%, respectively. Compared with the relatively sparse data on childhood RTI reported from many developing countries, the RTI rate was higher in our study. We have previously reported that the relatively higher magnitude of RTI in this population may be related to the methods that we used, which included detailed explanation and probing as well as a short recall period of 3 months to estimate the annual rate. It is important to note that the incidence of minor non-fatal RTI may be underreported in our study because the information on RTI was documented from parents/guardian for children aged 10 years or less, and those 11 years of age may have underreported RTI in the presence of their parents/guardian. The over-representation of cyclists and pedestrians and preponderance of children among RTI victims has been reported in several low- and middleincome countries.
Sponsored Document
Globally, a variety of risk factors relating to the child, vehicle and environment have been identified for unintentional injuries in children, and these the risk factors can vary from one setting to another. We found a higher RTI risk as a cycle user for boys and among those who could ride a cycle. One-third of the cycle injuries were a result of collision with another vehicle and nearly 45% due to skidding/fall from cycle. Cycle is primarily used as a mode of transport and not for recreation in India by children and adults and without a helmet. In addition to increased access to cycles for boys, exposure and mixed traffic patterns are among the major risks for RTI as a cycle user. Pedestrian injuries in children are known to be the highest in Asia and Africa. These data also highlight the protective effect of higher per capita monthly household income on pedestrian RTI. Most pedestrian injuries occurred while walking, crossing or playing on road. It is not uncommon for children to play on roads in India as not many neighbourhoods have playgrounds and residential areas often do not have speed or traffic volume restrictions thereby increasing the risk of RTI for children. They are often unsupervised while playing or while running errands to the local market, and research has shown increased RTI risk with the lack of parental supervision, and that parental supervision can reduce the RTI risk in children. Physical and cognitive developmental factors also increase the risk of RTC among young pedestrians.
Published as: Injury. 2011 January ; 42(1): 97–103.
Dandona et al.
Page 7
Injuries to arms and legs were the most common types of injuries sustained, and more than half of the injured children reported seeking medical care as an out-patient. Fractures to arms and legs are reported to be the most common injuries requiring hospital admissions for children. The injury severity and burden are further highlighted by the days needed for recovery and days lost from school and work.
Sponsored Document
The specific road use pattern and RTI data presented in this paper can be utilised to adapt for our setting the proven strategies used in high-income countries to reduce RTI in children, and to target appropriate sub-populations for these strategies. Further studies that explore the particular relationships between the transport and social environments and the communities in which children are raised and experience RTI could guide further development of interventions that can respond appropriately and efficiently to the Indian context.
Conflict of interest None.
References
Sponsored Document Sponsored Document
1. BartlettS.N.The problem of children's injuries in low-income countries: a reviewHealth Policy Plan17200211311861582 2. BennettS.WoodsT.LiyanageW.M.SmithD.L.A simplified general method for cluster-sample surveys of health in developing countriesWorld Health Stat Q441991981061949887 3. BlockJ.Differential premises arising from differential socialization of the sexes: some conjecturesChild Dev541983133513546661940 4. CarlinJ.B.TaylorP.NolanT.A case-control study of child bicycle injuries: relationship of risk to exposureAccid Anal Prev2719958398448749288 5. CelisA.GomezZ.Martinez-SotomayorA.Family characteristics and pedestrian injury risk in Mexican childrenInj Prev92003586112642561 6. DandonaR.KumarG.A.AmeerM.A.Incidence and burden of road traffic injuries in urban IndiaInj Prev14200935435919074239 7. DandonaR.KumarG.A.AmeerM.A.Underreporting of road traffic injuries to the police: results from two data sources in urban IndiaInj Prev14200836036519074240 8. DandonaR.KumarG.A.DandonaL.Risky behavior of drivers of motorized two wheeled vehicles in IndiaJ Safety Res37200614915816647720 9. DandonaR.KumarG.A.DandonaL.Traffic law enforcement in Hyderabad, IndiaInt J Inj Contr Saf Promot12200516717616335434 10. DeenJ.L.VosT.HuttlyS.R.TullochJ.Injuries and noncommunicable diseases: emerging health problems of children in developing countriesBull World Health Organ77199951852410427938 11. DelgadoJ.Ramirez-CardichM.E.GilmanR.H.Risk factors for burns in children: crowding, poverty, and poor maternal educationInj Prev82002384111928972 12. DonroeJ.TincopaM.GilmanR.H.Pedestrian road traffic injuries in urban peruvian children and adolescents: case control analyses of personal and environmental risk factorsPLoS ONE32008e316618781206 13. EngstromK.DiderichsenF.LaflammeL.Socioeconomic differences in injury risks in childhood and adolescence: a nation-wide study of intentional and unintentional injuries in SwedenInj Prev8200213714212120833 14. FatimahM.OsmanA.MasyarakatJ.K.PerubatanF.The risk of road traffic accidents among primary school children in Kuala TerengganuMed J Malaysia52199740240810968118 15. GhaffarA.HyderA.A.MasudT.I.The burden of road traffic injuries in developing countries: the 1st national injury survey of PakistanPublic Health118200421121715003410 16. GururajG.Injuries in India: a national perspective2005National Commission on Macroeconomics and Health, Ministry of Health & Family Welfare, Government of IndiaNew Delhi
Published as: Injury. 2011 January ; 42(1): 97–103.
Dandona et al.
Page 8
Sponsored Document Sponsored Document Sponsored Document
17. HangH.M.BachT.T.ByassP.Unintentional injuries over a 1-year period in a rural Vietnamese community: describing an icebergPublic Health119200546647315826887 18. HoweL.D.HuttlyS.R.AbramskyT.Risk factors for injuries in young children in four developing countries: the Young Lives StudyTrop Med Int Health1120061557156617002730 19. http://www.atlascycles.co.in/about_ag.asp 20. http://www.avoncycles.com/ 21. http://www.herocycles.com/mainproducts.php 22. HyderA.A.LabinjoM.MuzaffarS.S.A new challenge to child and adolescent survival in urban Africa: an increasing burden of road traffic injuriesTraffic Inj Prev7200638138817114096 23. HyderA.A.MuzaffarS.S.Bachani AMRoad traffic injuries in urban Africa and Asia: a policy gap in child and adolescent healthPublic Health12220081104111018597800 24. KarkhanehM.NaghaviM.RoweB.H.Epidemiology of bicycle injuries in 13 health divisions, Islamic Republic of Iran 2003Accid Anal Prev40200819219918215548 25. KobusingyeO.GuwatuddeD.LettR.Injury patterns in rural and urban UgandaInj Prev72001465011289535 26. KrugE.Injury: a leading cause of the global burden of disease1999World Health OrganizationGeneva 27. KrugE.G.SharmaG.K.LozanoR.The global burden of injuriesAm J Public Health90200052352610754963 28. LinnanM.Anh LeV.U.CuongP.V.Child mortality and injury in Asia: survey results and evidence. Special Series on Child Injury No. 32007UNICEF Innocenti Research CentreGeneva 29. MockC.AcheampongF.AdjeiS.KoepsellT.The effect of recall on estimation of incidence rates for injury in GhanaInt J Epidemiol28199975075510480706 30. MockC.N.AbantangaF.CummingsP.KoepsellT.D.Incidence and outcome of injury in Ghana: a community-based surveyBull World Health Organ77199995596410680242 31. MohanD.Road safety in less-motorized environments: future concernsInt J Epidemiol31200252753212055145 32. MoshiroC.HeuchI.AstromA.N.Injury morbidity in an urban and a rural area in Tanzania: an epidemiological surveyBMC Public Health520051115679887 33. MoshiroC.HeuchI.AstromA.N.Effect of recall on estimation of non-fatal injury rates: a community based study in TanzaniaInj Prev112005485215691990 34. NordbergE.KimaniV.DiwanV.Household survey of injuries in a Kenyan districtEast Afr Med J77200024024412858913 35. PedenM.OyegbiteK.Ozanne-SmithJ.World report on child injury prevention2008World Health OrganizationGeneva 36. PedenM.ScurfieldR.SleetD.World report on road traffic injury prevention2004World Health OrganizationGeneva 37. PlessI.B.VerreaultR.TeninaS.A case-control study of pedestrian and bicyclist injuries in childhoodAm J Public Health7919899959982751039 38. PotterB.K.SpeechleyK.N.KovalJ.J.Socioeconomic status and non-fatal injuries among Canadian adolescents: variations across SES and injury measuresBMC Public Health5200513216343342 39. RazzakJ.A.LubyS.P.LaflammeL.ChotaniH.Injuries among children in Karachi, Pakistan—what, where and howPublic Health118200411412015037041 40. Registrar General of IndiaPopulation totals: India, census of India 20012001Ministry of Home Affairs, Government of IndiaNew Delhi 41. RobertsI.NortonR.JacksonR.Effect of environmental factors on risk of injury of child pedestrians by motor vehicles: a case-control studyBMJ310199591947833733 42. SaegertS.H.R.The development of sex differences in the environmental confidence of childrenBurnettP.Women in society1990Maaroufa PressChicago157175 43. SingerM.S.GhaffarA.Risk factors for road traffic injury in Pakistani childrenJ Coll Physicians Surg Pak14200470971215610626
Published as: Injury. 2011 January ; 42(1): 97–103.
Dandona et al.
Page 9
Sponsored Document
44. SonkinB.EdwardsP.RobertsI.GreenJ.Walking, cycling and transport safety: an analysis of child road deathsJ R Soc Med99200640240516893940 45. ThanhN.X.HangH.M.ChucN.T.Does poverty lead to non-fatal unintentional injuries in rural Vietnam?Int J Inj Contr Saf Promot122005313715814373 46. ToroyanT.PedenM.Youth and road safety2007World Health OrganizationGeneva 47. Transport Commissioner. http://www.aptransport.org/html/driving.htm. 48. World Health OrganizationChild and adolescent injury prevention: a global call to action2005World Health OrganizationGeneva 49. World Health OrganizationGlobal burden of disease project version 52002World Health OrganizationGeneva 50. World Health OrganizationGlobal burden of disease: 2004 update2008World Health OrganizationGeneva
Acknowledgments The authors acknowledge the contribution of Md Abdul Ameer, G. Mushtaq Ahmed, N. Balaji Rao, D. Ram Babu, K. Bhagawan Babu and YRK Satya Prasad in the implementation of this study. Funding: This study was supported by the Wellcome Trust, UK (077002/Z/05/Z). The Wellcome Trust had no involvement in the study design; collection, analysis and interpretation of data; the writing of the manuscript; the decision to submit the manuscript for publication. R. Dandona was supported in part by the National Health and Medical Research Council Capacity Building Grant in Injury Prevention and Trauma Care, Australia.
Sponsored Document Sponsored Document Published as: Injury. 2011 January ; 42(1): 97–103.
Dandona et al.
Page 10
Fig. 1.
Sponsored Document
Road use pattern among children aged 5–14 years based on the per capita monthly household income quartiles. Data on per capita monthly income were not available for 90 children. Trips by cycle and motorised two-wheeled vehicles (MTV) include trips as pillion riders.
Sponsored Document Sponsored Document Published as: Injury. 2011 January ; 42(1): 97–103.
Dandona et al.
Page 11
Fig. 2.
Sponsored Document
Annual incidence of non-fatal road traffic injury (RTI) using 3-month recall period as a pedestrian, cycle user and user of motorised two-wheeled vehicle (MTV) among boys and girls aged 5–14 years. The bars denote 95% confidence interval.
Sponsored Document Sponsored Document Published as: Injury. 2011 January ; 42(1): 97–103.
Dandona et al.
Page 12
Fig. 3.
Sponsored Document
Recovery days and leaves taken for to the most recent road traffic injury (RTI) in the last 12 months for the two sexes and types of road user among children aged 5–14 years. MTV denotes motorised two-wheeled vehicle.
Sponsored Document Sponsored Document Published as: Injury. 2011 January ; 42(1): 97–103.
Dandona et al.
Page 13
Table 1
Road use pattern for boys and girls aged 5–14 years in Hyderabad.
Sponsored Document
Variable
Boys (1460)N (%)a
Girls (1349)N (%)a
Total (2809)N (%)a
5–9
741 (50.8)
684 (50.7)
1425 (50.7)
10–14
719 (49.2)
665 (49.3)
1384 (49.3)
Student
1334 (91.4)
1261 (93.5)
2595 (92.4)
Employed
126 (8.6)
88 (6.5)
214 (7.6)
≤5
161 (11)
299 (22.2)
460 (16.4)
6–10
636 (43.6)
617 (45.7)
1253 (44.6)
11–15
356 (24.4)
231 (17.1)
587 (20.9)
16–20
202 (13.8)
129 (9.6)
331 (11.8)
>20
105 (7.2)
73 (5.4)
178 (6.3)
All road trips for the day were on foot†
900 (61.7)
926 (68.6)
1826 (65.1)
≤1.30
286 (19.6)
458 (34)
744 (26.5)
>1.30–3.00
849 (58.2)
694 (51.4)
1543 (54.9)
>3.00
325 (22.3)
197 (14.6)
522 (18.6)
Can ride a cycle†
747 (51.2)
298 (22.1)
1045 (37.2)
Currently drives a motorised two-wheeled vehicle†
76 (5.2)
9 (0.7)
85 (3)
Age group (years)
Occupation
Average number of trips on road per day†
Sponsored Document
Average time spent on road per day (h)†
Sponsored Document
a
Percent of column total.
†
Chi-square test for difference between boys and girls: p < 0.001.
Published as: Injury. 2011 January ; 42(1): 97–103.
Dandona et al.
Page 14
Table 2
Sponsored Document
Characteristics of crash that resulted in the most recent non-fatal road traffic injuries (RTI) using 12-month recall period among children aged 5–14 years in Hyderabad. Variable
Non-fatal RTI as
All RTI (237)N (%)a
Sponsored Document Sponsored Document
Cycle user (109)N (%)a
Pedestrian (101)N (%)a
Motorised twowheeled vehicle user (20)N (%)a
Other vehicle occupant (7)N (%)a
0600–1100
12 (11)
21 (20.8)
2 (10)
1 (14.3)
36 (15.2)
1101–1500
21 (19.3)
21 (20.8)
6 (30)
1 (14.3)
49 (20.7)
1501–1800
57 (52.3)
41 (40.6)
4 (20)
3 (42.9)
105 (44.3)
1801–1900
13 (11.9)
9 (8.9)
1 (5)
0
23 (9.7)
1901–0559
6 (5.5)
9 (8.9)
7 (35)
2 (28.6)
24 (10.1)
Going/coming from school/work
11 (10.1)
31 (30.7)
1 (5)
2 (28.6)
45 (19)
Going/coming from elsewhere
98 (89.9)
70 (69.3)
19 (95)
5 (71.4)
192 (81)
Driving a vehicle
103 (94.5)
Not applicable
3 (15)
1 (14.3)
107 (45.1)
Riding a vehicle (passenger)
6 (5.5)
Not applicable
17 (85)
6 (85.7)
29 (12.2)
Walking
Not applicable
41 (40.6)
Not applicable
Not applicable
41 (17.3)
Crossing road
Not applicable
31 (30.7)
Not applicable
Not applicable
31 (13.1)
Playing on road
Not applicable
25 (24.8)
Not applicable
Not applicable
25 (10.5)
Other
0
4 (4)
0
0
4 (1.7)
Collision with a vehicle
37 (33.9)
97 (96)
10 (50)
2 (28.6)
146 (61.6)
Vehicle skid/fell due to reasons not related to road
22 (20.2)
Not applicable
2 (10)
0
24 (10.1)
Vehicle skid due to road-related reasons
26 (23.9)
Not applicable
3 (15)
0
29 (12.2)
Other
24 (22)
4 (4)
5 (25)
5 (71.4)
38 (16)
Cycle
11 (26.8)
30 (29.7)
0
0
41 (17.3)
Motorised two-wheeled vehicle
20 (18.3)
51 (50.5)
5 (25)
1 (14.3)
77 (32.5)
Motorised three-wheeled vehicleb
4 (3.7)
17 (16.8)
2 (10)
0
23 (9.7)
None
70 (64.2)
0
9 (45)
5 (71.4)
84 (35.4)
Time of crash (h)†
Reason for being on the road‡
Activity at the time of crash§
Cause of crash§
Other party in the crash§
Published as: Injury. 2011 January ; 42(1): 97–103.
Dandona et al.
Variable
Sponsored Document
Other
Page 15
Non-fatal RTI as
All RTI (237)N (%)a
Cycle user (109)N (%)a
Pedestrian (101)N (%)a
Motorised twowheeled vehicle user (20)N (%)a
Other vehicle occupant (7)N (%)a
4 (3.7)
3 (3)
4 (20)
1 (14.3)
a
Percent of column total.
b
Motorised three-wheeled vehicle includes commercial passenger vehicles.
†
Chi-square test for significance: p = 0.005.
‡
Chi-square test for significance: p = 0.001.
§
Chi-square test for significance: p < 0.001.
Sponsored Document Sponsored Document Published as: Injury. 2011 January ; 42(1): 97–103.
12 (5.1)
Dandona et al.
Page 16
Table 3
Sponsored Document
Association of select variables with the risk of non-fatal road traffic injuries (RTI) using 12-month recall period among children aged 5–14 years using multiple logistic regression. Variable
Total (2809)
Number with overall RTI (% of total)
Odds ratio for non-fatal RTI in the last 12 months (95% confidence interval)
Overall
As cycle user
As pedestrian
Age group (years)* 5–9
1425
99 (6.9)
1.00
1.00
1.00
10–14
1384
138 (10)
1.03 (0.74–1.43)
1.61 (0.989–2.66)
0.82 (0.54–1.26)
Boy
1460
158 (10.8)
1.24 (0.90–1.69)
1.94 (1.16–3.25)
0.93 (0.61–1.40)
Girl
1349
79 (5.9)
1.00
1.00
1.00
Sex†
Sponsored Document
Per capita monthly household income quartiles‡ US$ 25–48.5
531
57 (10.7)
1.24 (0.81–1.88)
1.37 (0.75–2.51)
1.06 (0.57–1.94)
US$ >48.5
433
31 (7.2)
0.76 (0.42–1.38)
0.97 (0.42–2.22)
0.26 (0.08–0.86)
Yes
2595
213 (8.2)
1.00
1.00
1.00
No
214
24 (11.2)
1.20 (0.71–2.04)
0.79 (0.35–1.77)
1.81 (0.88–3.70)
Currently in school§
Average number of trips on road per day#
Sponsored Document
0–5
460
20 (4.3)
1.00
1.00
1.00
6–15
1840
145 (7.9)
1.34 (0.74–2.42)
1.18 (0.47–2.92)
2.21 (0.79–6.20)
>15
509
72 (14.1)
2.18 (1.07–4.46)
1.99 (0.68–5.85)
4.02 (1.24–13.04)
Average number of hours on road per day** ≤1.30
744
38 (5.1)
1.00
1.00
1.00
>1.30–3.00
1543
128 (8.3)
1.36 (0.86–2.13)
1.84 (0.92–3.68)
1.12 (0.57–2.22)
>3.00
522
71 (13.6)
1.97 (1.10–3.51)
1.87 (0.77–4.51)
1.67 (0.71–3.91)
No
1764
96 (5.4)
1.00
1.00
Not applicable
Yes
1045
141 (13.5)
2.45 (1.75–3.42)
8.80 (4.62–16.75)
Can ride a cycle††
Published as: Injury. 2011 January ; 42(1): 97–103.
Dandona et al.
Variable
Page 17
Total (2809)
Number with overall RTI (% of total)
Odds ratio for non-fatal RTI in the last 12 months (95% confidence interval)
Sponsored Document
Overall
As cycle user
As pedestrian
Not applicable
Not applicable
Currently drives a motorised two-wheeled vehicle‡‡ No
2724
215 (7.9)
1.00
Yes
85
22 (25.9)
2.83 (1.60–5.00)
Mother's education level§§ No education
893
69 (7.7)
1.00
1.00
1.00
Class 1–10
1289
123 (9.5)
1.47 (1.03–2.08)
0.95 (0.57–1.58)
2.09 (1.26–3.47)
More than class 10
541
41 (7.6)
1.22 (0.70–2.13)
1.02 (0.48–2.20)
1.66 (0.68–4.08)
Sponsored Document
Mother working status## Not working
702
63 (9)
1.00
1.00
1.00
Working
2014
169 (8.4)
0.98 (0.71–1.36)
0.78 (0.48–1.26)
1.34 (0.85–2.13)
Number of siblings*** None
175
19 (10.9)
1.00
1.00
1.00
1
884
80 (9)
0.82 (0.47–1.45)
0.67 (0.31–1.45)
1.19 (0.44–3.19)
2 or more
1707
137 (8)
0.62 (0.35–1.09)
0.56 (0.26–1.21)
0.86 (0.33–2.28)
*
Chi-square test for significance: p = 0.004,