Dec 20, 2005 - Statistical classification methods can be applied on images of his- ... manuscript inks based on statistical analysis can be applied in situ, to.
Ink recognition based on statistical classification methods Vassiliki KOKLA, Alexandra PSARROU, Vassilis KONSTANTINOU Harrow School of Computer Science, University of Westminster, Watford Road, Harrow HA1 3TP UK December 20, 2005 Abstract Statistical classification methods can be applied on images of historical manuscript in order to characterize the various kinds of inks used. As these methods do not require destructive sampling they can be applied to the study of old and fragile manuscripts. Analysis on manuscript inks based on statistical analysis can be applied in situ, to provide important information on the authenticity, dating and origin of manuscripts. This paper describes a methodology and related algorithms used to interpret the photometric properties of inks and produce computational models which classify diverse types of inks found in Byzantineera manuscripts. The optical properties of these inks are extracted by the analysis of digital images taken in the visible and infrared area of the light spectrum. The inks are modelled based on their greylevel and colour information using a mixture of Gaussian functions and classified using Bayes’ decision rule.
1
Introduction
The aim of this work is to use image-based techniques to complement the reflectographical methods of analysis. This is done by developing computational models for the interpretation of the visual properties of the inks in the visible and infrared areas of the spectrum, therefore providing an in situ and portable quantitative method for the identification of inks used in old manuscripts. In order, however, to develop a generic framework which formulates solutions for ink recognition problems we need a statistical approach
which recognizes: a) the probabilistic nature of the optical ink information we seek to process, and b)the form in which we should express the results. The manuscript inks we examined, were made using a combination of inorganic organic pigments such as metals, salts and vegetable materials. Existing methods used for the examination of pigments can be applied in the analysis of manuscript inks, however, most are based on destructive testing techniques that require the physicochemical sampling of the manuscript under test. Such methods cannot be used widely for manuscripts mainly because of their historical value. Non-destructive techniques such as spectroscopy and reflectography where the optical properties of the pigments are examined under illumination beyond the visible spectrum, are more suited to the study and conservation of old manuscripts. Related machine vision research in the analysis and modeling of color [7], focuses mainly in the visual retrieval of information in the form of digital image libraries [21, 12, 17]. Most of the image-based research on materials used in works of art are focused on generation, rather than analysis, and are mainly applied in the restoration of colors in paintings and frescoes [18, 19, 24]. Granado used mathematical morphology to identify and extract several stylistic components used in antique printed books such as drop capitals, stripes, figures, annotations and text matters, in order to build metadata automatically [13]. In recent years, attempts have been made for the analysis of pigments using electronic video imaging devices in reflectographic and radiographic techniques. These attempts are few and fragmented. Some of the most relevant are included below. The examination of underdrawing lines in artworks [4]. The use of vidicon TV camera for infrared reflectography on artworks [16]. The platinum silicide cameras for use in infrared reflectography on artworks[22, 23]. A more sophisticated approach is the use of band-pass filter reflectography, which helps to discriminate between types of inks [11, 10]. Radiographic techniques and new imaging technologies are used in the study and conservation of paintings [20].The analysis of Anglo-Saxon manuscripts pigments with non-destructive techniques[3]. A method for the elimination of cracks in infrared reflectograms that show the underdrawing - the basic concept of the artist drawn on the ground layer - in ancient wood panel paintings [14]. Manuscript inks, however, are semi-transparent pigments and difficult to characterize because their intensity depends on the amount of liquid spread during scripting and the reflective properties of the support. In this work we show that manuscript inks can be represented in the visible and infrared area of the spectrum through a mixture of Gaussian functions and their optical features can be classified using Bayes’ decision rule. 2
In the remaining of this paper, in Section 2 we give a short description of the composition of inks that were used during this study and present the model and test images used during the experiments of this study. In Section 3 we present the inks analysis. In Section 4 we give some of our results in the classification of manuscript inks. Finally, in Section 5 we conclude the results and propose further research on the morphological analysis of manuscript inks.
2
Background
The main body of manuscript texts is usually written in black, brown or brown-black inks as evidenced by the the cataloging of such manuscripts in museums and libraries. This descriptive term, however, does little to indicate the richness or variety of tones of the inks which fall within this category. The two most common ”brown, black or brown-black” writing fluids were composed of either carbon or metalgall[2]. The carbon inks were composed generally of either soot, lampblack, or some type of charcoal to which gum arabic and solvent such as water, wine, or vinegar were added. The basic ingredients of metalgall inks are copper, iron, galls, gum arabic, and a solvent such as water, wine, or vinegar[5], [9]. The inks used in this study date from the 11th to the 18th century and are employed in manuscripts located in south-east Europe and the eastern Mediterranean areas, especially in areas where the Byzantine Empire and its influence spread. Furthemore, all the text used in this study is Greek. The first aim of our study was to derive models from inks manufactured according to the recipes given in[25] in order to have a basis for comparison with unknown inks. We prepared eight inks with various known chemical compositions, in order to represent as many types of inks as possible. The inks we prepared are as follows: • Carbon ink • Metalgall ink. This category contains the Coppergall inks and Irongall inks. • Incomplete ink. This group includes ink, that have a similar composition to that of metalgall inks, although their composition does not include all of the ingredients of metalgall inks and we treat them as subclasses of metalgall inks(type A,B and C). • Mixed ink. This category contains inks that have ingredients of the first two categories. 3
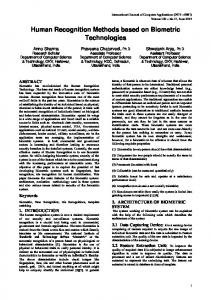
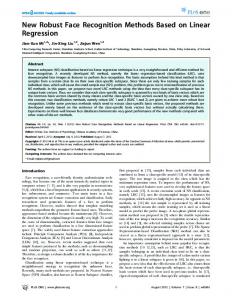
Figure 1: Intensity distribution of inks under infrared radiation. Reflectographical studies on the optical behaviors of the inks under visible and infrared radiation have shown that those inks which appear to have very similar photometric properties under visible light can be identified when viewed under infrared light[1]. This is due mainly to the different chemical composition of the inks. The brightness values of each type of ink under infrared radiation can be modelled through characteristic intensity distribution curves. The intensity distribution of eight types of inks are shown in Figure 1 and show clearly that even though there is a difference in the intensity distribution of inks under infrared radiation, this alone is not sufficient to discriminate between the different inks. One of the main reasons for the uniformity of the results obtained is that as inks are transparent their reflective properties are influenced by the thickness of the liquid used and the reflective properties of underlying support[6]. However, here we show that using a mixture of Gaussian functions result in a more accurate representation of the different types of inks present in the manuscripts. Mixture of Gaussian functions allows the decomposition of the intensities found in an ink, and therefore diversify the ink models as it is shown in Figure 2. Having modelled the inks Bayes’ decision rule can then be used for their classification. In addition to intensity the inks are studies based on their colour information described as Hue (H) and saturation (S). Figure 8 shows the mean 4
Figure 2: Examples of Gaussian mixture models of inks in the infrared radiation. and standard deviation measurements for the hue and saturation values of the inks. As it can be seen inks can not be differentiated based on their hue value, except from ink of type A. By studying the HS values of brown, brown-black and black inks we observe that even though there is not enough information to discriminate the inks based on hue alone, there are differences in the saturation values.
2.1
Inks Images
During our experiments we created images to reflect the scripting conditions found in manuscripts and encapsulate: • The varying thickness of the inks during scripting. • The varying scripting formed due to the different means of writing used, such as quill, calamus and penna. • The writing characteristics of different authors. The images used during our experiments can be separated to those of known chemical composition which include both model and test images 5
Figure 3: Example of grey-level model images. and those on unknown chemical composition that were taken directly from Byzantine and Post-Byzantine manuscripts where an alternative X-Ray Fluorescence Spectrography (XRF)[15] method is employed to establish the ink composition used in the manuscript. This was performed in order to verify the results derived from the image-based technique. Figure 3 shows examples of grey-level model images produced using 1 to 10 layers of varying thickness inks during scripting. A total of 480 images (8 inks x 10 layers x 3 pens x 2 cases letters) of the Greek alphabet were created in both grey-level and color areas. These were grey level images and included all categories of inks, writings produced by various script materials and different script styles.
Figure 4: Example of test images. Test images included scripts produced with inks of known composition and scripts taken from Byzantine and Post-Byzantine manuscripts. Figure 4 shows a grey-level example of the test images of known composition used. The test images were scripting samples using both upper and lower case letters, produced by four different authors. A total of 192 test images of known ink composition were produced(4 authors x 8 inks x 3 pens). In addition four images (Figure 5,) from Byzantine and Post-Byzantine manuscripts were used to test the models. 6
Figure 5: Manuscript images.
3
Inks analysis
Ink images were examined in the areas with thick layers of ink to overcome the problem of any ”noise” introduced by the composition of the support. The segmentation of images can be done using fast Fourier transformations that gives results related to the change of contrast of an image, consequently, these transformations are suitable for our requirements. Using Fourier transformation we created band-pass filters which select frequencies within certain ranges, thus enabling the areas with the greatest amount of ink to be located.
3.1
Grey-level images
Mixture models were created in the isolated areas of images (Figure 6) in order to characterize ink areas as well as possible. Gaussian mixture models of an ink are parametric statistical models which assume that the ink data consists of a weighted sum of basic ink model components. In this approach, each pixel in the model ink is obtained by selecting the lth component of the model as a density in optical feature vector space that consists of a set of M Gaussian models. EM is a widely used method for estimating the parameter set of the ink model. With M distributions for each model ink, more models can be created for any ink of different weights and the characterization of each ink is more real and accurate. Inks in test images are classified using Bayes’ theorem expresses as:
7
P (ωi /x) =
p(x/ωi )P (ωi ) p(x)
Figure 6: Fast Fourier filter. where p(x/ωi ) is the class-conditional probability of ink pixels of test images in relation to inks in model images, P (ωi ) is the prior probability of model inks and p(x) plays the role of normalization factor and ensures that posterior probabilities sum to unity. The class-conditional probability is given by: (α−µ)2 1 e− 2σ2 2πσ Where σ is the standard deviation of the model ink, µ is the mean of model ink and α is the value of pixel of test ink. The normalization factor we obtain:
p(x/ωi ) = √
p(x) =
n X
p(x/ωi )P (ωi )
j=1
where n is the categories of model inks. Examining the Gaussian mixture models shown in Figure 2 we observe that the large weighted component in all inks includes grey levels of high intensity values. This is consistent with our findings that inks can be most readily differentiated in thick layers of ink where the intensity is low, whereas they exhibit similar intensities in thin layers due to transparency. Scripting 8
includes a combination of thin and thick layers and therefore it is likely that the areas of low intensity values will provide more information for differentiation. This is overcome when we take into account the likelihood of each intensity value to occur in an ink compared to the overall occurrence of this value in the manuscript inks. An example is presented in Figure 7 which shows likelihood results for scripts in irongall ink and written using 3 different types of pens (quill, calamus, penna) and in small or capital letters. On the axis x are listed the eight inks in ten different layers (1-80) and on axis y the likelihood of the ink in question. The graph shows that 5 of the scripts were identified as written with irongall ink (the 10 layers of irongall are represented 51-60 on x axis) whereas one of the inks in the script is identified as type A.
Figure 7: Likelihood of script written in irongall and using 3 different types of pens (quill, calamus, penna) in small or capital letters.
3.2
Color images
In the case of color images, we computed HSV values of ink images in the isolated areas of images. These isolated areas were created using band-pass filter to find those areas, where the amount of ink are maximum. After that, we used the EM algorithm to segment these areas of ink from the backgrounds. In computing the hue values we observed that inks have similar hue values because they have similar color. Only one ink can be differentiated based on hue values, from other type of inks. This ink is the typeA ink. But among saturation values of inks are observed differences and the likelihood of 9
each ink based on saturation values can be calculated using Bayes’ decision rule. Mean of hue of inks
Mean of saturation of inks carbon ink100 metalgall ink fourna ink 90 iron ink mixed ink 80 type a ink type b ink type c ink 70
80
Saturation
Hue
60
40
60
20 50 0
0
20
40
40
60
0
20
Inks Standard deviation of hue of inks
60
Standard deviation of saturation of inks 25
40
20
Saturation
50
Hue
30 20 10 0
40 Inks
15 10 5
0
20
40
0
60
Inks
0
20
40
60
Inks
Figure 8: The mean and standard deviation values for Hue and Saturation measurements for the inks.
3.2.1
Saturation values of inks
By studying the saturation values of inks, it is possible to confirm that it can be used as discriminatory factor between various types of inks. An example of the comparison between the model inks and one of the images that contributed to the models is shown in Figure 9. The image is a script written with ink type B using 3 different pens and small and capital letters. Each graph represents the likelihood of the ink used in the script compared to the model inks. On the axis x are listed the eight inks in ten different layers and on axis y the probabilities of ink in question. The graph shows that the ink is correctly identified as type B (11-20).
3.3
Inks comparison
In order to verify the validity of the approach the probability classification of the ink model is compared with: • Each of the images that contribute to the creation of the models. The computation of the model of each ink includes 6 images(3 pens x 2 letter cases). 10
Ink sb5fb
0.8
0.8
0.8
0.6 0.4 0.2
0
20 40 60 Types of inks
0.6 0.4 0.2 0
80
Probabilities of inks
1
0
0
Ink sb5kb
0
20 40 60 Types of inks
0.4 0.2 0
80
0
80
1
0.8
0.8
0.6 0.4 0.2 0
0
20 40 60 Types of inks
20 40 60 Types of inks
80
Ink sb5pb
1
Probabilities of inks
Probabilities of inks
0.2 0
20 40 60 Types of inks
0.6
Ink sb5pa
1 1−10 type a ink 11−20 type0.8 b ink 21−30 type c ink 31−40 carbon ink 0.6 ink 41−50 fourna 51−60 iron ink 61−70 metalgall ink 0.4 71−80 mixed ink
Probabilities of inks
Ink sb5ka
1
Probabilities of inks
Probabilities of inks
Ink sb5fa 1
80
0.6 0.4 0.2 0
0
20 40 60 Types of inks
80
Figure 9: The likelihood of type B ink based on saturation information • The test scripting images that are created by different authors. • Images of unknown ink composition taken from the manuscripts. The probability classification of inks gave us important results in our attempts to characterize manuscript inks and as the results show in most cases, the identification of inks is feasible. The results fall into three categories: a)Successful : A result is to be considered as successful when the correct model ink is identified; b)Screening: A result is to be considered as screening when the correct model ink is included among the first three results; c)Unsuccessful : A result is to be considered as unsuccessful when the correct model ink is not included among the first three results. Furthermore, in the case of grey level images a threshold value of 0.05 and in the case of color images a threshold value of 0.15 were used in order to measure the strength of the results given by the estimated likelihood of test inks. The threshold value is the distance between the identified model ink and the other remaining evaluated models. Any probability above 0.05 and 0.15 indicates a strong certainly that the model ink recognized is the correct one, whereas any value below 0.05 and 0.15 indicates a weaker certainty in the results.
11
4
RESULTS
4.1 4.1.1
Model images Grey-level images
Figure 10: Estimated likelihood based on intensity values. Figure 10 shows the percentage of the successful and screening results when the inks models are tested against images that were incorporated in the computation of the model inks. The results are based on the computation of the ink probabilities under visible and infrared area of spectrum. The following observations are made: • All inks was identified and screened in both areas, visible and infrared areas. In this classification, the screening results are taken into account. • Irongall ink was identified and screened in both areas, visible and infrared and the corresponding results are 75% for infrared area and 83.4% for visible area. • TypeA, typeB, typeC and carbon inks can be identified and screened in infrared area and their results were 65%, 91.7%, 53.3% and 75% respectively. • Coppergall, Fourna’s and mixed inks had been identified and screened results in visible area. The corresponding successful and screening results for these inks are 51.7%, 63.3%, 71.6% respectively. 12
Figure 11: Certainty estimation for likelihood based on grey-level values. The strength was also computed in order to determine the accuracy of the method. Figure 11 shows the percentage of successful identified models above the threshold value of 0.05(strong results) and the percentage of the correct identified models below the threshold value(weak results). Observing the results in Figure 11 we can make the following comments: • More successful results were strong in infrared area which suggests that these results are reliable. In visible area the percentage of strong results is low. Only Fourna’s and irongall inks have strong results in this area of spectrum. • Irongall ink presents high percentage of strong results in both illuminations. • TypeA, typeB and carbon inks offer high percentage of strong results in infrared area. The smallest percentage of strong results are presented by the typeC, mixed and coppergall inks. • Fourna’s ink displays a high percentage of strong results in visible area, whilst it displays a high percentage of weak, and therefore unsuccessful, results in infrared area. 4.1.2
Color images
Inks models are tested against images incorporated in the computation of the model inks. Figure 12 presents the following results: 13
Results of saturation values of inks Screening Successful Type C
8
Type B
7
Type A
6
Mixed
5
Irongall
4
Fourna
3
Coppergall 2
Carbon
1
0
10
20
30
40 50 60 Percentage of success
70
80
90
100
Figure 12: Estimated likelihood based on saturation values. 1. Mixed and typeB inks were successfully identified in 68% of cases. 2. TypeA and carbon inks provided successful results and screening in 58% of cases. 3. Coppergall, typeC, irongall and Fourna’s inks were not identified and screened results through probability analysis of the ink saturation. We also computed the strength of the results above in order to determine the accuracy of the method. Figure 13 shows the percentage of successful identified models above the threshold value of 0.15(strong results). More of successful results were strong in infrared area, which suggests that these results are reliable.
4.2 4.2.1
Test images Grey-level images
Figure 14 shows the results of the scripting test images in infrared and visible areas prepared by four different authors. By the examination of the results occurs that the classification of most inks were possible. In particular: • TypeB, irongall, Fourna’s and coppergall inks can be identified and screened in both the infrared and visible areas. • TypeC, typeA and carbon inks can be identified and screened only in the infrared area. 14
Strong results of successful and screening results of inks
Type C
8
Type B
7
Type A
6
Mixed
5
Irongall
4
Fourna
3
Coppergall 2
Carbon
1
0
10
20
30
40
50 60 Strong success
70
80
90
100
Figure 13: Certainty estimation for likelihood based on saturation values.
Figure 14: Estimated likelihood of test inks based on saturation values. • Mixed ink can be identified and screened only in the visible area. The ink model were also tested against Byzantine and Post-Byzantine manuscripts of unknown ink composition. The ink composition of the manuscript images, which was known from XRF method were compared with the results given by the image-based analysis of the manuscripts. Figure 15 gives the results of the probability of the four manuscripts in the infrared area. A comparison of the results derived by the XRF method and infrared probability image-based is shown in table1. The results show that the ingredients 15
Manuscripts Memosa Memosaa Memosb Memosc
XRF Fe Fe F e and Cu F e and Cu
image-based TypeA TypeA Carbon, TypeC, Coppergall TypeC and TypeB
Table 1: Comparison between XRF and image-based results on the manuscripts.
of the inks used in four manuscripts can be determined by the probability estimation image-based results. In particular:
Figure 15: Estimated likelihood of manuscripts based on intensity values • The ink TypeA which have been identified as the correct models as the inks of manuscripts memosa and memosaa include in their composition iron, as shown in XRF measurements for these two manuscript inks. • The inks of TypeC and Coppergall which have been identified as the correct models as the ink of manuscript memosb include in its composition copper, as shown in the XRF measurements for this manuscript ink. The ink Carbon which have been found in memosb with the probability image-based analysis, didn’t detect in composition of manuscript ink as shown in XRF measurements for this manuscript ink. • The ink typeC which has identified as correct models as the correct models as the ink of manuscript memosc include in its composition copper, as shown in the XRF measurements for this manuscript. 16
4.2.2
Color images Results of saturation values of standinks Screening Successful Type C
8
Type B
7
Type A
6
Mixed
5
Irongall
4
Fourna
3
Coppergall2
Carbon
1
0
10
20
30
40 50 60 Percentage of success
70
80
90
100
Figure 16: Estimated likelihood of test images based on saturation values Figure 16 shows the results of the scripting test images. Consideration of these results leads following conclusions: 1. Mixed, typeA, typeB inks can be identified and screened based on the saturation value of ink pixels. 2. Carbon, coppergall, Fourna’s, irongall and typeC inks cannot be identified. The ink models were compared against authentic manuscripts of unknown composition, which was known from XRF method. Figure 17 shows the results of the probability of the saturation of ink pixels of four manuscripts . A comparison of the results derived by the XRF method and the saturation probability image-based is shown in table2. The results show that: • The mixed, Fourna’s and typeB inks which were found in memosa with the saturation probability image-based analysis, didn’t detect in composition of manuscript ink as shown in XRF measurements for this manuscript ink. • The inks of TypeB and mixed which were found in memosaa with the saturation probability image-based analysis, didn’t detect in composition of manuscript ink as shown in XRF measurements for this manuscript ink. 17
Figure 17: Estimated likelihood of manuscripts based on saturation values. • The saturation probability image-based analysis indicated that the inks employed for memosb and memosc are to be identified with the model mixed ink. The XRF measurements showed that these inks of manuscripts memosb and memosc contained copper in their composition as mixed ink contains also copper in its composition. The ink typeB which was found for memosb and memosc with the saturation probability image-based analysis, didn’t detect in composition of manuscript ink as shown in XRF measurements for these manuscript inks. The same happens for the Fourna’s ink which was found as the correct models as the ink of manuscript memosc and includes in its composition copper, as shown in the XRF measurements. Manuscripts Memosa Memosaa Memosb Memosc
XRF Fe Fe F e and Cu F e and Cu
saturation probability image-based TypeB, Mixed, Fourna’s TypeB, Mixed TypeB, Mixed TypeB, Mixed, Fourna’s
Table 2: Comparison between XRF and the saturation probability image-based results on the manuscripts.
18
5
CONCLUSIONS - FUTURE WORKS
The methodology of this study is based on the probability classification of ink pixels through mixture Gaussian models of diverse types of inks. Analysis in the visible areas mainly reflect the ink intensity whereas analysis in the infrared area reflects the ink composition. Analysis of color images reflects also the color characteristics of various types of inks. Models of the inks are created based on mixture Gaussian functions and we have taken into account scripting with different pens, authors and the thickness of the inks. Based on the results presented we can conclude that statistical analysis and classification based on Bayes’ decision rule classification can provide reliable information towards the discrimination of manuscript inks when intensity values are used. Results are not that clear when saturation values are used. Whilst the probability classification identified or screened all inks in this study, further work is currently undertaken to combine these results with additional characteristics of the behavior of the inks during the scripting process
6
Acknowledgments
We would like to thank the Greek State Scholarships Foundation (IKY) for its support towards the results of this work.
References [1] Alexopoulou A. ,Kokla V. Physicochemical study of inks of manuscripts using ultraviolet and near infrared radiation. 6th International Conference on Non-Destructive Testing and Microanalysis for the Diagnostics and Conservation of the Cultural and Environmental Heritage, 1999, vol. 2, pp. 2047-2056. [2] Barrow W.J. Manuscripts and Documents. University Press of Virginia, edition 2nd, 1972. [3] Clark M. Anglo-Saxon manuscript pigments. Studies in Conservation,Vol. 49, no 4, 2004, pp. 231-244. [4] Delaney J.K., Metzger C., Walmsley E. Examination of the Visibility of Underdrawing Lines as a Function of Wavelength. ICOM Committee for Conservation, 10th Triennial Meeting, Washington, 1993, pp. 15-19.
19
[5] De Pas M. Etat des travaux effectues sur l’ analyse des consititues des encres noires manuscripts par deux technique: chromatographie sur couche mince et electrophorese. Comite pour la conservation de l’ ICOM, 1975. [6] Derrick R. Michele, Stulik Dusan, Landry M. James. Infrared Spectroscopy in Conservation Science. The Getty Conservation Institute, Los Angeles, 1999. [7] Emmel P., Hersch R. D. Spectral Color Prediction Model for a Transparent Fluorescent Ink on Paper. IS&T/SID 6th Color Imaging Conference: Color Science, Systems and Applications, USA, 1998, pp. 116-122. [8] Fletcher S. A Preliminary Study of the Use of Infrared Reflectography in the Examination of Works of Art on Paper. ICOM Committee for Conservation, 7th Triennial Meeting Preprints, Copenhagen, (1984), 84, 14, pp.24-27. [9] Flieder F., Barroso R., Orvezabal C. Analysis des tannins hydrolysable susceptibles d’ entrer dans la composition des encres ferro-geliques. 1975. [10] Fossier L. and Irigoin J. Dechiffrer les ecritures effacees. Centre National de la Research Scientifique, Paris, 1990. [11] Fuchs R. and Oltrogge D. Modern scientific manuscript research and conservation. in Fellows-Jensen G. and Springborg P., eds, Care and conservation of manuscripts 3: Proccedings of third international seminar on the care and conservation of manuscripts held at the University of Copenhagen 14th-15th October 1996, The Royal Library, Copenhagen, 1997, pp. 77-98. [12] Gevers, T. and Smeulders, A. A comparative study of several color models for color image invariant retrieval. Proc of First Int. Workshop on Image Databases and Multimedia Search, pp 17-27, Amsterdam, August, 1996. [13] Granado I. Automatic feature extraction on pages of antique books through a mathematical morphology based methodology. Actas de 10EPCG-10 Encontro Portugues de Computacao Grafica, Lisboa, Portugal, 2001, pp. 115-122. [14] Hanbury A., Kammerer P., Zolda E. Painting Crack Elimination Using Viscous Morphological Reconstruction. 12th International Conference on Image Analysis and Processing(ICIAP’03), (2003), Mantova, Italy p.226. 20
[15] Janssens, K. Use of Micropscopic XRF for Non-destructive Analysis in Art and Archaeometry. X-Ray Spectrometry 29, 73-91, 2000. [16] Kossolapov A.J. An Improved Vidicon TV Camera of IR-Reflectography. ICOM Committee for Conservation 10th Triennial meeting, International Council of Museums, Washington, 1993, pp. 25-31. [17] Niblack, W., Barber, R., Equitz, W., Flickner M., Glassman, E., Petkovic D. and Yanker, P. The QBIC project: Querying images by content using color, texture and shape. In SPIE 1908, Storage and Retrieval for Image and Video Databases, February, 1993. [18] Pappas M., and Pitas I. Old painting digital color restoration. in Proc. Of Noblesse Workshop on non-linear model based image analysis”, p. 188-192, Glasgow, July, 1998. [19] Pappas M., and Pitas I. Digital Color Restoration of Old Painting. IEEE Transactions on image processing, Vol. 9, No. 2, 2000. [20] Rossi M., Casali F., Casadei G., Zuelli S. Image Reconstruction of Painting Radiographs. 6th International Conference on Non-Destructive Testing and Microanalysis for the Diagnostics and Conservation of the Cultural and Environmental Heritage, Ministry of Cultural Heritage and Activity Central Institute for Restoration (I.C.R.) and Italian Society for Non-Destructive Testing Monitoring Diagnostics (AIPnD), Rome, (1999), 1077-1086. [21] Smith, J.R. and Chang, S.F. VisualSEEk: A fully automated contentbased image query system. ACM Multimedia. Bonston, MA, November 1996. [22] Walmsley E., Flecher C., and Delaney J. Evaluation of System Performance of Near-Infrared Imaging Devices. Studies in Conservation 37, 1991, pp. 120-31. [23] Walmsley E.,Metzger C., Flecher C. et al. Evaluation of Platinum Silicide Cameras for Use in Infrared Reflectography. ICOM Committee for Conservation 10th Triennial meeting, International Council of Museums, Washington, 1993, pp. 57-62. [24] Xiangyang L., Dongming L., Yunhe P. Color Restoration and Image Retrieval Techniques for Dunhuang Fresco Preservation. IEEE Multimedia,April-June, 2000, pp. 38-41. 21
[25] Zerdoun Bat-Yeouda M. Les encres noires au moyen ages(jusqu’ a 1600). edition du CNRS, 1983.
22