like to send my love and appreciation to my friends in the lab, Hiral Gohil, Mosik,.
Taegoo, Joungsung, Dr. Hee-Sung Bae, Dr. Haeyoung Nam and Greg.
INORGANIC NITROGEN TRANSFORMATIONS AND MICROBIAL ASSEMBLAGE COMPOSITIONS IN SANTA FE RIVER TRIBUTARY SEDIMENTS
By HARYUN KIM
A DISSERTATION PRESENTED TO THE GRADUATE SCHOOL OF THE UNIVERSITY OF FLORIDA IN PARTIAL FULFILLMENT OF THE REQUIREMENTS FOR THE DEGREE OF DOCTOR OF PHILOSOPHY UNIVERSITY OF FLORIDA 2010 1
© 2010 Haryun Kim
2
To my husband, Jaemyeong and my parents dedicated in their support of my studies
3
ACKNOWLEDGMENTS My deepest gratitude is to my advisor Dr. Ogram and Dr. Reddy., who introduced me to microbial ecology and biogeochemistry. Their expertise and ability to find my independent thinker provided priceless guidance and instruction throughout my graduate education that were crucial to this dissertation. I would like to thank the members of my committee Dr. Clark, Dr. Inglett and Dr. Cohen who were like a mentor for me during my graduate studies and for their continued help, encouragement and scientific assistance. Their input provided insightful comments and contributions to my work. I would like to express my gratitude to Dr. Kanika S. Inglett for her scientific insights and technical assistance. Dr. Rongzhong Ye is acknowledged for their assistance in statistical analysis. My thanks to Dr. Abid al Agely and Ms. Yu Wang for their laboratory assistance and to Gavin Wilson for his assistance troubleshooting equipment malfunctions. I also like to send my love and appreciation to my friends in the lab, Hiral Gohil, Mosik, Taegoo, Joungsung, Dr. Hee-Sung Bae, Dr. Haeyoung Nam and Greg. Most importantly, none of this would have been possible without the love and support of my immediate family. My family, to whom this dissertation is dedicated to, has been a constant source of love, support and strength during my life and helped me keep my faith and remember who I am during these hectic times. I would like them to know they are always in my heart.
4
TABLE OF CONTENTS page ACKNOWLEDGMENTS .................................................................................................. 4 LIST OF TABLES ............................................................................................................ 9 LIST OF FIGURES ........................................................................................................ 10 ABSTRACT ................................................................................................................... 12 CHAPTER 1
INORGANIC NITROGEN TRANSFORMATIONS AND ASSOCIATED MICROBIAL ASSEMBLAGE COMPOSITIONS IN TRIBUTARY SEDIMENTS ...... 14 Site Description ....................................................................................................... 18 Objectives ............................................................................................................... 20 Dissertation Format ................................................................................................ 20
2
LITERATURE REVIEW .......................................................................................... 22 Nitrification .............................................................................................................. 22 Terrestrial Ecosystems ..................................................................................... 23 Ocean Ecosystems .......................................................................................... 24 Coastal Wetlands ............................................................................................. 25 Streams ............................................................................................................ 25 Wastewater Treatment Plants .......................................................................... 26 Factors Affecting Nitrification Rates ................................................................. 27 Ammonium ................................................................................................. 27 pH .............................................................................................................. 27 Oxygen ...................................................................................................... 28 Temperature .............................................................................................. 29 Organic carbon .......................................................................................... 29 Biochemistry of Nitrifiers ................................................................................... 30 Microbial Diversity of Bacterial and Archaeal Nitrifiers ..................................... 30 Measurement of Nitrification Rates .................................................................. 31 Anaerobic Ammonium Oxidation (Anammox) ......................................................... 32 Ocean Ecosystems .......................................................................................... 33 Estuarine Sediments ........................................................................................ 33 Wastewater Treatment Plants .......................................................................... 34 Freshwater Systems ......................................................................................... 34 Factors Affecting Anammox Rates ................................................................... 35 Nitrite and ammonium ................................................................................ 35 Organic carbon .......................................................................................... 35 Oxygen ...................................................................................................... 36 5
Biochemistry of Anammox Bacteria .................................................................. 36 Microbial Diversity of Anammox Bacteria ......................................................... 37 Measurement of Anammox Rates .................................................................... 37 Isotope pairing method .............................................................................. 37 Intermediate analysis ................................................................................. 38 Denitrification .......................................................................................................... 38 Forest Ecosystems ........................................................................................... 38 Agroecosystems ............................................................................................... 39 Coastal Ecosystems ......................................................................................... 39 Freshwater and Riparian Ecosystems .............................................................. 40 Factors Affecting Denitrification Rates ............................................................. 41 Nitrate ........................................................................................................ 41 Organic carbon .......................................................................................... 41 Temperature .............................................................................................. 42 Plants ......................................................................................................... 42 Biochemistry of Denitrification .......................................................................... 42 Microbial Community of Denitrifiers .................................................................. 42 Measurement of Denitrification Rates .............................................................. 43 Acetylene blocking method and measurement of nitrate consumption rates ........................................................................................................ 43 Measurement of the ratio of change relative to a conservative property .... 43 Isotope method .......................................................................................... 44 Dissimilatory Nitrate Reduction to Ammonium (DNRA) .......................................... 44 Agricultural Soils ............................................................................................... 45 Freshwater and Riparian Ecosystems .............................................................. 45 Estuarine and Coastal Ecosystems .................................................................. 46 Lakes ................................................................................................................ 46 Factors Affecting DNRA Rates ......................................................................... 46 Nitrate ........................................................................................................ 46 Organic carbon .......................................................................................... 47 Sulfate ........................................................................................................ 47 Plants ......................................................................................................... 47 Biochemistry of DNRA ...................................................................................... 48 Microbial Diversity of DNRA Bacteria ............................................................... 48 Measurement of DNRA Rates .......................................................................... 49 Summary ................................................................................................................ 49 3
INORGANIC NITROGEN TRANSFORMATIONS IN TRIBUTARY SEDIMENTS ... 50 Materials and Methods............................................................................................ 53 Site Description ................................................................................................ 53 Sampling .......................................................................................................... 54 Analyses of Biogeochemical Properties ........................................................... 54 Potential Nitrogen Transformations Rates ........................................................ 55 Statistical Analysis ............................................................................................ 58 Results .................................................................................................................... 58 Biogeochemical Properties ............................................................................... 58 6
Inorganic Nitrogen Transformations Rates ....................................................... 59 Relationships between Inorganic Nitrogen Transformation Rates and Biogeochemical Properties............................................................................ 60 Comparisons of Inorganic Nitrogen Transformation Rates between Stream and Riparian Sediments ................................................................................ 60 Discussion .............................................................................................................. 61 Inorganic Nitrogen Transformations ................................................................. 61 Relationship between Nitrogen Transformations and Biogeochemical Properties ...................................................................................................... 63 Comparison of Inorganic Nitrogen Transformation Rates between Stream and Riparian Sediments ................................................................................ 66 Summary ................................................................................................................ 67 4
RELATIONSHIP BETWEEN EXTRACELLULAR ENZYME ACTIVITY AND DENITRIFICATION RATES IN TRIBUTARY SEDIMENTS .................................... 79 Materials and Methods............................................................................................ 81 Site Description ................................................................................................ 81 Sampling .......................................................................................................... 81 Analyses of Biogeochemical Properties ........................................................... 82 Analyses of Extracellular Enzyme Activities ..................................................... 82 Statistical Analysis ............................................................................................ 84 Results .................................................................................................................... 84 Extracellular Enzyme Activities ......................................................................... 84 Correlation between Extracellular Enzyme and Potential Denitrification Rates ............................................................................................................. 85 Discussion .............................................................................................................. 86 Extracellular Enzyme Activities ......................................................................... 86 Relationships between Extracellular Enzyme and Potential Denitrification Rates ............................................................................................................. 87 Summary ................................................................................................................ 89
5
RELATIONSHIPS BETWEEN BIOGEOCHEMICAL PROPERTIES, DENITRIFICATION, AND ASSOCIATED MICROBIAL ASSEMBLAGE COMPOSITIONS IN TRIBUTARY SEDIMENTS .................................................... 95 Materials and Methods............................................................................................ 96 Site Description ................................................................................................ 96 Sampling .......................................................................................................... 97 Nucleic Acid Extraction, PCR Amplification, Cloning, and Sequencing ............ 97 Construction of Phylogenetic Tree and Diversity Analysis................................ 99 Unifrac and Mantel Test ................................................................................. 100 Results .................................................................................................................. 100 nirS Phylogenetic Tree ................................................................................... 100 Diversity Indices for nirS Assemblage Composition ....................................... 101 Relationship between Microbial Assemblages of the nirS and Biogeochemical Properties.......................................................................... 102
7
Discussion ............................................................................................................ 103 nirK Denitrifiers ............................................................................................... 103 Relationships between Microbial Diversity and Richness of nirS and Biogeochemical Properties.......................................................................... 104 Relationships between Microbial Assemblages of the nirS and Biogeochemical Properties.......................................................................... 106 Summary .............................................................................................................. 107 6
RELATIONSHIPS AMONG BIOGEOCHEMICAL PROPERTIES, NITRIFICATION, AND ASSOCIATED MICROBIAL ASSEMBLAGE COMPOSITION OF TRIBUTARY SEDIMENTS ................................................... 117 Materials and Methods.......................................................................................... 118 Site Description .............................................................................................. 118 Sampling ........................................................................................................ 118 Nucleic Acid Extraction, PCR Amplification, Cloning and Sequencing ........... 119 Construction of Phylogenetic Tree and Diversity Analysis.............................. 121 Unifrac PCA and Mantel Test ......................................................................... 121 Results .................................................................................................................. 122 AOA Phylogenetic Tree .................................................................................. 122 Diversity Indices for AOA Assemblages ......................................................... 124 Relationship between the AOA Assemblage Compositions and Biogeochemical Properties.......................................................................... 124 Discussion ............................................................................................................ 125 Bacterial amoA ............................................................................................... 125 Relationships between Microbial Diversity and Richness of AOA and Biogeochemical Properties.......................................................................... 125 Relationships between Microbial Assemblages of AOA and Biogeochemical Properties .................................................................................................... 128 Summary .............................................................................................................. 129
7
CONCLUSIONS AND SYNTHESIS ...................................................................... 140 Inorganic Nitrogen Transformations and Biogeochemical Properties ................... 141 Extracellular Enzyme Activities and Denitrification Rates ..................................... 142 Microbial Assemblage Compositions for Denitrifiers and Nitrifiers, Biogeochemical Properties, and Rates .............................................................. 142 Synthesis .............................................................................................................. 143 Future Studies ...................................................................................................... 144
APPENDIX; CACULATION OF ANAMMOX RATES ................................................... 146 LIST OF REFERENCES ............................................................................................. 148 BIOGRAPHICAL SKETCH .......................................................................................... 184
8
LIST OF TABLES Table
page
3-1
Summary of biogeochemical properties of tributary sediments. ......................... 69
3-2
Summary of TN, TC, ratio of TC:TN, and ratio of MBC:MBN of tributary sediments. .......................................................................................................... 70
3-3
Summary of inorganic nitrogen transformation rates in tributary sediments. ...... 71
3-4
Summary of the relative percentage of nitrogen retained in each inorganic nitrogen transformations in tributary sediments. ................................................. 72
3-5
Literature reviews for ammonium oxidation rates in various ecosystems. .......... 73
3-6
Literature reviews for nitrate reduction rates in various ecosystems. ................. 74
4-1
Extracellular enzyme activities based on TC in tributary sediments. .................. 90
5-1
nirS diversity and richness in tributary sediments. ............................................ 108
5-2
Resutl from the Mantel test for nirS. ................................................................. 109
6-1
Relative abundances of PCR products of Archaeal and Bacterial amoA in tributary sediments. .......................................................................................... 131
6-2
Archaeal amoA diversity and richness in tributary sediments. .......................... 132
6-3
Result from the Mantel test for AOA. ................................................................ 133
9
LIST OF FIGURES Figure
page
1-1
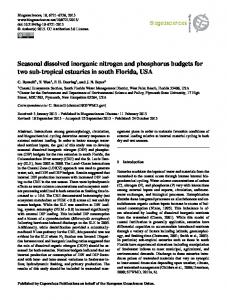
The Santa Fe River watershed. The asterisk mark on the map is the research place. .................................................................................................................. 21
3-1
Tributary T1, T2-U and T2-D in the Boston Farm Santa Fe Ranch Beef Unit Research Center of the Santa Fe River Watershed, northern Alachua County, FL. ......................................................................................................... 75
3-2
Relationships between pH and potential nitrification rates in stream sediments and riparian sediments. ..................................................................... 76
3-3
Relationships between TC:TN ratio and potential denitrification rates and Ext. Org C concentrations and potential DNRA rates in riparian sediments. ............. 77
3-4
Relationships between ammonium concentrations and potential ammonification rates in riparian sediments. ....................................................... 78
4-1
Extracellular enzyme activities in stream and riparian sediments, and litter. ...... 91
4-2
Relationships between potential denitrification rates and cellobiohydrolase enzyme activities of tributary sediments. ............................................................ 93
4-3
Canonical plot of extracellular enzyme activities and potential denitrification rates of riparian sediments and litter. .................................................................. 94
5-1
Neighbor-joining tree of nirS sequences obtained from stream sediments of tributaries. ......................................................................................................... 110
5-2
Neighbor-joining tree of nirS sequences obtained from riparian sediments of tributaries. ......................................................................................................... 110
5-3
Rarefaction curves for nirS in tributary sediments. ........................................... 111
5-4
Relationships between Ext. Org C and the Shannon index, and MBC and the Shannon and Simpson indices for nirS in riparian sediments. .......................... 113
5-5
Relationship between potential denitrification rates and Chao 1 index in tributary sediments. .......................................................................................... 115
5-6
Principal component analysis for nirS using Unifrac in tributary sediments. ..... 116
6-1
Maximum parsimony tree of Archaeal amoA sequences obtained from stream sediments. ............................................................................................ 134
6-2
Maximum parsimony tree of Archaeal amoA sequences obtained from riparian sediments.. .......................................................................................... 135 10
6-3
Rarefaction curves for archaeal amoA in tributary sediments. ......................... 136
6-4
Relationships between pH and the Simpson index for AOA in stream sediments, and Ext. Org C and the Shannon index for AOA in riparian sediments . ....................................................................................................... 138
6-5
Principal component analysis for archaeal amoA in tributary sediments. ......... 139
7-1
Potential rates of inorganic nitrogen transformations in tributary sediments. .... 145
11
Abstract of Dissertation Presented to the Graduate School of the University of Florida in Partial Fulfillment of the Requirements for the Degree of Doctor of Philosophy INORGANIC NITROGEN TRANSFORMATIONS AND MICROBIAL ASSEMBLAGE COMPOSITIONS IN SANTA FE RIVER TRIBUTARY SEDIMENTS By Haryun Kim December 2010 Chair: A. Ogram Cochair: K. R. Reddy Major: Soil and Water Science Inorganic nitrogen transformations in tributary systems have broad implications with respect to water quality, and carbon sequestration. Previous research has focused on nitrogen removal from small streams because of their higher efficiencies of nitrate removal compared to large rivers. I investigated relative importance of select inorganic nitrogen transformations, including nitrification, anammox, denitrification, and DNRA, and the microbial assemblages affecting nitrogen transformations in tributary sediments. Results demonstrated that nitrification and denitrification mainly accounted for removal of ammonium and nitrate from tributary sediments, while Anammox and DNRA were insignificant to nitrogen cycling in tributary sediments. Potential nitrification, denitrification, and DNRA rates were influenced by pH, TC: TN ratios, and labile carbon contents in tributary sediments. Furthermore, the diversity of nirS (representing denitrifiers) was related to potential denitrification rates, and this relationship was regulated by organic carbon contents, emphasizing the importance of relationships between microbial structure, functions, and biogeochemical properties. Unlike denitrifiers, the diversity of Archaeal amoA (representing nitrifiers) was not related to
12
potential nitrification rates. However, the distribution of Archaeal amoA was correlated with pH of the systems, implying the importance of the relationship between microbial structure and biogeochemical properties.
13
CHAPTER 1 INORGANIC NITROGEN TRANSFORMATIONS AND ASSOCIATED MICROBIAL ASSEMBLAGE COMPOSITIONS IN TRIBUTARY SEDIMENTS Inorganic nitrogen stored in ecosystems includes ammonium and nitrate, which are produced by biological nitrogen fixation, mineralization, and nitrification processes. Mineralization is the biological transformation of organic nitrogen to ammonium. In addition, inorganic nitrogen is added from external sources such as nitrogen fertilizer and agricultural activities. The ammonium produced by mineralization can be consumed by plants for growth (assimilation of nitrogen) or incorporated into microbial biomass (immobilization). Ammonium may also accumulate in anaerobic systems, such as may be present in riparian or wetland ecosystems. When oxygen is present, ammonium is oxidized to nitrate by aerobic Bacterial and Archaeal nitrifiers (Reddy and DeLaune, 2008). The nitrate produced by nitrifiers is reduced to nitrite, nitric oxide, nitrous oxide, and nitrogen gas by denitrification, such that nitrous oxide and nitrogen gas are released to the atmosphere. Thus, denitrification is considered to be a major process of nitrate removal in anaerobic environments. It was recently observed that ammonium can be anaerobically oxidized to nitrogen gas in some marine and estuarine sediments (Thamdrup, 2002; Engström, 2005; Trimmer, 2003). ANaerobic AMMonium oXidation (anammox) accounted for up to 40% of nitrogen loss in the Black Sea (Kuypers, 2003), and between 19% and 35% in the Golfo Dulce coastal bay in Costa Rica (Dalsgaard, 2003). However, research on anammox in anoxic ecosystems other than marine ecosystems remains limited. Therefore, research on anammox in various ecosystems including stream, riparian, and freshwater ecosystems is needed to fully understand the role in removal of ammonium from anaerobic ecosystems. 14
Unlike the removal process of nitrate by denitrification, nitrate can be reduced to ammonium by Dissimilatory Nitrate Reduction to Ammonium (DNRA) under highly reduced conditions (Michael, 2003). This process can enhance the accumulation of ammonium in systems rather than promoting removal of nitrate (King, 1985). It has been reported that DNRA rates can be as high as denitrification rates in shallow estuarine and tidal systems (Kaspar, 1983; Rysgaard, 1996; Tobias, 2001). In addition, the pasture ecosystem impacted by livestock manure can be a hot spot for DNRA since the microbe performing DNRA was found in rumen and fecal materials (Maier et al., 2000). Inorganic nitrogen transformation rates are regulated by biogeochemical properties such as pH and availability of electron acceptors and donors (Kaspar, 1983, Tobias et al., 2001; Tate, 2000). For example, lower pH caused by nitrogen fertilization, surrounding vegetation, or organic acids can reduce the availability of ammonia, which can affect the function of nitrifiers. Also, high organic matter content stimulates denitrification and DNRA rates via an increased supply of electron donors for denitrifiers and DNRA bacteria (Kaspar, 1983; Tobias et al., 2001; Yin et al., 2002). Nitrate concentrations can control denitrification and DNRA rates, and the concentrations of nitrite can control anammox rates via supply of electron acceptors. In addition, the change in TC:TN ratio due to nitrogen supplies from a live stock manure or nitrogen fertilization could shift decomposition rates, affecting the level of available organic carbon to denitrification and DNRA. Previous research demonstrated that stream and riparian sediments are hotspots for inorganic nitrogen transformations in tributary ecosystems because these places
15
receive nitrogen and organic matter from uplands and stream water (Martin et al., 1999; Steinhart et al., 1998; Chatarpaul et al., 1980; Hill, 1983; Swank and Caskey, 1982; Holmes et al., 1996; Mulholland and Hill, 1997; Bowden et al., 1992; Pinay et al., 1993, 1995; Freeze and Cherry, 1979; Hill, 1996; Hill and Waddington, 1993; Likens et al., 1977). In addition, fluctuating water tables in riparian sediments creates anaerobic conditions, favoring denitrification (Cooper, 1990; Bowden et al., 1992; Lawrence, 1992; Schipper et al., 1993; Hanson et al., 1994; Pinay et al., 1995; Bowden et al., 1992; Pinay et al., 1993 and 1995). Thus, stream and riparian sediments can function as effective sinks for nitrogen in tributary ecosystems (Jones and Holmes, 1996). However, previous research has mainly focused on denitrification and nitrification rates in tributary sediments (Peterson et al., 2001; Lowrance et al., 1997; Hill, 1996; Likens et al., 1977). There is limited research on the potential roles of DNRA and anammox in removal of nitrate and ammonium from tributary sediments. Also, the biogeochemical factors affecting anammox and DNRA rates have not been well studied in tributary sediments. Organic carbon availability is one of the most important factors regulating denitrification rates in tributary sediments. Carbon availability can vary depending on the vegetation types and quality of organic matter present in the systems (Martin et al., 1999). For example, the organic matter inputs to tributary systems surrounded by woody vegetation may consist of litter with higher lignin and lower cellulose contents than systems dominated by herbaceous vegetation. The low quality of litter and organic matter exhibits a slower rate of decomposition and is therefore a poor source of carbon for heterotrophic microbes (Chapin et al., 2002). Previous research demonstrated that grassy sites exhibited greater denitrification rates than woody sites (Schnabel et al.
16
1997; Groffman et al. 1991). Also, denitrification rates significantly correlated with respiration rates in planted sites, indicating that the decomposition of organic matter is a main factor regulating denitrification rates via a supply of available carbon to denitrifiers (Walton and Jiannino, 2005). However, most studies on denitrification have focused on the impact of vegetation and soil organic matter contents on denitrification rates (Knoepp, 1998; Gurlevik et al., 2004; Ebrecht and Schmidt, 2003; Garten and Van Miegroet, 1994), rather than on the quality of organic carbon. Therefore, research on the effects of organic matter decomposition rates associated with carbon quality is needed to better understand regulator for denitrification rates. Nitrification and denitrification are main processes regulating nitrogen concentrations in tributary system, even though anammox and DNRA can be observed. Also, relative rates of denitrification were reported to be higher than those of anammox and DNRA in various ecosystems (Rich et al., 2008; Koop-Jakobsen and Gibli, 2009; Omnes et al., 1996; Revsbech et al., 2005). Therefore, many studies have focused on nitrification and denitrification processes related to nitrogen cyclings in tributary ecosystems. However, most studies have focused on how human activities, land use practices, and vegetation types influence nitrification and denitrification rates, rather than the microbial structures responsible for these processes. Also, little work has been done to determine how the microbial community structure might be related to nitrification and denitrification rates and how shifts in community structure may be linked to biogeochemical properties. For example, low pH can affect the microbial assemblage compositions of nitrifiers, through change in the diversity of nitrifier assemblage compositions. In case of denitrification, carbon and nitrogen concentrations affect
17
diversity of denitrifiers, influencing their rates. Therefore, research on relationships between biogeochemical factors, microbial assemblage compositions of nitrifiers and denitrifiers, and potential rates of these processes in tributary sediments is needed. Site Description The Santa Fe River Watershed (SFRW) (3574 km2) spreads across eight counties in North East Florida (Figure 1-1) and comprises the southeastern part of the Suwannee River Basin that drains into the Gulf of Mexico. Research has shown an increase in nitrate nitrogen concentration in the Suwannee River Basin covering southern Georgia and north-central Florida (Ham and Hatzell, 1996). Also, the increased nitrate nitrogen has been observed in spring, surface, and ground waters in the Suwannee River Basin area (Hornsby et al., 2001). Despite that the Santa Fe River Watershed comprises only 13% of the Suwannee River Basin area, the Santa Fe River Watershed is responsible for 22% of the total nitrogen input to the Suwannee River Basin (Suwannee River Water Management District, 2003). Therefore, research on nitrogen cycling in the Santa Fe River Watershed needs to be investigated in order to establish the management for nitrogen controls. For land use, the pine plantation (23%) and agricultural land use (including crop and improved pasture 37%) occupied over the 60% of lands use, following the wetlands (18%), upland forest (11%), and urban (6%) (Sabesan, 2004). Comparing with the land use pattern in 1990, the forested area has shown to decrease, while the agricultural area increased (Sabesan, 2004). Therefore, nitrogen fertilizer from agricultural and timber production, and livestock manure from ranch activity are concerns in the Santa Fe River Watersheds. The soil type is classified as to Ultisols (37%), Spodosols (26%)
18
and Entisols (15%), and the soil texture is predominately composed of sandy, loamy, and organic soils (Lamsal et al., 2006). The site for this research is tributary sediments at the Boston Farm Santa Fe Ranch Beef Unit Research Center (SFBRU) in the Santa Fe River Watershed, northern Alachua County. Land uses on this site include a low intensity cattle operation with approximately 300 heifers on 1,600 acres and a nursery operation using nitrogen fertilizer (Holly Factory Nursery) (Frisbee, 2007). One of two tributaries in my research sites, Tributary 1 (T1) is located along CR 241roadway, flows into pond and finally into the Santa Fe River. T1 is surrounded by a improved pasture and affected by ranch activity. The sediment adjacent to the stream water (riparian sediments) contains relatively high organic matter washed from the upland soils containing livestock manure. Also, riparian sediments receive their water from groundwater and seepage water via a subsurface flow rather than stream water. However, the sediment in the stream water (stream sediments) receives water from stream, and contains sandy soil and relatively low carbon contents. The vegetation type is mixture of herbaceous and woody plants including Carya sp., Pinus sp., Quercus sp., Magnolia grandiflora, Saururus cernuus, Juncus sp., Cephalanthus occidentalis, Hydrocotle umbellata, and Polygonum sp. The Up-stream region of Tributary 2 (T2-U) is affected by nitrogen fertilization from a nursery operation and surrounded with hardwood plants, including Carya sp., Quercus sp., and Magnolia grandiflora, and soft wood including Pinus sp. The Downstream region of Tributary 2 (T2-D) is influenced by a improved pasture and nitrogen fertilization from head water, and covered with grass including Saururus cernuus, Juncus sp. and
19
Polygonum sp., deciduous shrub plants including Cephalanthus occidentalis, and aquatic plants including Hydrocotle umbellata (Frisbee, 2007). Objectives The overall objective of this research was to investigate the potential inorganic nitrogen transformation rates, biogeochemical factors regulating these rates, and associated microbial assemblage compositions in tributary sediments of the Santa Fe River. Specific objectives of this research were to:
Investigate the relationship between potential inorganic nitrogen transformation rates and biogeochemical properties in tributary sediments.
Investigate the relationship between extracellular enzyme activities associated with organic matter decomposition and potential denitrification rates in tributary sediments.
Investigate the relationships between the biogeochemical factors affecting denitrification and nitrification and their microbial assemblage compositions in tributary sediments. Dissertation Format This dissertation is composed of four main parts. The first part is the literature
review (Chapter 2). The second part presents research on the biogeochemical properties and potential inorganic nitrogen transformation rates (Chapter 3), and research on the relationship between extracellular enzyme activities in tributary sediments and litter, and potential denitrification rates (Chapter 4). The third part of this dissertation describes research on relationships between biogeochemical properties and the microbial assemblage compositions associated with denitrification (Chapter 5) and nitrification (Chapter 6).
20
Figure 1-1. The Santa Fe River Watershed. The asterisk mark on the map is the research place.
21
CHAPTER 2 LITERATURE REVIEW Increased nitrogen created by fertilization and improper disposal from ranch activity has been considerable concerns in agriculture ecosystems. The excessive input of nitrogen promotes eutrophication in aquatic ecosystems, which can cause a decrease in oxygen and sunlight available to other organisms. Also, nitrate is toxic to human health when consumed in drinking water. However, riparian ecosystems can reduce nitrate through denitrification, plant uptake, and microbial immobilization. In particular, since denitrification is the permanent removal mechanism of nitrate, this process is considered to be a desirable way of nitrate removal in watershed ecosystems. However, anaerobic ammonium oxidation (anammox) can also remove ammonium and nitrite from riparian ecosystems, and nitrification can increase denitrification rates via a supply of nitrate to denitrifiers. In addition, dissimilatory nitrate reduction to ammonium (DNRA) can accumulate ammonium in riparian ecosystems. Thus, to describe functions of riparian ecosystems for nitrogen removal, the comprehensive understanding of nitrification, anammox, denitrification, and DNRA is needed. This chapter reviewed previous research on importance of nitrification, anammox, denitrification, and DNRA in various ecosystems, biogeochemical factors affecting these rates, physiology of microbes associated with these processes, and analysis methods measuring each rate. Thus, this literature review will help to understand inorganic nitrogen transformations in riparian ecosystems. Nitrification Nitrification is the biological oxidation of ammonium to nitrate using oxygen as an electron acceptor. Nitrification is an important step in the nitrogen cycle in soils because
22
nitrate produced by nitrification can be used as electron acceptors for denitrification. There are two types of nitrifiers: (1) autotrophic nitrifiers using ammonium as an energy source to fix carbon dioxide used in growth and maintenance and (2) heterotrophic nitrifiers using organic nitrogen as an energy source instead of ammonium (Chapin et al., 2002). This review mainly focuses on autotrophic nitrifiers because heterotrophic nitrifiers are not well studied in various ecosystems (Tate, 2000). Terrestrial Ecosystems Rapid rates of ammonification and nitrification are observed in tropical forest ecosystems because of relatively high concentrations of foliar and litter fall nitrogen (Vitousek and Matson, 1988). Temperate forest ecosystems can be expected to exhibit lower nitrification rates due to lower amounts of ammonium via a plant uptake relative to fertilized grasslands and freshwater ecosystems. It has been also suggested that increased nitrogen deposition due to fossil fuel burning and fertilizer utilization enhanced mineralization rate via a decrease in the TC:TN ratio of litter and forest soils, possibly increasing nitrification rates (Aber et al., 1998). The increased nitrification rate could lead to an increase of nitrate leaching from northern temperate forest ecosystems to adjacent watersheds (Aber et al., 1988). However, results from NITREX (Nitrogen Saturation experiment) demonstrated that the nitrogen retention efficiency was relatively high in NITREX sites, even after observing a linear relationship between forest floor nitrogen concentration and nitrification rate (Aber et al., 1995). Disturbances in forest ecosystems, such as logging (Matson and Vitousek, 1984; Vitousek and Andariese, 1986), fires (Polygala et al., 1986; White, 1986; Weston and Attiwill, 1990), and addition of fertilizer (Adams and Attiwill, 1983) can affect mineralization rates, which in turn influence nitrification rates in forest soils. Additionally, 23
some research has observed heterotrophic nitrification and fungi using organic nitrogen as an electron donor instead of ammonium in acidic forest soils (Nishio et al., 1998; Robertson, 1982). These microbes were less sensitive to pH, implying that heterotrophic nitrifiers can play an important role in nitrification of acidic forest soils. However, their contribution to nitrification in forest ecosystems has not been well documented, because of the difficulty in distinguishing rates between autotrophic and heterotrophic nitrifiers. Ocean Ecosystems The majority of ammonium released by mineralization is consumed by phytoplankton (Harrison et al., 1992 and 1996), or is oxidized to nitrate at surface water (Yool et al., 2007). Also, the high flux of organic nitrogen supplied from sediments and upwelling deep ocean water is oxidized to ammonium in subsurface oxygen minimum zones (OMZ). The ammonium is oxidized to nitrate in OMZ (Ward, 2002), leading to denitrification (Codispoti et al., 1985; Ward and Zafiriou, 1988; Lipschultz, 1990; Naqvi and Noronha, 1991) and anammox (Lam et al., 2006; Kuypers et al., 2005 and 2006; Hamersley et al., 2007; Thamdrup et al., 2006). Thus, nitrification is indirectly responsible for the loss of nitrogen in ocean ecosystems. The recent discovery of archaeal nitrifiers has made it possible to explain a broader distribution of nitrifiers in ocean ecosystems, where nitrifiers have not been detected using molecular analysis. Archaeal nitrifiers were found to be much more abundant than bacterial nitrifiers in marine systems (Wüchter et al., 2006), implying that the versatile physiology and metabolism of archaeal nitrifiers could play a pivotal role in ocean nitrification.
24
Coastal Wetlands Coastal wetlands are one of the most productive ecosystems due to tidal flooding frequency and import of nutrients from terrestrial and ocean ecosystems. Due to the limitation of oxygen by tidal flooding, most of the inorganic nitrogen is ammonium. Heterotrophic microbes, phytoplankton, and marsh vegetation consume this ammonium for their growths (Henriksen and Kemp, 1988). As a result, the nitrification process can be limited by ammonium and oxygen concentrations in coastal wetland ecosystems (Gűrel et al., 2005). Salinity can also influence nitrification in costal wetland ecosystems. Although a marine Nitrosomonas sp. was reported to survive in estuarine sediments at 15% salinity (Henriksen and Kemp, 1988), nitrifying bacteria exhibited lower rates at higher salinities (Rysgaard et al., 1999). Nitrification processes can occur in the surficial oxidized zone of sediments ranging from depths of 1 to 1.6 mm (Seitzinger, 1988; Kemp et al., 1990), as well as in plant root zones due to the release of oxygen via their roots, thereby stimulating coupled nitrification and denitrification processes (Rysgaard et al., 1996). Physical perturbation and bioturbation by macrofauna could create zones where oxygen can penetrate, supplying oxygen to nitrifiers (Rysgaard et al., 1996; Kemp et al., 1990). Streams Human activities can supply excess nitrogen to ecosystems, changing the balance between supply and demand for available nitrogen to plants, and leading to nitrogen saturation in terrestrial and aquatic ecosystems (Aber et al., 1998; Vitousek et al., 1994). Increased nitrogen deposition and agricultural activities can also increase nitrogen input to streams (David and Gentry, 2000), ultimately adding to the nutrient loads of large rivers (Seitzinger et al., 2002) and estuarine systems (Rabalais et al., 2002), and 25
causing water quality problems and eutrophication (Justic et al., 1993; Nixon, 1995). In addition, recent studies have shown that small streams can be important sites for nitrogen transformations and retention of nutrients. Despite their relatively small proportion of watershed surface area, small streams account for 85% of total stream length within a watershed and receive draining water and dissolved nutrients from adjacent terrestrial ecosystems (Fisher et al., 1998; Alexander et al., 2000). Therefore, nitrogen cycling in small streams is an important factor regulating nitrogen input to other systems. Nitrification in small streams has been a common subject of research because nitrate is a mobile chemical species (Starry and Valett, 2005). Previous research has suggested that nitrification rates account for 50% of the variability observed in stream nitrate concentrations, underscoring the importance of nitrification in river ecosystems (Peterson et al., 2001; Bohlen et al., 2001). Also, Peterson et al. (2001) have reported that 12 headwater streams, as part of the Lotic Intersite Nitrogen eXperiment (LINX), exhibited a high nitrification rate despite low ammonium concentration, indicating that small streams are potentially important sources of nitrate to other ecosystems. Nitrification in stream ecosystems can be limited by a variety of factors, including: (1) physical and chemical properties (e.g., dissolved oxygen concentration and pH) (Strauss et al., 2002); (2) agricultural activities adjacent to watersheds (Omernik, 1977); and (3) in-stream nitrogen adsorption or transformations (Triska et al., 1990; Jones and Holmes, 1996; Fisher et al., 1998). Wastewater Treatment Plants Each person contributes 8 to 12 pounds of nitrogen per year to wastewater treatment systems. Sixty percentage of the nitrogen in waste material is bound in the complex organic matter, and the remaining nitrogen form is ammonium (Tchobanolgous 26
and Burton, 1991). To remove inorganic nitrogen in wastewater plants, ammonium must be oxidized to nitrate before being reduced to nitrogen gas by denitrifiers. Nitrifiers tend to have long lives, reproduce much more slowly, and be limited by oxygen levels (Hammer and Mackichan, 1981). Wastewater plants are thus designed to have a longer average residence time to extend the contact time to biofilters and the aeration basin containing nitrifiers and dissolved oxygen (Weber, 1972). Because nitrifiers are sensitive to temperature, pH, and oxygen, calcium carbonate is applied to maintain the optimal pH (pH 7 to 7.5), oxygen is produced by rotating the biofilter, and warmer temperatures are maintained (Hammer and Mackichan, 1981). Factors Affecting Nitrification Rates Ammonium The availability of ammonium could regulate nitrification (Triska et al., 1990), and thus the ammonification process, the biological conversion of organic nitrogen to ammonium, can influence nitrification rates (Jones et al., 1995). Previous research has found a positive relationship between ammonium concentrations and nitrification rates in streams (Kemp and Dodds, 2002; Mulholland et al., 2000; Triska et al., 1990), lakes (Hall, 1986), ground water (Strauss and Dodds, 1997) and soils (Davidson and Hackler, 1994) . However, plant roots and microbes also consume ammonium, and thus nitrifiers compete for ammonium in tundra ecosystems due to the lack of ammonium (Chapin et al., 2002). pH In a laboratory culture experiment, the optimal pH for nitrification rate ranges from pH 6.6 to 8.0, with negligible nitrification below pH 4.5 (Tate, 2000). The inhibitory effect of acidic pH to nitrification is due to the decreasing the ratio of ammonia to ammonium 27
at low pH; however, the exact mechanism of pH inhibition to nitrification is not yet completely understood (Bothe et al, 2007). Even though pH inhibition to nitrifiers in cultures has been observed, many acidic ecosystems have shown relatively high nitrification rates (Stark and Hart, 1997). Explanations for the increased nitrification rates include: (a) microsite variations in soil pH; (2) the presence of acidophilic autotrophic nitrifiers in acidic soils; (3) the presence of heterotrophic nitrifiers and fungi capable of the oxidation of organic nitrogen in acidic soils (Doxtander and Alexander, 1966; Eylar and Schmidt, 1959); and (4) adaption of nitrifiers to acidic conditions (Hankinson and Schmidt, 1988). Oxygen Nitrification rate is limited by oxygen, because nitrifiers use oxygen as an electron acceptor for oxidation of ammonium to nitrate. The minimum concentration of oxygen for nitrifier survival ranges from 1 to 6 μM (Henriksen and Kemp, 1988). Decreased nitrification in coastal ecosystems has been observed due to overgrowth of phytoplankton, which depletes oxygen availability for nitrifiers (Jenkins and Kemp, 1984; Hansen et al., 1981). Some researchers have reported the presence of the nitrification process under lower oxygen concentrations. For example, Nitrosomonas europaea survived at oxicanoxic interface conditions (Voytek and Ward, 1995); the growth rate of Nitrosomonas marina was the highest with 5% oxygen content (Goreau et al., 1980); and nitrification occurred with oxygen concentrations as low as 0.3 μg·ml-1 (Tate, 2000). In addition, nitrification can take place near the plant rhizosphere (Sand-Jensen et al., 1982; WiumAndersen and Andersen, 1972), in oxygenated water of flooded soils, at the anoxic-oxic interface, or within soil microsites in sediments. 28
Temperature The temperature for ammonium oxidation to nitrite in pure culture ranges from approximately 0 ºC to 65ºC, and nitrite oxidation to nitrate occurs at approximately 0 ºC to 40ºC (Tate, 2000). The optimal temperature for nitrification in laboratory settings ranges from 25 ºC to 30 ºC (Kadlec and Reddy, 2001). However, nitrification occurs from tropical to tundra soils at temperatures exceeding optimal ranges for ammonium oxidation. Temperature can affect other variables, including mineralization rates and oxygen concentrations, which in turn influence nitrification rate (Richardson 1985; Sheibley et al. 2003). Organic carbon Previous research has shown mineralization to have a positive relationship with nitrification because ammonium produced by mineralization can be used as an energy source for nitrifiers (Starry and Valett, 2005; Duff and Triska, 2000; Bianchi et al., 1999). Organic matter content could enhance nitrification rates via an increased mineralization rate. However, organic carbon content could limit nitrification rates because organic carbon could enhance heterotrophic microbes requiring ammonium for their growth (immobilization) in stream water (Bernhardt and Likens, 2002; Strauss et al., 2002), agricultural soils (Venterea and Rolston, 2000), forest soils (Montagnini et al, 1989; Ollinger et al., 2002), and wastewater treatment plants (Richardson, 1985). In addition, the response of nitrification to organic carbon could depend on the TC:TN ratio of organic matter, because the TC:TN ratio could determine the mineralization and immobilization rates. Thus, organic matter with a low TC:TN ratio could stimulate ammonification, increasing nitrification rate via the supply of ammonium. Organic matter with a high TC:TN ratio could enhance immobilization rates, resulting in competition 29
between heterotrophic microbes and nitrifiers for ammonium (Strauss and Lamberti, 2000; Verhagen and Laanbroek, 1991). Biochemistry of Nitrifiers Nitrification has two steps: (2-1) the oxidation of ammonium to nitrite mediated by an ammonium oxidizer; and (2-2) the oxidation of nitrite to nitrate mediated by a nitrite oxidizer (Schmidt, 1982). 2NH4+ + 3O2 → 2NO2- + 4H+ + 2H2O; Gº= -272kJ mol-1
(2-1)
The second reaction of nitrite to nitrate is; 2NO2- + O2 → 2NO3-; Gº= -75kJ mol-1
(2-2)
Recently, ammonia oxidizing archaea (AOA) were discovered in soils, oceans and estuarine sediments, with population sizes reported to be larger than those of ammonia oxidizing bacteria (AOB). Studies of the Nitrosopumilus maritimus, one of the archaeal amoA nitrifiers, genome revealed that archaeal amoA had electron transport different from other ammonia oxidizing bacteria. N. maritimus has also been shown to have a limited capacity for organic carbon assimilation, meaning that they can grow not only autotrophically but also mixtrophically, and thus they can influence nitrogen and carbon cycles in ocean ecosystems (Walker et al., 2010). Microbial Diversity of Bacterial and Archaeal Nitrifiers One environmental factor affecting the composition of nitrifiers in terrestrial ecosystems is pH, because ammonium which is unsuitable as a substrate for ammonia monooxygenase, is formed under acidic conditions (Kowalchuk and Stephen, 2001). However, previous research has shown that Nitrosopira sp. can tolerate acidic conditions (de Boer et al., 1995). Culture dependent techniques (MacDonald, 1986) and molecular surveys, such as 16S rRNA gene sequencing or Polymerase Chain Reaction30
Denaturing Gradient Gel Electrophoresis (PCR-DGGE), have demonstrated a dominance of Nitrosopira in acidic forest soils (Laverman et al., 2000) and acidic stream (Kowalchuk et al., 2000; Stienstra et al., 1994). However, the mechanisms for nitrification in acidic soils are not fully understood. Recent research has shown that Crenarchaeota was widely distributed and contributed significantly to nitrification rate in hot thermal springs (Hatzenpichler et al., 2008), marine ocean ecosystems (Francis et al., 2007), estuarine systems (Santoro et al., 2008), soils (Leininger et al., 2006), and wastewater treatment plants (Park et al., 2006). Based on the sequences retrieved from previous studies, archaeal nitrifiers are divided into clusters representing soil and marine groups (Francis et al., 2005; Park et al., 2006). Soil groups are likely to be less sensitive to organic matter, while the marine group has been shown to be uninhibited by acidic pH (He et al., 2007). However, there is not yet enough information on which factors can influence the division between the marine and soil groups. Archaeal nitrifiers seem to be better adapted to environmental stress compared to bacterial nitrifiers, because they have low permeability membranes and several metabolic pathways capable of using dissolved organic carbon as a carbon source (Valentine, 2007). Measurement of Nitrification Rates The easiest way to measure the nitrification rate is to analyze concentrations of ammonium, nitrite, and nitrate in laboratory and environmental samples (Ferguson et al., 2007). Another method includes specific nitrification inhibitors (nitrapyrin and allylthiourea), which have been used to measure nitrification rates in coastal sediments (Macfarlane and Herbert, 1984; Hansen et al., 1981). However, it remains unclear if
31
these components inhibit archaeal ammonia monooxygenase, and if they also inhibit mineralization, which would result in underestimation of nitrification rates. Nitrification rates are calculated by the difference in ammonium concentrations or nitrate accumulation rates in the presence and absence of the inhibitor. The 15N-nitrate isotope dilution technique is also widely used to measure nitrification rates. Following addition of 15N-ammonium and incubation, the concentration of 15N -nitrate oxidized from 15N-ammonium is analyzed (Koike and Hattori, 1978). However, added 15Nammonium could possibly stimulate nitrification rates, thereby resulting in overestimation of nitrification rates relative to in situ rates. As the molecular approach, quantitative Polymerase Chain Reaction (qPCR) has been used to estimate quantification (as absolute number of copies) of both bacterial and archaeal amoA genes in marine waters, soils, and waste treatment systems (Harms et al., 2003; Geets et al., 2007; Kim et al., 2001 and 2004; Wüchter et al., 2006). Anaerobic Ammonium Oxidation (Anammox) In 2002, anaerobic ammonium oxidation (anammox) process was observed under anoxic conditions in marine and estuarine sediments in nature, playing an important role in nitrite and ammonium removals (Thamdrup and Dalsgaard, 2002; Engström et al., 2005; Trimmer et al., 2003). Most anammox research tended to focus on ocean and estuarine ecosystems, because the removal and accumulation of ammonium and nitrite were related to anoxic conditions in the deep water column. However, recently the identification of anammox has been extended to freshwater and arctic ecosystems (Schubert, 2006; Jetten et al., 2003; Rysgaard, 2004)
32
Ocean Ecosystems Kuypers et al., (2003) discovered that anammox in the Black Sea removed inorganic nitrogen accounting for up to 40% of total nitrogen gas production in anoxic regions. Specially, at a 200m depth in the anoxic waters of Golfo Dulce, 19% to 35% of total nitrogen gas production was performed by the anammox process (Dalsgaard et al., 2003), and at Benguela OMZs, anammox produced 4.2 μg N·day-1 (Kuypers et al., 2005). The water chemistry of these oceanic ecosystems is very similar to that of oxygen depleted zones in the oceans, where 30% to 50% of the global nitrogen removal is expected to occur (Dalsgaard et al., 2003). Interestingly, anammox was detected in the Arctic Ocean, although the contribution was low relative to overall nitrogen gas production (less than 5%) (Rysgaard et al., 2004). Therefore, anammox may be a globally important removal process for oceanic nitrogen cycling. Estuarine Sediments The contribution of anammox to nitrogen production varies among ecosystems. In the estuarine ecosystems of the continental shelf sediments in the Skagerrak of the Baltic North Sea, anammox produces total 30 to 99 μM of N2 per day, accounting for 24% to 67% of total nitrogen gas production (Thamdrup et al., 2002). In the Aarhus Bay, the anammox production of nitrogen gas reaches 83 μM of N2 per day. However, the contribution of anammox to total nitrogen gas production was insignificant relative to denitrification in a eutrophic coastal bay, because high concentrations of organic matter enhanced activities of denitrifiers (Thamdrup et al., 2002). In sediments with high organic matter, anammox bacteria created 0.54 μg N·g soil-1·day-1 at Thames Estuary, UK and 2.8 μg N·g soil-1·day-1 at Chesapeake Bay, but the relative contribution of
33
anammox to total nitrogen gas production was very small (8%) (Engström et al., 2005; Rich et al., 2008). Wastewater Treatment Plants Most anammox research in freshwater ecosystems is performed in man-made systems, such as wastewater treatment plants (Sliekers et al., 2002; Strous et al., 1998; Fux et al., 2002; Third et al., 2005). Since bioreactors using anammox bacteria consume ammonium as an energy source and carbon dioxide as a carbon source (Egli et al., 2003), these systems can reduce the operational costs up to 90%, while still being environmentally friendly (Sliekers et al., 2003). Also, it has been reported that anammox bacteria were not affected by the chemical composition of waste water, surviving various types of waste water sludge (Pilcher et al., 2005). However, enrichment of anammox bacteria takes a relatively long time (11 to 30 days) (Strous et al., 1998; Van de Graff et al., 1996). Freshwater Systems In freshwater ecosystems, anammox has been identified in Lake Tanganyika, the second largest lake in the world. The lake produces 3.4 μg N per day (13%) (Schubert et al., 2006). Using 16S rRNA gene analysis, Penton (2006) found evidence for the widespread distribution of anammox, including at the Kellogg biological station (freshwater sediment), Wintergreen Lake (a small eutrophic lake), Sherriff’s Marsh (rich organic wetland), and the Everglades WCA 2A (Water Conservation Area 2A subtropical wetlands). However, studies on the anammox process in freshwater, wetland ecosystems, or floodplains similar to anoxic oceanic conditions have not been well investigated.
34
Factors Affecting Anammox Rates Nitrite and ammonium Because anammox has been detected in natural ecosystems and proven to be important to nitrogen cycling, many researchers have begun to investigate factors controlling the anammox process. Dalsgaard (2002) observed that in anoxic incubation, anammox accounted for 65% of nitrogen gas formation. In addition, nitrite production from nitrate was faster than nitrite consumption, and therefore did not strain the rate of anammox. Engström (2005) suggested that competition between anammox and denitrification for nitrite is a significant determinant of absolute and relative anammox rates in coastal marine sediments. Trimmer (2005) also reported that anammox can be regulated by availability of nitrite, as well as the relative sizes or activities of anammox populations. The ammonium supplied by mineralization may be consumed by anammox bacteria as an electron donor (Kartal et al., 2007). However, there is little research on the effect of ammonium concentration on anammox rate. Therefore, research on the general regulators and controlling factors for anammox in broader ecosystems is needed. Organic carbon Anammox bacteria are known to be autotrophic and use carbon dioxide as a carbon source. Thus, it was expected that the supply of organic carbon could not control anammox rates. (Strous et al., 1998). However, bioavailability of organic carbon enhances denitrification rates. Therefore, it can be assumed that higher amounts of organic carbon will stimulate denitrification. The enhanced denitrification rate may hinder the anammox process through competition for nitrite. However, previous studies have shown controversial results about the relationship between anammox rate and 35
organic carbon concentrations. In sediment from the Baltic North Sea transition, a negative correlation was observed between the relative importance of anammox and organic matter (Thamdrup and Dalsgaard, 2002), while in the Thames estuary, the anammox process was positively correlated with sediment organic content (Trimmer et al., 2003). Therefore, more research on relationship between anammox rate and organic carbon content is needed in various ecosystems. Oxygen The anammox process in a waste treatment plant was found to be inhibited by 1.1 μM oxygen, and occurred under anaerobic conditions (Strous et al., 1998). Although the anammox process exposed to oxygen, the removal of oxygen can revive the process (Jetten et al., 1998; Third et al., 2005). However, there are no reports on the effects of oxygen on anammox in natural systems. Presumably, anammox is also inhibited by oxygen in natural systems, because most naturally occurring anammox rate has been detected in anoxic conditions. Biochemistry of Anammox Bacteria Based on 15N-nitrogen experiments, the following anammox mechanism has been postulated: Anammox bacteria are chemolithoautotrophs and consume ammonium and nitrite in a ratio of 1 to 1. They reduce nitrite (NO2-) to hydroxylamine (NH2OH) by a nitrite-reducing enzyme (NiR). Next, hydroxylamine (NH2OH) and ammonium (NH4+) are condensed to hydrazine (N2H4) and water by a hydrazine hydrolase (HH). Finally, a hydroxylamine oxidoreductase (HAO) oxidizes hydrazine (N2H4) to dinitrogen (N2) (Jetten et al., 1998; 2003). Overall process of anammox is following equation. NO2- + NH4+ → N2 + 2H2O ∆G0°= -358 kJ·mol-1
36
(2-3)
Microbial Diversity of Anammox Bacteria The first anammox bacteria, Brocadia anammoxidans, were detected using 16S rRNA gene sequence analysis and FISH with specific oligonucleotide probes in biofilm. Brocadia anammoxidans was found to be phylogenetically related to Planctomycetales (Strous et al., 1999; 2000). Using anammox specific 16S rRNA gene primers (mainly using Pla 46F primer) and anammox specific oligonucleotide probes, researches have reported the presence of at least three other anammox bacteria. These genera are Brocade (Kartal et al., 2004), Kuenenia (Schmidt et al., 2000), and Scalindua (Kuypers et al., 2003 and Schmidt et al., 2003). Recently, the Candidatus Anammoxoglobus propionicus species was found in a bioreactor (Kartal et al., 2007). Penton et al., (2007) suggested a new primer that was 100% specific in the recovery of 700bp 16S rRNA gene sequence with 96% homology to the Scalindua group of anammox bacteria. This new primer detected anammox bacteria in 11 geographically and biogeochemically diverse freshwater and marine sediments (Penton et al., 2007). Measurement of Anammox Rates Isotope pairing method The isotope pairing method involves additions of 15N-ammonium and 14N-nitrite to samples. After incubation, the ratio of 14N15N to14N14N is analyzed using a gas chromatography-isotope ratio mass spectrometry and can be expressed as δ14N15N values following equation (Kuypers et al., 2003). δ14N15N= [(14N15N:14N14N)sample]: [(14N15N:14N14N)standard] -1 (Air can be used as the standard)
37
Intermediate analysis As mentioned above, hydrazine and hydroxylamine are intermediate products in the anammox process. Therefore, the intermediate production rate is related to the overall rate of anammox. Ammonium, hydrazine, and hydroxylamine are measured colorimetrically at time intervals after anoxic incubation of anammox bacteria with media (Jetten et al., 2005). Denitrification Denitrifiers are heterotrophs and use nitrate and nitrite as electron acceptors and organic matter as an energy source. Most denitrifiers are facultative anaerobes and prefer to use oxygen when oxygen is available in the system (Chapin et al., 2002). The sequence of nitrate reduction is nitrate → nitrite → nitric oxide → nitrous oxide → nitrogen gas. The regulators for denitrification are organic matter availability, nitrate concentrations, anaerobic conditions, pH, and temperature in nature ecosystems (Tate, 1999). Forest Ecosystems Forest ecosystems are usually limited by nitrogen, so that this system can have a substantial capacity to store excess nitrogen. The NITREX (Nitrogen saturation experiment) research in Europe reported that most nitrate amended to a forest ecosystem was retained in soils (Dise, 1995). Also, the rate of denitrification tends to be relatively low due to well-drained soil conditions (Nadelfohher, 2001). However, chronic nitrogen additions can saturate forest ecosystems with nitrogen, which can enhance the loss of retained nitrogen to the atmosphere by denitrification. At Hogwald Forest, Germany, significant amounts of nitrogen gas originated from nitrogen deposited on spruce and beech experimental plots (Butterbach et al., 2002). In forests having high 38
nitrate contents, the gaseous losses of nitrate were stimulated (Aber et al., 1995). Also, it was observed that tropical forests exhibited a higher rate of denitrification due to high moisture and nitrate contents. Therefore, increasing nitrogen deposition from the atmosphere and nitrogen fertilizer will stimulate denitrification rates in forest ecosystems, despite the overall nitrogen limitation. Agroecosystems Agroecosystems receive over 75% of their nitrogen from human activities. However, because this system has a low retention capacity for nitrogen, most nitrogen flows to other systems through denitrification or leaching (Galloway et al., 2004). Denitrification is a major process in nitrogen removal from agroecosystems; however, removal rates of nitrate by denitrification can vary substantially (Mosier et al., 2002). For example, the fraction of nitrogen removal via denitrification varied from 3% to 56% in flooded soils (Galbally et al., 1987; Freney et al., 1990). In an irrigated wheat field, 50% of the added nitrogen fertilizer was denitrified (Freney et al., 1992). Other research reported that only 1% to 4% of added nitrogen fertilizer was removed by denitrification (Mosier et al., 1986). Coastal Ecosystems Nitrogen input to coastal ecosystems has increased due to human activities. This increased nitrogen can influence the estuaries and coastal ecosystems, stimulating the growth of phytoplankton. Increased phytoplankton growth can suppress the growth of plants and benthic organisms due to reduced light availability and depleted oxygen. Thus, denitrification is an important mechanism for nutrient removal in coastal ecosystems (Canfield et al., 2005). Denitrification rates in coastal ecosystems are
39
regulated by organic matter loading, macrofauna, aquatic grasses, anoxic conditions, and nitrate (Cornwell et al., 1999). Freshwater and Riparian Ecosystems Frequent flooding, nitrogen inflow from terrestrial ecosystems, and the presence of vegetation in riparian ecosystems can affect denitrification rates. Green et al. (2004) estimated that globally, 50% of the nitrogen entering watersheds, including streams, is denitrified. Thus, denitrification is considered to be the most desirable ways of nitrate removal from watershed ecosystems. In riparian ecosystems, seasonal variation in denitrification rates is important because the most concentrated nitrate inflow occurs during winter, coinciding with low microbial activity and plant uptake of nitrogen (Martin et al 1999). However, there is no typical relationship between denitrification rate and seasonality. In Chesapeake Bay, and the southwest of France, the denitrification rate tended to increase during winter (Weller et al 1994 and Pinay et al 1993). Other research found that denitrification rate was enhanced during spring and fall, and highest during summer in Kingston, Rhode Island (Groffman et al. 1996). This variability in denitrification rates is due to varying amounts of organic matter, the presence of vegetation, flooding times and oxygen levels (Reddy and Delaune, 2008). In addition, because denitrification rate is regulated by carbon availability, nitrification activity for nitrate supply, microbial activity, and optimal pH and temperature, it is expected that the lowest activity will be observed in deeper sediments (Martin et al., 1999). However, some research has found significant denitrification rates in deeper soils in riparian ecosystems (Sotomayor et al., 1996; Francis et al., 1989; Lind et al., 1989).
40
Factors Affecting Denitrification Rates Nitrate Forest ecosystems typically are not limited by oxygen, and thus microbes prefer to use oxygen rather than an alternative electron acceptor such as nitrate. In addition, plant and microbial growth typically suffers from nitrogen limitation in forest ecosystems, except for fertilized soils (Robertson and Tiedje, 1984; Davidson and Swank, 1987). However, in wetland ecosystems, nitrate is used more actively as an alternative electron acceptor due to absence of oxygen, and thus the nitrate availability can regulate denitrification rates in wetland soils (Reddy and DeLaune, 2008). Nitrate availability is also affected by the movement of nitrate into anaerobic sites from aerobic zones with nitrification, even though an external source of nitrate is present such as waste water, runoff, or precipitation. Organic carbon The addition of carbon enhances denitrification rates because denitrifiers are heterotrophs, using organic carbon as an energy source (de Catanzaro and Beauchamp, 1985; Paul and Beauchamp, 1989). Research has shown that the denitrification rate is correlated with organic carbon concentrations (Reddy and DeLaune, 2008). However, carbon does not regulate denitrification rate in mineral soils with high organic matter, such as sludge-amended soil due to carbon saturation (Maier et al., 2000). Therefore, in carbon-limited conditions, the addition of a carbon source may enhance denitrification, while under high carbon conditions, the impact of nitrate addition on denitrification can be more apparent.
41
Temperature Denitrification increases with temperature according to the Q10 value. The optimal temperature ranges from 30ºC to 40ºC, although temperatures often fall outside this range (Tate, 2000). Plants The presence of plants can not only increase denitrification but also compete with denitrification. Plant uptake of nitrate can decrease the supply of electron acceptors for denitrifiers and inhibit the process. However, root exudates by plants can provide an energy source for denitrification, and oxygen released from plants can stimulate nitrification, enhancing the supply of nitrate to denitrifiers (Hopfensperger et al., 2009). Biochemistry of Denitrification Denitrification is the reduction of nitrate to nitrogen gas. Enzymes involved in the process include nitrate reductase, nitrite reductase, nitric oxide reductase, and nitrous oxide reductase. The common nitrate reduction process can be summarized as (Reddy and DeLaune, 2008): NO3- →NO2- → NO → N2O (gas) → N2 (gas)
(2-4)
Denitrifying bacteria are found in many divisions of the domain Bacteria. The majority of denitrifiers are heterotrophs and the overall process is following (Reddy and DeLaune, 2008): 5C6H12O6 (glucose) + 24NO3- +24H+ = 30CO2 + 42H2O +12N2 ∆G0°= -14562.09 kJ· mole-1
(2-5)
Microbial Community of Denitrifiers Denitrifiers are classified into three groups based on their energy source: organotrophs, which use organic matter, lithrotrophs, which use inorganic matter (e.g.
42
hydrogen or reduced sulfur compounds), and phototrophs, which use light as their energy sources. The most common denitrifiers are organotrophs (Tate, 2000). There are numerous bacterial genera that include strains capable of denitrification. All molecular research on the denitrifying bacterial community uses functional gene coding for nitrate reductase such as nirS and nirK, and coding for nitrous oxide reductase such as nosZ (Bothe, 2000). Measurement of Denitrification Rates Acetylene blocking method and measurement of nitrate consumption rates Direct measurement of nitrogen gas as the end product of denitrification is very difficult, because the atmosphere contains about 80% of nitrogen gas. Therefore indirect measurement methods are used. As the indirect method, acetylene blocking is the most extensively used technique of denitrification rate measurement because of its low cost, simplicity, and high sensitivity. The principle of this method is to measure the amount of nitrous oxide produced by denitrification in the headspace using gas chromatography after acetylene inhibits the reduction of nitrous oxide to nitrogen gas (Tiedje et al., 1988). However, acetylene inhibits nitrification and thus will underestimate denitrification rates when nitrate is low (Seitzinger et al., 1993). Another method is to measure the consumption rates of nitrate for a certain time interval. However, nitrate can be lost by immobilization, resulting in low sensitivity (Alef and Nannipieri, 1995). Measurement of the ratio of change relative to a conservative property This method is based on measuring the change in ratio of a conservative molecule (e.g. chloride or argon) to nitrate or nitrogen gas. When using chloride, the method assumes that nitrate and chloride have the same mobility. After the nitrate is consumed by denitrification, the ratio of nitrate to chloride will be decreased (Alef and Nannipieri, 43
1995). The measurement of the change in relative ratio of nitrogen to argon gas in the sample is premised on the fact that nitrogen gas production by denitrification can increase the ratio of nitrogen to argon gas. This method is not as sensitive compared to the methods mentioned above, but can give a representative measure of denitrification in large scale natural settings (Groffman et al., 2006). Isotope method Isotope method can improve the sensitivity and specificity of detection of denitrification. This method assumes a random association and homogenous distribution of 15N-nitrogen in the denitrification zone. After 15N-labeled nitrate is added to the sample and incubated, the isotopic composition of nitrogen gas is analyzed using a isotope ratio mass spectrometry following separation by gas chromatography (Groffman et al., 2006). The ratio of 15N-nitrogen gas (14N15N to 14N14N) is calculated as excess above their natural abundance (Thamdrup et al., 2000). However, enrichment of 15
N-labeled nitrate can stimulate denitrification rates and it is difficult to mix 15N-labeled
nitrate homogeneously into soils (Groffman et al., 2006). Dissimilatory Nitrate Reduction to Ammonium (DNRA) Nitrite and nitrate are reduced to nitrogen gas in soils by anammox and denitrification, respectively. Thus, these processes play important roles in removal of nitrogen from soils. However, nitrate can be also reduced to ammonium by dissimilatory nitrate reduction to ammonium (DNRA) (Fewson et al., 1961). DNRA is performed by obligate anaerobes that live in highly reduced conditions such as lake sediments or permanently waterlogged wetlands (Reddy and DeLaune, 2008).
44
Agricultural Soils DNRA is desirable for agricultural soils because conserved nitrogen can be used by plants in a nitrogen limited environment (King et al., 1985). DNRA can also be a beneficial process in non-eutrophic environments as a supply of nutrient to organisms. Most research regarding DNRA in agroecosystems has focused on identifying favorable conditions for DNRA, in order to retain nitrogen in systems. For example, the addition of glucose and highly reduced conditions enhanced DNRA up to 5 times that of nitrate reduction in Chinese and Australian paddy soils (Yin et al., 2002). Also, in a cultivated field soil in France, the addition of carbon source with an increased TC:TN ratio was found to stimulate DNRA (Fazzolari et al., 1998). However, the contribution of DNRA to nitrate removal tends to be smaller than other processes (such as immobilization or denitrification) in agroecosystems. Freshwater and Riparian Ecosystems Freshwater sediments and riparian wetlands have good conditions for DNRA due to the absence of oxygen and accumulation of organic matter (Matheson et al., 2002). For example, in unplanted riparian wetland soil, DNRA can be the principal mechanism of nitrate removal (49%), but with the presence of plants, denitrification was found to be the primary mechanism of nitrate removal (61% to 63%) due to increased nitrification via a supply of oxygen from root zone (Matheson et al., 2002). Typically, the overall proportion of nitrate removal due to DNRA is not larger (1% to 9%) than denitrification in freshwater and riparian ecosystems, except for in unplanted soils and sediments with high amounts of organic matter (Matheson et al., 2002).
45
Estuarine and Coastal Ecosystems Estuarine and coastal ecosystems have a mixture of freshwater and salt water. As a result, they may have relatively high amounts of organic matter flowing from the land. Denitrification in these ecosystems plays an important role in the removal of nitrate, preventing eutrophication of the ocean ecosystem. However, DNRA can adversely accelerate eutrophication through the accumulation of ammonium in coastal ecosystems. Estuarine and coastal ecosystems have higher amounts of organic matter and nutrients, and lower oxygen concentrations than terrestrial ecosystems, leading to favorable conditions for DNRA. Laguna Madre and Baffin and Concepcion Bays showed high rates of DNRA (0.656 to 32.94 mM N·m-2·day-1), resulting in eutrophication (An et al., 2002). Lakes Organic matter accumulation through eutrophication in lakes leads to an increase in electron donor availability and a decrease in oxygen release, which can be favorable to DNRA. However, the presence of plants can increase the oxygen released into the rhizosphere, and this can stimulate denitrification via a supply of nitrate from nitrification rather than DNRA. Also, when nitrate is limited and the carbon is high, fermentative bacteria responsible for DNRA can be dominant due to the increased carbon contents. However, once nitrate was added, denitrifying bacteria became dominant due to the supply of an electron acceptor (Angelo et al., 1993). Factors Affecting DNRA Rates Nitrate Under nitrate-limited conditions, the DNRA process is more efficient than denitrification, because DNRA consumes 8e- per mole of nitrate reduced to ammonium
46
versus 5e- for denitrification (Tiedje, 1988). In highly reduced and nitrate limited conditions, DNRA activity increased up to 20% (Ambus et al., 1992). However, in extremely nitrate-limited conditions such as a forest ecosystem, most nitrate was consumed by immobilization and less than 5% of nitrate was reduced via dissimilatory pathways such as DNRA (Bengtsson and Bergwall, 2000). Organic carbon The addition or increase of a carbon source such as glucose, DOC, or organic matter, increases DNRA rates (Fazzolari et al., 1998; Tobias et al., 2001; Kelso et al., 1999; Ambus et al., 1992). High DNRA rates can be expected in saturated and carbonrich conditions, such as stagnant water, sewage sludge, high organic matter sediments, and rumens (Maier et al., 2000). Sulfate Reduced sulfur compounds (hydrogen sulfide, iron sulfide, and thiosulfate) can be used as electron donors for DNRA instead of organic matter. Thus, the addition of sulfide has been found to increase the oxidation of sulfide, while simultaneously reducing nitrate to ammonium (Brunet et al., 1996). In Laguna Madre and Baffin Bay, Texas, sulfide-induced DNRA contributed to the accumulation of ammonium (An et al., 2002). Plants Plants can provide oxygen to the soil profile via root respirations. However, DNRA microbes are fermentative and favor highly reduced conditions. Thus, the presence of plants can decrease DNRA rates. It has been reported that the presence of plants inhibits DNRA through the supply of oxygen in riparian and lake ecosystems (Matheson et al., 2002). 47
Biochemistry of DNRA As mentioned above, the DNRA process consists of two steps: nitrate reduction to nitrite, and nitrite reduction to ammonium. Nitrate reduction to nitrite produces energy in most organisms (Betlach et al., 1982). However, the second step, reduction of nitrite to ammonium, does not create additional energy, but regenerates reducing equivalents through the reoxidation of NADH2 to NAD+. Theses reducing equivalents are then used to oxidize carbon substrates. Overall reaction is following (Tiedje, 1988): C6H12O6 + 3NO3- + 3H+ = 6CO2+ 3NH3 + 3H2O
(2-6)
The free energy is ∆G0'== -144 kcal (Tiedje, 1988). Microbial Diversity of DNRA Bacteria Using a culture medium method, bacteria found to be capable of DNRA were Clostridium and Bacillus sp. (Caskey et al., 1979 and 1980). The ammonium producing isolates were Clostridium KDHS2, Clostridium KDHS3, and Bacillus KFHS6. Recent research has found that low nitrate concentrations resulted in a DNRA community composed of Bacillus strains in the rhizosphere of Glyceria maxima (Nijburg, 1997). It has also been reported that Bacillus jeotgali-related strains and two newly identified strains of GD0705 and GD0706 capable of DNRA are isolated in cultures from ammonium enriched soils (Fan et al., 2006). However, at present, research on microbial communities capable of DNRA has not been performed based on 16S rRNA or FISH (Fluorescent In Situ Hybridization). Therefore, the primer and probes used to detect DNRA bacteria need to be developed and used to investigate DNRA communities in natural ecosystems with DNRA rates.
48
Measurement of DNRA Rates When 15N-labeled nitrate is added to sediments, DNRA bacteria reduce the 15N labeled-nitrate to 15N-ammonium. The 15N-ammonium contents are measured using a isotope ratio mass spectrophotometer equipped with an elemental analyzer. Summary A review of the literature indicated that inorganic nitrogen transformation rates vary depending on ecosystem types (e.g. agriculture soils, forest soils, estuarine sediments, stream, or ocean water), plants, and biogeochemical properties (e.g. concentrations of nitrite, nitrate, ammonium, and organic carbon, and oxygen, pH, level of reduced conditions). Also, higher nitrification rates can lead to increased denitrification rates, while higher denitrification rates can inhibit anammox and DNRA rates due to competition for electron acceptors. However, most previous studies were performed in terrestrial soils, stream water, estuarine sediments, or ocean water. Research on inorganic nitrogen transformation rates in tributary sediments is limited, even though tributary sediments can function as sinks for nitrogen in watershed ecosystems. Also, all inorganic nitrogen transformation rates including nitrification, anammox, denitrification, and DNRA have not been thoroughly investigated. Furthermore, information on the relationships between microbial function and structure associated with these processes is limited. Thus, comprehensive research on inorganic nitrogen transformation rates and microbial assemblage structures associated with these processes is needed in tributary sediments.
49
CHAPTER 3 INORGANIC NITROGEN TRANSFORMATIONS IN TRIBUTARY SEDIMENTS An excessive input of nitrogen to aquatic ecosystems can result in eutrophication, impairment of water quality, and human health problems such as a blue baby syndrome (Prasad and Power, 1995; Ward and Elliot, 1995; Sotomayor and Rice, 1996) and cancers (Prasad and Power, 1995; Starr and Gillham, 1993). It has been reported that riparian zones and tributaries in a watersheds can attenuate nitrogen through plant uptake, microbial immobilization, denitrification, and soil storage (Lowrance et al., 1997). Specifically, small streams have a higher efficiency of NO3- removal than larger rivers because they have a smaller volume to surface ratio, increasing the possibility for benthic denitrification (Alexander et al., 2000). Results from twelve headwater streams as parts of the Lotic Intersite Nitrogen eXperiment (LINX) demonstrated that NH4+ entering small streams was oxidized to NO3by nitrification, enhancing denitrification rates via a supply of NO3- to denitrifiers (Peterson et al., 2001). Therefore, previous research by many scientists has focused on denitrification rates in small streams (Ceya et al., 1999; Mulholland et al., 2001 and 2004; Steinhart and Groffman, 1998). Several studies have documented that denitrification is a major contributor to nitrogen removal in tributary ecosystems (Steinhart and Groffman, 1998; Clausen et al., 2000; Lowrance et al., 1997; Korom, 1992). However, denitrification rates can be affected by other nitrogen transformations. For example, nitrification provides NO3- to denitrifiers. Ammonification supplies NH4+ to nitrifiers, increasing nitrification rates. ANaerobic AMMonium OXidation (Anammox) can anaerobically oxidize NH4+ to N2 (Dalsgaard et al., 2005), potentially decreasing NH4+ concentrations. Dissimilatory Nitrate Reduction to Ammonium (DNRA) potentially leads
50
to accumulation of NH4+ (An et al., 2002). Therefore, to understand the function of small streams with respect to N removal, further understanding is needed on relative rates of ammonification, nitrification, anammox, denitrification, and DNRA processes in tributary ecosystems. Inorganic nitrogen transformation rates can be controlled by soil moisture content (Klemedtsson et al., 1988), hydraulic conductivity (Gilliam, 1994), temperature (William et al., 1997), different agricultural activities, (Martin et al., 1999), vegetation types (Haycock and Pinay, 1993), geomorphological properties (Opdyke et al., 2006), and seasonal variation (Rysgaard et al., 2005; Christensen et al., 1990). Many of these factors regulate the levels of electron donors and acceptors that can have profound influence on the relative rates of inorganic nitrogen transformation rates (Burford and Bremner, 1975; Reddy et al., 1982). For example, organic matter can increase denitrification and DNRA rates because these processes use organic matter as energy sources (Kaspar, 1983; Tobias et al., 2001; Yin et al., 2002). The concentrations of NO3and NO2- can also control denitrification and anammox rates via supply of electron acceptors, respectively. The critical zones for inorganic nitrogen transformations in tributaries are benthic sediments (Steinhart et al., 1998; Chatarpaul and Robinson, 1979; Hill, 1983; Swank and Caskey, 1982; Holmes et al., 1996, Mulholland and Hill, 1997) and riparian sediments (Bowden et al., 1992; Pinay et al., 1993 and 1995). Even though microbes in the water column of streams can participate in nitrogen cycling, the faster velocities of water flow and lower amounts of organic matter in stream waters can limit the removal of nitrate. However, stream sediments with high microbial activities can function as
51
effective sinks for nitrogen (Jones and Holmes, 1996). In addition, riparian sediments (the transitional area between upland and streams) can receive nitrogen and organic matter runoff from uplands (Freeze and Cherry, 1979; Hill, 1996; Hill and Waddington, 1993; Likens et al., 1977). Fluctuating water tables in riparian sediments creates alternative aerobic and anaerobic conditions that favor denitrification (Bowden et al., 1992; Pinay et al., 1993, 1995). The Santa Fe River tributaries in the Boston Farm Santa Fe Ranch Beef Unit Research Center (SFBRU) receive nitrogen from nursery operations and carbon from dairy manure and surrounding vegetations. It was reported that a tributary with marsh and open water adjacent to the Santa Fe River had the buffer capacity for nitrogen removal through denitrification (Frisbee, 2007). Even though tributary systems have higher potential denitrification rates, their rates can be affected by other nitrogen transformations such as ammonification (Seitzinger, 1994; Gardner et al., 1987), nitrification (Jenkins and Kemp, 1984; Kemp and Dodds, 2002), anammox (Rysgaard et al., 2004; Rich et al., 2008), and DNRA (Rysgaard et al., 1996; Bonin et al., 1998; Michotey and Bonin, 1997). Thus, to understand nitrogen removal in tributaries of the Santa Fe River, I have developed the following objectives to determine relative potential rates of selected inorganic nitrogen transformations in tributary sediments. The overall objective of this research was to investigate how biogeochemical properties influence potential inorganic nitrogen transformation rates in tributary sediments. The specific objectives were to:
Determine potential rates of select inorganic nitrogen transformations in tributary sediments
52
Investigate the relationships between potential rates of inorganic nitrogen transformations and biogeochemical properties in tributary sediments
Compare potential rates of inorganic nitrogen transformations between stream and riparian sediments. Materials and Methods
Site Description The site for this research is tributary sediments (stream sediments and riparian sediments) at the Boston Farm Santa Fe Ranch Beef Unit Research Center (SFBRU) of the Santa Fe River Watershed, northern Alachua County, FL (Figure 3-1). Land uses on this site include a low intensity cattle operation with approximately 300 heifers on 1,600 acres and the nursery operation using nitrogen fertilizer (Holly Factory Nursery) (Frisbee, 2007). One of two tributaries, Tributary 1 (T1) is located along the CR 241roadwaya and flows into a pond before entering into the Santa Fe River (Figure 3-1). The T1 system is surrounded by improved pastures and is impacted by ranch activity. The riparian sediment contains relatively high organic matter contents and receives water from groundwater and seepage water (Figure 3-1 (b)). The stream sediments receive water from stream and have relatively low organic matter contents (Figure 3-1 (b)). The vegetation type adjacent to the tributary sediments is a mixture of herbaceous and woody plants including Carya sp., Pinus sp., Quercus sp., Magnolia grandiflora, Saururus cernuus, Juncus sp., Cephalanthus occidentalis, Hydrocotle umbellata, and Polygonum sp. Tributary 2 (T2) is affected by a nursery operation using nitrogen fertilizer (NH4NO3 and urea) at the headwater stream, drains cattle pasture on the SFBRU and flows into the Santa Fe River (Figure 3-1). The up-stream region of Tributary 2 (T2-U) is affected 53
by nitrogen fertilization and is surrounded with hardwood plants, including Carya sp., Quercus sp., and Magnolia grandiflora sp., and soft wood including of Pinus sp. The downstream region of Tributary 2 (T2-D) is influenced by improved pastures and nitrogen fertilization from the head water (Figure 3-1). The land adjacent to T2-D is surrounded with grasses including Saururus cernuus sp., Juncus sp. and Polygonum sp., deciduous shrub plants including Cephalanthus occidentalis sp., and aquatic plants including Hydrocotle umbellata sp.(Frisbee, 2007). Sampling Samples were collected to a depth of 3 cm with a PVC core (diameter 7.5cm) at T1, T2-U and T2-D. Surface sediments (3 cm dept of sediments) were collected because surface sediments likely have much higher microbial activities compared to deeper sediments. Three samples from three locations (total of 9 samples) were collected in each tributary sediment in October 2007, January, April, and July 2008. Repeated sediment sampling (4 times) was considered as replicates for each sediment type. The sediments were transported to the laboratory on ice and stored at 4°C until analysis. Nine samples from each site were mixed to make a single composite sample. After mixing, triplicate sediments were distributed and prepared for the analysis. All roots and litter materials were removed from the sediment prior to analysis. Analyses of Biogeochemical Properties Sediment pH (1:1 ratio of sediments to water) was measured using a Fisher AR50 pH meter (Thomas, 1996). After sediment samples were extracted with 0.5 M K2SO4 (Bundy and Meisinger, 1994), extractable NH4+-N concentration was measured using a Seal AQ2+ automated Discrete Analyzer (EPA Method 350.1). Extractable NO3--N concentrations was analyzed using an Alpkem Rapid Flow Analyzer 300 Series (EPA 54
Method 353.2). The K2SO4 extract was digested for total extractable organic nitrogen (Ext. Org N) via Kjeldahl block digestion. The concentration of Ext. Org N was analyzed using a Seal AQ2+ Automated Discrete Analyzer (EPA Method 351.1). Total extractable organic carbon concentration (Ext. Org C) was analyzed from the extract using a Shimadzu TOC-5050A Total Organic Carbon Analyzer equipped with a ASI-5000A auto sampler. Microbial biomass carbon (MBC) and microbial biomass nitrogen (MBN) were extracted from sediments using a chloroform fumigation-extraction method (Brookes et al., 1985). Both the chloroform-fumigated and non-fumigated samples were extracted with 0.5 M K2SO4 for analyses of MBC and MBN. To measure MBC, each extracted sample was analyzed for extractable organic carbon (Ext. Org C) concentrations using a Shimadzu TOC-5050A Total Organic Carbon Analyzer equipped with an ASI-5000A auto sampler. To measure MBN, each extracted sample was digested for extractable organic nitrogen (Ext. Org N) via Kjeldahl digestion (Brookes et al., 1985). The concentrations of MBN were measured using a Seal AQ2+ Automated Discrete Analyzer (EPA Method 351.1). MBC and MBN concentrations were calculated by the difference between the fumigated and non-fumigated samples. The subsamples of sediments were dried at 70°C for 3 days and then ground using a ball grinder for total nitrogen (TN) and carbon (TC) analyses. TN and TC concentrations were measured on dry sediments using a Thermo Electron Corp. Flash EA 1112 Series NC Soil Analyzer (Nelson and Sommers, 1996; Bremmer, 1996). Potential Nitrogen Transformations Rates Potential rates were determined on triplicate sediments. For analysis of potential ammonification rates, 5 g of wet sediment and 5 ml of distilled de-ionized (DDI) water were added to 60 ml serum bottles. The sediments were purged with pure N2 to create 55
anaerobic conditions and incubated for seven days at 24°C. After incubation, sediments were extracted using 0.5 M K2SO4 solution and extractable NH4+-N concentrations were measured using a Seal AQ2+ Automated Discrete Analyzer (Warning and Bremner, 1964) (EPA Method 350.1). For analysis of potential nitrification rates, 10 g of wet sediment were added to an 160 ml open bottle. Sediments were amended with 1400 μg of NH4+-N (as NH4Cl) followed by 30 ml DDI water. All samples were incubated in a Model 25 incubator shaker at 130 rpm (New Brunswick Scientific Co) for seven days at 24°C (Berg and Rosswall, 1995). After incubation, sediments were extracted using 0.5 M K2SO4 solution and extractable NO3--N concentration was measured using an Alpkem Rapid Flow Analyzer 300 Series (EPA Method 353.2). Potential anammox rates were determined using 15N-labeled NH4+-N (99 atom % 15
N as15NH4Cl) and 14NO2--N (as NaNO2) amended to sediments (Kuypers et al., 2003).
Ten grams of wet sediments were added to a 160 ml serum bottle and purged with N2 for 15 minutes to create anaerobic conditions. Sediments spiked with 1500 μg of 15Nlabeled 15NH4+-N (99 at% 15N as15NH4Cl ) and 1400 μg of 14NO2--N (as NaNO2) using a syringe. All bottles (with sediments) were incubated in a Model 25 shaker incubator (New Brunswick Scientific Co.) at 130 rpm for seven days at 24°C. After incubation, the gas in the headspace was extracted into a 2 ml serum vacuum bottle. The ratios of 28N2 to 29N2 were measured using a isotope mass spec Costech Instrument Elemental Analyzer (Kuypers et al., 2003; Dalsgaard et al., 2005). The potential rates of anammox were calculated by the difference in the ratios of 28N2 to 29N2 between natural abundance and samples. The ratio of 15N-labeled N2 (28N2 and 29N2) was calculated as
56
excess above their natural abundance using the equation suggested by Hauck et al. (1958). Potential denitrification rates were determined by an acetylene blocking method (Tiedje, 1999). Ten grams of wet sediments were added to a 160 ml serum bottle and purged with N2 for 15 minutes to create anaerobic conditions. Each bottle was amended with 1400 μg of NO3--N (as KNO3) per 10 g of wet sediments and 20 ml of acetylene gas (12.5% of 160 ml serum bottle). N2O was measured at pre-determined time intervals up to 4.5 hours using a Shimadzu Gas Chromatograph 14-A (GC) (Tiedje, 1999). Potential denitrification enzyme activity (DEA) was also measured as above. However, 1.44 mg of C6H12O6-C (glucose) and 280 μg of NO3--N (as KNO3) were added to 10 g of wet sediments for supply of sufficient carbon to denitrifiers (Tiedje, 1999). For analysis of potential DNRA rates, 10 g of wet sediments were added to a 160 ml serum bottle and purged with N2 for 15 minutes to create anaerobic conditions. Using a syringe, 1500 μg of 15N-labeled NO3--N (99 at%15N as K15NO3) per 10 g of wet sediments were added to each bottle and mixed with sediments. All bottles were placed in a Model 25 incubator shaker at 130 rpm (New Brunswick Scientific Co. INC) for seven days at 24°C. After incubation, sediments were extracted with 2 M KCl. The 15
NH4+-N in the extracted solution was converted to 15NH3 on an acid disk using a
diffusion technique (Stark and Hart, 1996). The ratios of 15NH4+-N to14NH4+-N on the acid disk were analyzed with a Thermo Finnigan MAT Delta Plus XL Mass Spectrophotometer equipped with a Costech Instrument Elemental Analyzer for flash combustion of solid material for N analysis (Rysgaard-Petersen and Rysgaard, 1993).
57
Statistical Analysis Statistical analysis was conducted using JMP version 8.0 (SAS 2007). One way analysis of variance test (ANOVA) was performed to investigate difference in biogeochemical properties and potential inorganic nitrogen transformation rates between sites. Least significant difference at the 5% confidence level was used for comparisons. All post comparisons of means were accomplished using a Tukey-Kramer HSD test, which adjusted for the overall error rates. Regression analysis was performed to determine if any relationships existed among these parameters using a Standard Least Squares model. Results Biogeochemical Properties The lowest pH of stream sediments was observed in T2-U with an average pH of 5.0. The highest NO3--N concentration was observed in stream sediments of T2-U and T2-D (p