Spread and Skepticism: Metrics of Propagation on Twitter Samantha Finn
Panagiotis Takis Metaxas∗
Eni Mustafaraj
Computer Science Wellesley College
[email protected]
Computer Science Wellesley College
[email protected]
Computer Science Wellesley College
[email protected]
Abstract Social media has become part of modern news reporting, used by journalists to spread information and find sources, or as a news source by individuals. The quest for prominence and recognition on sites like Twitter can sometimes eclipse accuracy and lead to the spread of false information. Could we use the so-called “wisdom of crowds” to predict the likelihood that a claim may be true or false? This paper, part of ongoing research, offers evidence that most false claims do not spread like true ones, and that the reaction of the audience to a claim on Twitter is correlated with its validity.
1
Introduction
As Twitter’s role in breaking and spreading news increases, so does the need for evaluating the credibility of information propagating on Twitter. Recently, we have developed twittertrails.com, a system that allows a user monitor rumors on Twitter (Finn et al. 2014). T WITTERT RAILS can help casual users by providing an automatically calculated label, “likely true” or “likely false,” for the question of credibility of a claim, based on the behavior of the crowd discussing the claim. This binary classification makes use of two novel features: spread and skepticism. Spread reflects how far and wide the claim is circulating, and skepticism reflects the prominence of doubt in a claim . This paper, which is a work in progress, makes the following contributions: We introduce two new metrics, spread and skepticism. These metrics leverage the “wisdom of the crowds” applied to sets of tweets related to the story being investigated. Using these metrics, we propose, train, and evaluate an observable algorithm for classifying claims discussed on Twitter as true or false. Our dataset consists of ”stories”: collections of tweets related to a single subject and focused on “claims” (stories which can be proven true or false). We use the Twitter Search API1 to collect data, which gives access to tweets from the last week containing a given search term. We manually determine search terms based on what will yield the most relevant results to the claim being investigated. ∗ Corresponding author. c 2015, Association for the Advancement of Artificial Copyright Intelligence (www.aaai.org). All rights reserved. 1 https://dev.twitter.com/rest/public/search
In this paper, we study data about 236 claims, collected from 03/2014 to 05/2015 and ranging in size from a few dozen tweets to over 60,000, which we have manually verified as being true or false.
2
Spread and Skepticism
In order to measure the impact and visibility of a story on Twitter, we define a metric called spread, calculated by repurposing the h-index from Library science (Hirsch 2005). We consider a tweet as a “publication,” and its retweets as citations and evidence of its visibility in the network.The h-index of a collection of N publications is defined to be h when there are h publications in the collection that each have at least h citations, and the remaining (N − h) publications have less than h citations each. In a similar fashion, we calculate the spread of a set of tweets: the set of tweets has a spread of h if there are h tweets that have received at least h retweets. Spread measures simultaneously the propagation and number of the highest reaching tweets. It does not reflect the few tweets with the most retweets, nor does it measure how many tweets were collected. Although these numbers are interesting and meaningful, the spread is meant to give an overall picture of the impact of a story: how visible it was as well as how many people were engaged in it.2 Skepticism measures the prominence of doubt and mistrust in a story. The first step to calculating the skepticism is to identify tweets in which the author expresses doubt in the validity of a claim, whether they are wondering if the claim is false or expressing that it is an outright lie. For now, we employ a simple algorithm, which works fairly well: we identify tweets containing commonly used keywords to express doubt or disbelief (such as hoax or fake), which can be modified for individual stories. Using this algorithm, we separate data into two subsets: those which express doubt and those which do not (implicitly expressing support). The skepticism of a story is defined as the ratio of the spread of doubting tweets to the spread of supporting tweets. There are very few stories which we have collected where doubt in a claim spreads farther than its support. After a 2
See a more detailed post on our blog for illustrative examples: https://blogs.wellesley.edu/twittertrails/2015/02/16/twittertrailsmetrics-spread-and-skepticism/
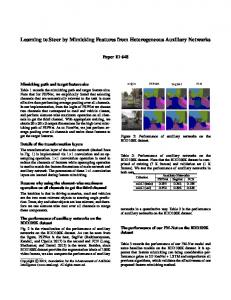
Figure 1: (best observed in color) This graph plots over 200 claims, with spread represented on the y-axis and skepticism on the x-axis. Claims are marked by either a red diamond (false claims) or a blue circle (true claims). There is some separation between claims proven to be true and those proven to be false. false claim picks up steam, people begin to doubt it or realize that it is false. Doubt expressed en masse will diminish and even stop support of the claim, but very infrequently will it spread as far as its initial support (especially on an emotionally charged claim). From our experience, a ratio greater than 0.20 tends to be a strong indicators of a false claim.
3
Labeling True vs. False Claims
Figure 1 plots our claims, manually labeled as true or false, to gain more insight into how they behave on Twitter based on their skepticism and spread. This graph leads us to two important observations: first, the generally disparate nature of true and false claims. True claims have low skepticism, though they vary in spread, while false claims have low spread but vary in skepticism. There is only a small area of overlap with low spread and low skepticism. Second, there are no claims with high spread and high skepticism. We observe that generally on Twitter, when people are doubtful of the information in a tweet, they appear to be less likely to retweet it (though they may still discuss it). As a result, this information does not propagate as much as information users trust. This results in a trend on Twitter for false claims having less visibility, which is not true for all social media websites, e.g., Facebook (Friggeri et al. 2014). Based on the observation from the graph in Figure 1, we can see that spread and skepticism are meaningful metrics in which to attempt to differentiate true claims from false ones. We use this information to create a machine learning classifier which uses skepticism and spread as features. Having manually labeled our claims as true or false, we trained two classifiers, Naive Bayes and Classification Tree, with leave-one-out validation, and obtained accuracy scores of, respectively, 0.869 and 0.865. The current L-shape of the labeled stories in Figure 1, leads us to the following observation: On Twitter, claims which have high skepticism and low spread are more likely to be false, while claims which have
low skepticism and high spread are more likely to be true. We make this observation specific for Twitter because it does not hold for every social network. Twitter’s interface has the particular feature that both support and denial for a claim will get the same amount of real estate on a user’s stream, as be individual tweets. This is apparently not true for Facebook, where support for a claim, in the form of a post, gets much greater exposure doubt in the form of a comment. This may explain the result by (Friggeri et al. 2014) who find that false claims on Facebook live for a long time, even when they are countered by a quick search on Snopes.
4
Conclusion and Future Work
twittertrails.com was designed and implemented with the goal to provide a vital service to users who want to engage with Twitter as a source of reliable information. We observe that true and false rumors have different footprints in terms of how they spread and invoke skepticism by their audience. There are, however, several limitations that we are currently dealing with and acknowledge here. First, selecting appropriate search terms for a claim can be error prone, which can affect the recall rate of our system. Second, the set of claims we have investigated so far is not a random sample of all claims on Twitter. They are influenced by what journalists have been interested in examining and writing about. Finally, our negation detection algorithm is rather naive, which we are working on improving.
References Finn, S.; Metaxas, P.; Mustafaraj, E.; OKeefe, M.; Tang, L.; Tang, S.; and Zeng, L. 2014. Trails: A system for monitoring the propagation of rumors on twitter. Comp Journ Symp. Friggeri, A.; Adamic, L.; Eckles, D.; and Cheng, J. 2014. Rumor Cascades. In ICWSM. Hirsch, J. 2005. An index to quantify an individual’s scientific research output. PNAS 102(46).