Insights From the Use of A Standard Taxonomy For Remote Sensing Analysis S. Kari and R.L. King Department of Electrical and Computer Engineering , Mississippi State University, Mississippi State, MS 39762-9571, USA –
[email protected] Abstract – Knowledge acquisition is concerned with finding and structuring knowledge in such a way that it can be used in a variety of intelligent decision-making tools. Knowledge of a domain can be encoded as a taxonomy (i.e., a hierarchically organized set of categories). Therefore, taxonomies can play an important role in analyzing and modeling knowledge. The focus of this study is to derive knowledge from a standard taxonomic structure in the remote sensing domain. Previously published work by a number of multi disciplinary researchers in analyzing remote sensing data has been used in this study to examine the structure of their methodologies from a taxonomical perspective. The analysis of the developed taxonomies clearly indicates a definite structure to the underlying analysis procedures and has potential for the development of systems to automate them.
Although taxonomy has its roots in biology (for classifying plants and animals), it has been applied in a variety of disciplines. For example, a hyperspectral unmixing algorithm taxonomy has been proposed (Keshava, 2000). It used a three step process for a Linear Mixing Model: • • •
Dimension Reduction Endmember Determination Inversion
Algorithms used in dimension reduction, endmember determination, and inversion are classified separately to develop a taxonomic structure for linear mixing algorithms. Classifying the algorithms at the highest levels, using general assumptions, provides a framework for future algorithm development and also indicates what is complete and what is not complete (Keshava, 2000).
Keywords: Taxonomy, remote sensing analysis, decision making, knowledge discovery. 1.
INTRODUCTION
1.1 Taxonomy background Taxonomy is the science of naming and classifying organisms according to their hierarchy and grouping them based on their similarities. An old proverb says, "Wisdom begins by calling things by their right names." Biological taxonomists exercise wisdom in their work and decision making process by calling organisms by their correct names. Also, taxonomy helps decision-making in other areas as well. Having a common scientific name is of great advantage to scientists because they can discuss or research organisms using a common vocabulary. Taxonomic nomenclature provides the most fundamental building block to classify organisms. The Linnaean taxonomic system, named in honor of Swedish biologist Carolus Linnaeus, is the system currently used by most taxonomists. This system classifies organisms using seven major divisions beginning at the most important category and continuing to the least important category: kingdom, phylum, class, order, family, genus and species. Species is the most specific category taxonomy proposed by Linnaeus. Taxonomy shows the degree of relation between organisms. Table 1 demonstrates that humans and armadillos belong to the same kingdom, Animal (from Latin Animalia: animals), the same phylum, Chordates (from Latin Chordata: chordates, which are animals having a notochord), the same class, Mammals (from Latin Mammalia: mammals, being animals that have hair and give milk to their young), but humans and armadillos are different in other categories.
Kingdom Phylum Class Order Family Genus Species
Human Animalia Chordata Mammalia Primata Hominidae Homo Homo sapiens
Nine Banded Armadillo Animalia Chordata Mammalia Xenarthra Dasypodidae Dasypus Dasypus novemcinctus
Table 1 Taxonomy of Humans and Armadillos Grimshaw, 1996 classified geographical information systems (GIS) by adapting an earlier taxonomy of information systems. GIS taxonomy acts as a diagnostic tool in business organizations in choosing an appropriate management strategy for adopting GIS. In this paper, insights from the use of a standard taxonomy for remote sensing analysis techniques will be discussed. Taxonomic structure reduces the size of a knowledge base as it increases its readability. By analyzing the taxonomic structure of a remote sensing system, decision makers can choose from which technique to use or which algorithm to use based on the desired outcome. Uncertainties associated with decision-making will be reduced (King, 2003). Information represented in a systematic way can give ideas of what to choose and where to start. This systematic representation can be obtained by the application of a taxonomy to the required system. Taxonomy for remote sensing systems allows analysts to choose between the available mathematical methodologies and analyze why different techniques are being used to obtain the same output (King, 2003).
Many applications of remote sensing systems are very crucial for the environment of the Earth and so there is a need for representing remote sensing analysis techniques in terms of a taxonomic structure. Taxonomy may not solve problems completely, but many times it can help in selecting a good approach. 1.2 Decision making Decision-making, a process of choosing among alternative courses of action to attain a goal or goals, is considered a most difficult task for a variety of reasons (Turban, 2001): • There may be hundreds or thousands of alternatives to consider. • Many decisions involve risk. Different people have different attitudes toward risk. • Gathering information and analyzing the problem takes time and is expensive. It is difficult to determine when to stop this and make a decision. • Experimentation with the real system may result in loss. • Changes in the decision-making environment may occur continuously, leading to invalidating assumptions about the situation.
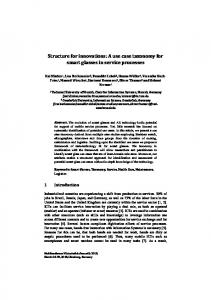
difference between the expected output and the resultant output occurs, then the decision maker should take feedback and perform the necessary changes to meet the requirements. Maintaining the structure of a system depends on the decisionmaker (Turban, 2001). Remote sensing analysis techniques can be related to system structure. Figure 2 shows a block diagram of the remote sensing end-to-end information channel (Gasiewski, 2003). Inputs to the end-to-end information channel are targets in the sensor system (e.g., Earth's oceans, atmosphere or land masses); channel processes are the decision system; and the final output is the delivery system, and the final outcome is a socio economic benefit. If a person chooses some technique and attempts to produce an output, then he/she may or may not succeed, resulting in loss of time and money. The inputs are scene and sensor systems that continually change and so new techniques must be developed constantly to meet emerging requirements. With the high degree of uncertainity in the system, it is important for the decision maker to choose an optimum approach (King, 2003). Having a taxonomic structure for remote sensing systems allows the decisionmaker to understand the available resources and processes from which to choose. 1.3 Role of an Analyst An analyst differs from the decision-maker in that an analyst understands the analytical tools used in making a decision and decision-makers integrate the information into their decision making. An analyst is involved with each step of decision making and a decision-maker is the customer to an analyst. So, an analyst should act according to the needs of a decisionmaker.
Figure 1 Structure of a simple system. A system is a collection of objects intended either to perform an identifiable function or to serve a goal. System structure is divided into input, processes and output. The structure of a system is shown in Figure 1. Inputs are the elements that enter the system. Processes are the elements, which when combined with the inputs, produce outputs. Outputs are the final products. There will be many processes and it is the responsibility of decision-makers to ensure that the right processes are being selected to obtain the correct output. If any
In remote sensing analysis, analysts can play vital roles by filtering the database. Database in remote sensing analysis refers to the technologies used for acquiring images, algorithms used or the type of context (spatial, spectral, temporal). For example, different techniques are available to decision-makers and in such situations an analyst can help the decision-maker choose because the analyst filters unwanted techniques by studying the requirements. An analyst's duty is to be familiar with common deficiencies or problems encountered in producing certain outputs. The analyst can assess reliability of the database by understanding the related interrelationships between collection strategy and context. The analyst must alert the decision-maker about the
Figure 2 Model of the remote sensing end-to-end information channel.
deficiencies and pitfalls that will occur over time. Also, an analyst should be ready with alternatives if the selected technique is not proper. Most importantly they must understand the techniques or methods before suggesting them to the decision-maker. In summary, the difference between a decision-maker and an analyst are summarized in Table 2. Analyst
Decision-maker
Decision context Database (technologies, algorithms, context) and the system that generates it
Information requirements
Tools of analysis and their limitations
Use the information
Quality of the information
Table 2 Analyst vs. Decision-maker roles 2. TAXONOMY The proposed taxonomy has the following main categories: Output, Technology, Functionality, Context, Learning, Family and Series. Here Output is the highest level and Series is the lowest level. The taxonomic structure of the remote sensing systems is shown in Figure 3.
The first category, Output, is the highest level of the remote sensing taxonomy. General categories like Terrain mapping, Atmospheric profiling, Detection, Anomaly detection, Change detection, Classification, and Knowledge discovery are listed. Technology is the next level in the taxonomy and refers to the measurement technique used to obtain the output. The technologies listed are Stereo pairs, Hyperspectral, Multispectral, Thermal, Lidar, Radar, SAR, Altimeter, Sounder, and GPS. Functionality contains the main processing approach that will be used for obtaining the Output. The examples are Feature Extraction, Band selection, Abundance estimation, Interferometry, Data/Image fusion, Empirical models and finally Polarimetry. Context is the next category in the taxonomy. This category is concerned about addressing the output through the various dimensions of the pixel. Spatial resolution is a measure of how well the image can discern between large and small-scale features. The image with higher spatial resolution is of visually better quality. Spectral resolution can characterize the reflectance and emittance of a feature or target over a variety of wavelengths. Temporal resolution is a very important parameter to be considered in remote sensing, where the dynamic nature of objects are quantitatively measured (Bruce, 2004). For example, the Number of returns when the target of interest is observed using Radar or Lidar technique is a temporal context. As more
than one resolution type can be selected, the Context has been categorized in different ways. For instance, if both spatial and temporal resolutions are used then the context will be spatial temporal. Learning category defines the approach used to extrapolate knowledge from a small region of an image to the complete image. It has three divisions, which are Supervised, Unsupervised and Exact. For example, if no training set is used in interpreting an image, then that is an unsupervised classification and if some prior or acquired knowledge is used to estimate the features then that is called a supervised classification. If a closed form solution is known then the subsequent steps are obvious and such classification is called exact. Family in biology is defined as a taxonomic category of related organisms below an order and above a genus. Family lists groups of methodologies or approaches with similar characteristics that are used for obtaining the Output. Based on the selection from Learning category, the approaches in the Family are selected. Species is the specific algorithm selected for the Output. 3. INSIGHTS New insights can be gained from a taxonomic structure. Analysis techniques that are popular in the field of remote sensing can be analyzed. Some techniques were popular in the past and some are still in vogue. The reasons behind these are analyzed with the help of the taxonomic structure. Therefore, the taxonomic structure helps in understanding of what has been done so far and what needs to be done further in the analysis area. The Technology of remote sensing in terms of multispectral, hyperspectral, SAR imagery etc. can be discovered and used to understand the popularity of different algorithms. The popularity of algorithms can be analyzed by analyzing different plots in terms of time frame. The plots are based on the number of papers published in that particular time frame from data collected from IEEE Xplore database. The plots do not represent the exact number of papers published because there are other journals and conferences than IEEE. The application of the algorithms to different technologies in different time frames is discussed and from that the popularity of the algorithms is discussed. With reference to the plots in Kari, 2004, the usage of algorithms began from 1970's. It can be concluded that only Least squares were used in those days. From 1981 - 1985, the usage of RLS and Entropy began. Maximum Likelihood and Least squares were popular during 1986 - 1990. Maximum Likelihood, Least squares and Entropy were popular during 1991 - 1995. There was a drastic change in the usage of algorithms from 1996 - 2000 and this might be due to hyperspectral imagery. Maximum Likelihood seems to be still popular followed by Least squares and Entropy. The usage of PCA and Genetic algorithms has increased. New algorithms like SVMs have come into existence. From 2001 to the present year, the usage of Least squares has decreased compared to previous years, but maximum likelihood and entropy are still
popular. The usage of SVD, RBF, DWT, LDA and SVMs has increased and so maximum likelihood, entropy, SVD, RBF, DWT, LDA and SVMs have become popular since 2001. Maximum Likelihood, Entropy, PCA and Genetic algorithms are popular among multispectral imagery with respect to the 18 algorithms that are compared in different time frames. Among hyperspectral imagery, Maximum Likelihood, PCA, Entropy and SVMs are popular. LDA, Projection Pursuit were popular for some time but from 2001 to the present year, their usage for hyperspectral imagery has decreased. Maximum Likelihood, DCT, PCA, Entropy, SVMs, FFT, SVD and RBF are popular among Radar imagery. Among SAR imagery, Maximum Likelihood, DCT, FFT, LMS and Adaptive filters were popular. Adaptive filters are used to remove the speckle noise in SAR images and so their application in SAR imagery has been observed in different time frames. There are not many papers published based on the application of the selected algorithms for Lidar imagery. However, Maximum Likelihood, LMS and ARMA seem to be popular. 4.
CONCLUSIONS
Decision making is a very complex problem and this problem can be solved very easily by having a taxonomic structure. For obtaining the same output, different approaches can be applied. It is difficult have one standard way of predicting an output. However, understanding the rationale behind alternative approaches helps the decision makers in selecting between options. Further research is recommended to develop a standard for obtaining the Output in remote sensing analysis using a taxonomic structure. There are many algorithms and it is difficult to find the popularity of each and every algorithm. The work that has been done in this paper can be developed by finding the popularity of more algorithms so that the knowledge of the technologies and techniques used can be gained. 5. REFERENCES Bruce, L. M., "ECE 8473 : Intro to digital image processing , spring 2004." Gasiewski, A. J., P. C. Smits, and R. L. King, "The grsstechnical committees: Voices of the geoscience and remote sensing society," IEEE GRS-S Newsletter, pp. 12-16, June 2003. Grimshaw, D. J., "Towards a taxonomy of geographical information systems," IEEE Conference on System Sciences, pp. 547-556, Jan. 1996. Keshava, N., J. Kerekes, D. Manolakis, and G. Shaw, "Algorithm taxonomy for hyperspectral unmixing," Proc. SPIE, vol. 4049, pp. 42-63, April 2000. Kari, S., “Insights From the Use of a Standard Taxonomy For Remote Sensing Analysis,” MSEE Thesis, December 2004. King, R. L., "Putting information into the service of decision making: The role of remote sensing analysis," Proc. IEEE workshop on Advances in Techniques for Analysis of Remotely Sensed Data, pp. 25-29, Oct. 2003. Turban E. and J. E. Aronson, Decision Support Systems and Intelligent Systems, 6th ed. Prentice Hall, 2001.