Digital Industrial Radiology and Computed Tomography (DIR 2015) 22-25 June 2015, Belgium, Ghent - www.ndt.net/app.DIR2015
DIR2015
International Symposium on Digital Industrial Radiology and Computed Tomography
Inspection of welded object based on the shape from shading image processing method Amir Movafeghi1, Effat Yahaghi2, Nouroddin Mohammadzadeh1 and Berouz Rokrok1 and Nasser Rastkhah1 1
Nuclear Safety and Radiological Protection Department, Nuclear Science and Technology Research Institute, Tehran, Iran Email:
[email protected] 2 Department of Physics, Imam Khomeini International University, Qazvin, Iran Email:
[email protected]
Abstract Industrial radiography is one of the most important NDT methods to detect weld defects such as porosity, pinhole, bubble and crack. All these defects can be detected automatically and the weld defect can be characterized by the interpretation of radiographic images. If the provided images of the industrial radiography have not been clear, the detection of defect can be difficult. The defect detection probability depends on radiographic film quality and interpreter’s experience and abilities. The radiographic images are sometimes noisy and have low quality. Thus, there is a necessity for some methods for increasing the image quality for better detection of the defects. The use of image processing techniques is available to achieve this aim. This paper introduces a method of shape from shading based on a single image and puts forward its implementation. It then presents the improved measures of the original algorithm according to the defects of the computed results. Shape-from-shading (SFS) is a classic problem in computer vision. The goal is to derive a 3D image from 1D or 2D images. The human vision system can guess both the shape of the surface and the direction of the incident light for an image of a surface. It is notable that the human eye is used to see objects in three dimensions and can also detect depth. Thus, in this research, the SFS method is applied on two-dimensional digitized radiographic images and three-dimensional images are extracted. Experts’ opinions have also been used for evaluation of the results. Experts’ view say that the SFS method is useful in the detection of welding defects and the combination of image processing techniques, and also the SFS method can produce clear radiography image, which can be used effectively in the detailed analysis of weld images. The results of comments are indicated that using the SFS method is useful and the detection of defects is improved by this method in weld radiography. Keywords: industrial radiography; image processing; shape from shading; weld defect; radiography interpreter.
DIR2015
International Symposium on Digital Industrial Radiology and Computed Tomography
1. Introduction Radiography is one of the most important non-destructive methods (NDT) to detect the welding defects on a film viewer or a high contrast monitor in digital radiography. Also, industrial radiography is a useful technique for the identification and evaluation of discontinuities, or defects, such as cracks, porosity and foreign inclusions found in welded joints. In this method, X- or Gamma rays are used to determine internal defects of the welds [1, 2]. Defects identifications has its own difficulties arising from some factors that reducing image quality ,e.g. streaks, fog, and spots. Therefore, the radiographic images are not always easy to interpret. Image processing methods can analyze the radiography images and help for better interpretation. The brightness and contrast of radiography images can be changed by different the mathematical algorithm [2-5]. One of a classic problem in computer vision is shape-from-shading (SFS). The goal is how the shape of a three dimensional object may be recovered from shading in a two-dimensional image of the object. SFS is one of the important problems in machine vision. Although this important subfield is now in its second decade, but the different methods are introduced for reconstruction of 3D image. In some approaches, a Lambertian reflectance model for the surface is assumed, and also that the surface is lit with a single distant light source. It allows computation of a shaded image for any given surface and light source direction. The SFS problem is the inverse of this image synthesis process; for finding the shape of the 3D surface and the light source direction for an image [6-7]. 2 Methods 2.1 Radiography images Radiographic experiments were conducted on the welded objects using Kodak AA-400 film, a gamma source of Ir-192, and an X-ray machine , (300 kVolt Pantak-Seifert, Type Eresco 65 MF2). X-ray energy was set at 200 kVolt. The radiographs were converted to digital images format using a film digitizer. The radiographs were scanned with a Microtek 1000 XL scanner [8-10]. The scanner was calibrated using ‘density calibration film’ to convert gray levels to optical density for every scan. Fig. 1 shows the example of a digitized radiograph of the object which was used for further digital processing.
2.2 Shape from shading and wavelet denoising The goal of shape from shading is to derive a 3D scene description from one or more 2D images. The reconstructed image by SFS approach is expressed by these parameters: The depth, Z(x, y), surface normal vector, (nx, ny, nz), surface gradients, p, q, surface slant, φ and tilt, θ. The depth is the relative with distance from the X-ray source to surface points, or the relative surface height above the x-y plane. The surface normal is the orientation of a vector perpendicular to the tangential plane on the object surface. The surface gradient in the xdirection, p=
( , )
and in the y-direction, q =
( , )
; are the rate of change of depth in the x
DIR2015
International Symposium on Digital Industrial Radiology and Computed Tom Tomography
and y directions. The surface slant φ , and tilt θ, are related to the surface normal N=(n N=( x, ny, nz)= (ll sinφ cosθ, l sinφ sinθ, l cosφ ),, where l is the magnitude of the surface normal. Comput Computing the image brightness; it can be rewritten as follows; R
,
= ρN n = ρN
, ,
(1)
where , is the image brightness and ρ is a constant value and is defended as Albedo value and is depended to material. For each pixel, is calculated and SFS image are , reconstructed [6, 7]].
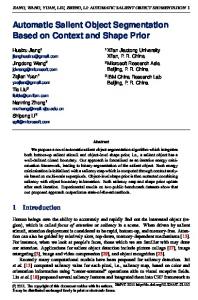
Figure ure 1 a typical ypical example of a) the original radiographic images and the reconstructed images by b)) denoising wavel wavelet et and c) SFS algorithm For denoising of radiography image image, the wavelet transform approach is implemented. Signal denoising is one of the important applications of the wavelets. wavelets. Following wavelet decomposition, the high frequency components contain most of the noise information and little signal information. Therefore, soft thresholding is applied to various components. The threshold old is applied to higher values for high frequency components and lower values for low frequency components. 3. Results and Discussion The he radiography image often has low contrast, and need to be processed. In the research research, SFS was applied to different radiography image images to improve the image quality and detectability of weld defects. At the first stage, the SFS algorithm was directly implemented to the original radiography images from some welded specimens that were provided according to section
DIR2015
International Symposium on Digital Industrial Radiology and Computed Tom Tomography
2.1. Then the digital image imagess were opened and denoising algorithm and SFS method were applied to the image data (section 2.2). The image processing program was written by MATLAB 2012 b software. For this, synthetic images were extracted with the assumption of ρ=0. ρ=0.6 and I = [0, 0, 0 T 1] . The chosen ρ isn’t effect on the reconstructed image because it is a constant value in equation (1). Figure ure 1 shows a typical ypical example of the original radiographic images and the reconstructed images by denoising wavelet and SFS algorithm. However, the reconstructed images in Fig. Fig.1-b,, the image are smoothed and the defect defects aren’t n’t detectable clearly.. Figure 1-c shows some defects such as porosity and crack in 33-D visualization have depth but all gradient variations appear as noise in this image.
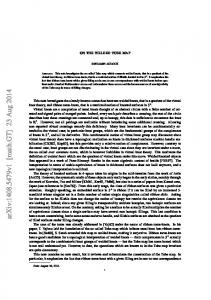
Fig. 2: The line profile of the region defect (The yellow line in figure 1) for the original image (solid line) and the denoised image (the dashed line)
Fig. 3: The line profile of the region defect ((yellow yellow line in Fig. 1) for the reprocessed image by SFS
For evaluation of the results, results the line profiles of the defect region are plotted in figures 2 and 3. These regions are shown in figure 1 by yellow lines. It is noticeable that the line profile for denoised method by wavelet is smoothed due to the line profile of original image. Also, the line profile in reconstructed reconstructed image by SFS approach has higher depth comparison
DIR2015
International Symposium on Digital Industrial Radiology and Computed Tomography
with the other two images. Therefore, style and depth detectability can be improved by this method which shows probability of detection (POD) will be increased. 4. Conclusions In this research, a wavelet denoising algorithm and SFS method have been implemented to radiographic images in order to eliminate noise and 3D images reconstruction. The results show that SFS algorithm and wavelet denoising can be relied on for better detection of weld defects in radiographic images, and these methods can improve shape, style and region of defect distinction. Reference 1. K Edalati, N Rastkhah, A Kermani, M Seiedi and A Movafeghi, ‘The use of radiography for thickness measurement and corrosion monitoring in pipes’, International J. of Pressure Vessels & Piping, Elsevier, pp. 736-741, Vol. 83., 2006. 2. X Li, S K Tso, X P Guan, Q Huang, ‘Improving automatic detection of defects in castings by applying wavelet technique’, IEEE Trans Industrial Electronic; 53(6), pp. 1927–34, 2006. 3. B Rokrok, K Edalati, E Yahaghi, N Mohammadzadeh, N Rastkhah and A Movafeghi, ‘Three-dimensional mapping of non-complex specimens by image processing and optical density evaluation of digitised radiographs’, Insight, Vol. 51, No 6, June 2009. 4. M Weilei; G Jianmin; J Hongquan; Ch Fumin; W Zhao; D Changying, ‘A radiographic image quality assessment algorithm based on network topology analysis’ Insight - Non-Destructive Testing and Condition Monitoring, Volume 56, Number 1, , pp. 10-14(5), January 2014. 5. ASME, ‘Digital image acquisition, display, interpretation and storage of radiographs for nuclear applications’, ASME Boiler and pressure vessel code and standard, Section 5, Article 2, American Society of Mechanical Engineering, 2013. 6. Imperial College, London, MEng Individual Report A, ‘A Study of Statistical Methods for Facial Shape-from-shading’, June 18, 2012. 7. A Ahmed, and A Farag, ‘A new statistical model combining shape and spherical harmonics illumination for face reconstruction, in Advances in Visual Computing’, Lecture Notes in Computer Science, vol.4841, pp. 531,541, Springer, 2007. 8. EN 14096-1, “Non-destructive testing – Qualification of radiographic film digitization systems – part 1: Definitions, qualitative measurements of image quality parameters, standard reference film and qualitative control”, European Norm, 2004. 9. EN 14096-2, “Non-destructive testing – Qualification of radiographic film digitization systems – part 2: Minimum requirement”, European Norm, 2004. 10. Microtek Co., “Operation Manual of Scanmaker-1000 Scanner”, 2005.